


Gold Sets Up for Break Ahead of Heavy Event Risk
The next week is massive as US inflation data leads into an FOMC rate decision with high probability of a rate hike. Higher US rates can draw capital from non interest bearing markets such as gold, but as usual, the matter isn’t quite so simple.
Written by
James Stanley
Sr. Strategist
Gold Talking Points:
- Gold took a hit after the Kevin Warsh speech at Jackson Hole and then another last Friday after NFP, although sellers weren’t able to stretch down to a lower-low and that has helped to set up a short-term symmetrical triangle.
- With rate hike odds expanding into next week’s FOMC the bullish fundamental case for gold has dimmed a bit, but fundamentals aren’t a perfect push point for price as actual supply and demand are more potent levers.
- With the support build at $4k followed by the $4300 support test perhaps the larger question on gold is one of institutional accumulation, even with higher US rates bringing the possibility of drawing capital flows from non-yielders such as gold.
The true test of trend is what happens when matters shift or change, and this is what can create pullback opportunities. But whether it’s a pullback or start of a reversal will only be known after the reaction (or lack of reaction) shows.
As we go into a couple of high impact inflation prints later this week with PPI and CPI and then the FOMC rate decision next week, which currently carries high odds of a 25 bp hike from the Fed, the question for gold is whether buyers are still standing on the sidelines looking to use this as opportunity to add to long positions.
A good example of this played out earlier in the summer, when rate hike odds flared after Kevin Warsh’s first meeting at the Fed. The Dollar broke out and gold broke down, finally testing the $4k level that was previously defended quite well. That price was tested for about a month, until after the next FOMC meeting in July after which gold bulls posed an outsized move to drive the metal by more than 17.5% over the course of a few weeks.
It can be easy for this to get lost in the shuffle but perhaps the most important element of that event was the fact that buyers kept showing up on tests below the $4k handle as a show of perceived value – even when the fundamental environment, brought upon by inflation and rate hike odds – was going in a different direction. It’s that very divergence that highlights something that can be of interest to traders and when the fundamental environment or backdrop shifts, and that support has already set in, bulls are in position to make a run such as what we saw in gold in August.
Gold Weekly Price Chart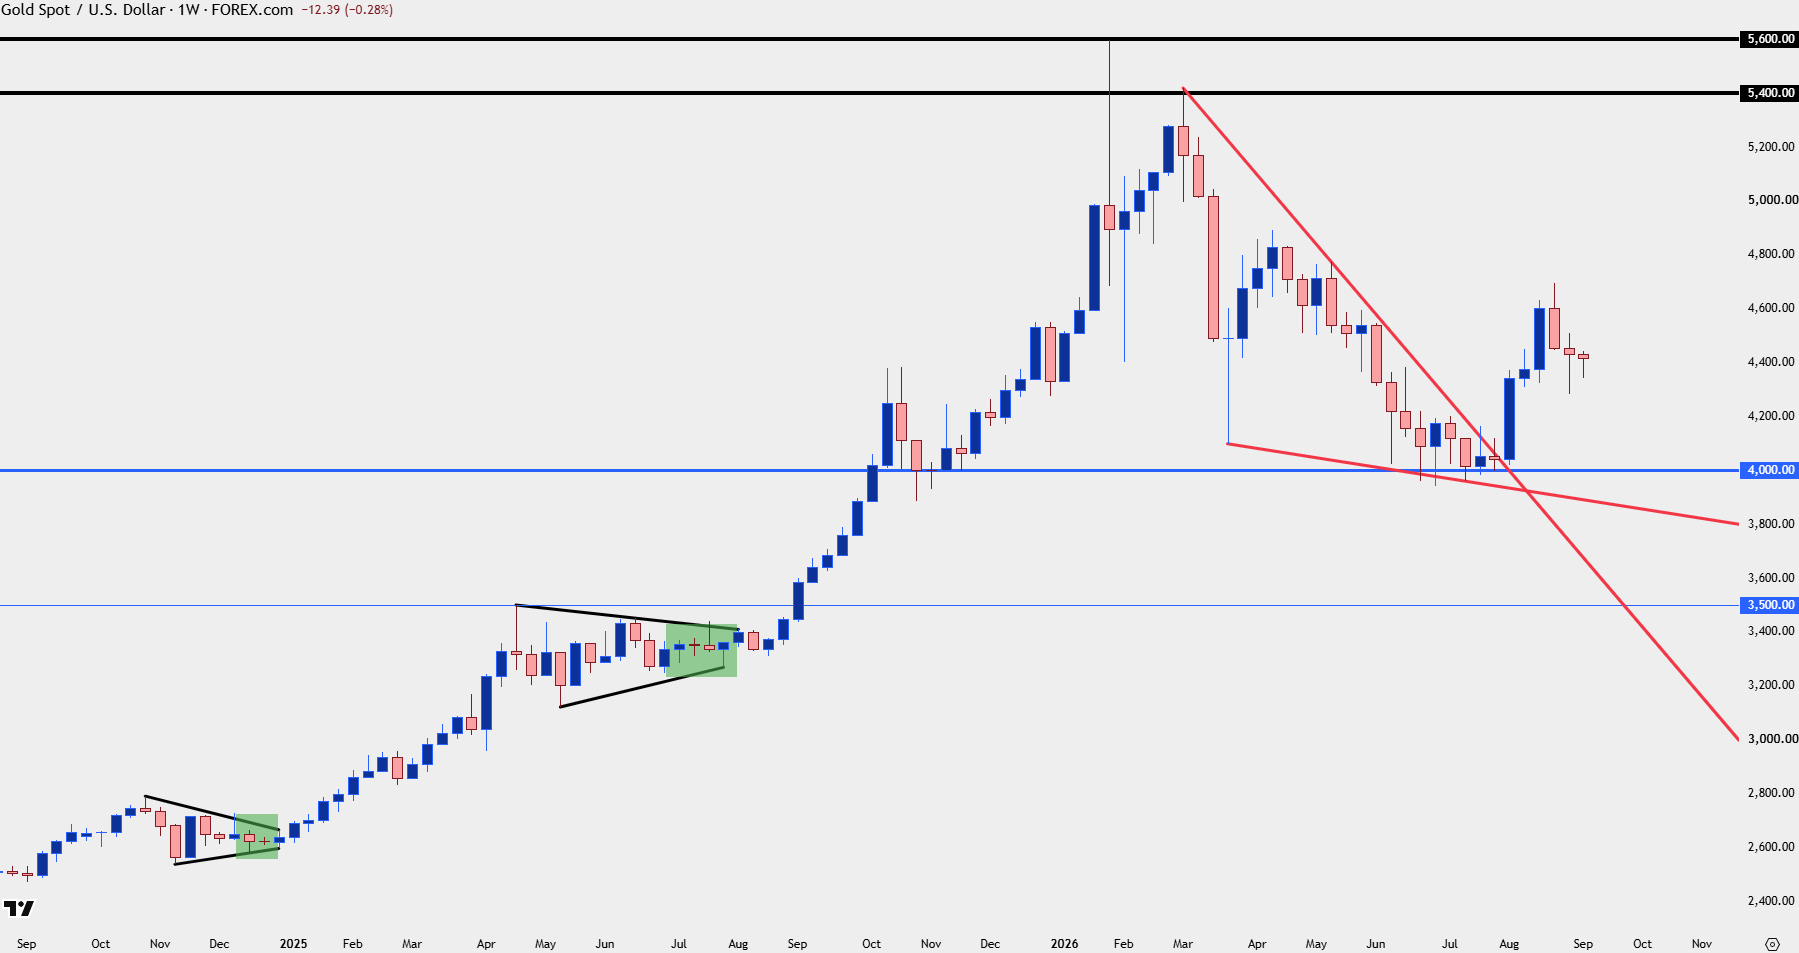
Chart prepared by James Stanley; data derived from Tradingview
Gold: The Counter Scenario
Given the recent rise of hawkish lean, from Warsh’s speech at Jackson Hole to last week’s NFP report, the fundamental environment has very much been a headwind for gold. And we’ve seen that in price, as the metal has dipped from the run at $4700 just a few weeks ago.
So far, the $4300 level has stood in as support, but for this example, let’s assume that inflation data keeps the door open for a rate hike next week, and let’s also assume that the Fed does vote to hike, which, again, is pretty much the exact opposite scenario that gold bulls would usually want to work with.
If this happens the rational expectation would be for a larger pullback – but perhaps more enticing is what happens if that pullback fails to breakdown to a lower-low. This would put the $4k level on the radar as a point of support for bullish setups.
But perhaps even more attractive than that is if the same institutional pressure that supported the bid at $4k steps in a bit earlier, such as the $4200 prior resistance or the $4100 level below that.
Gold Daily Chart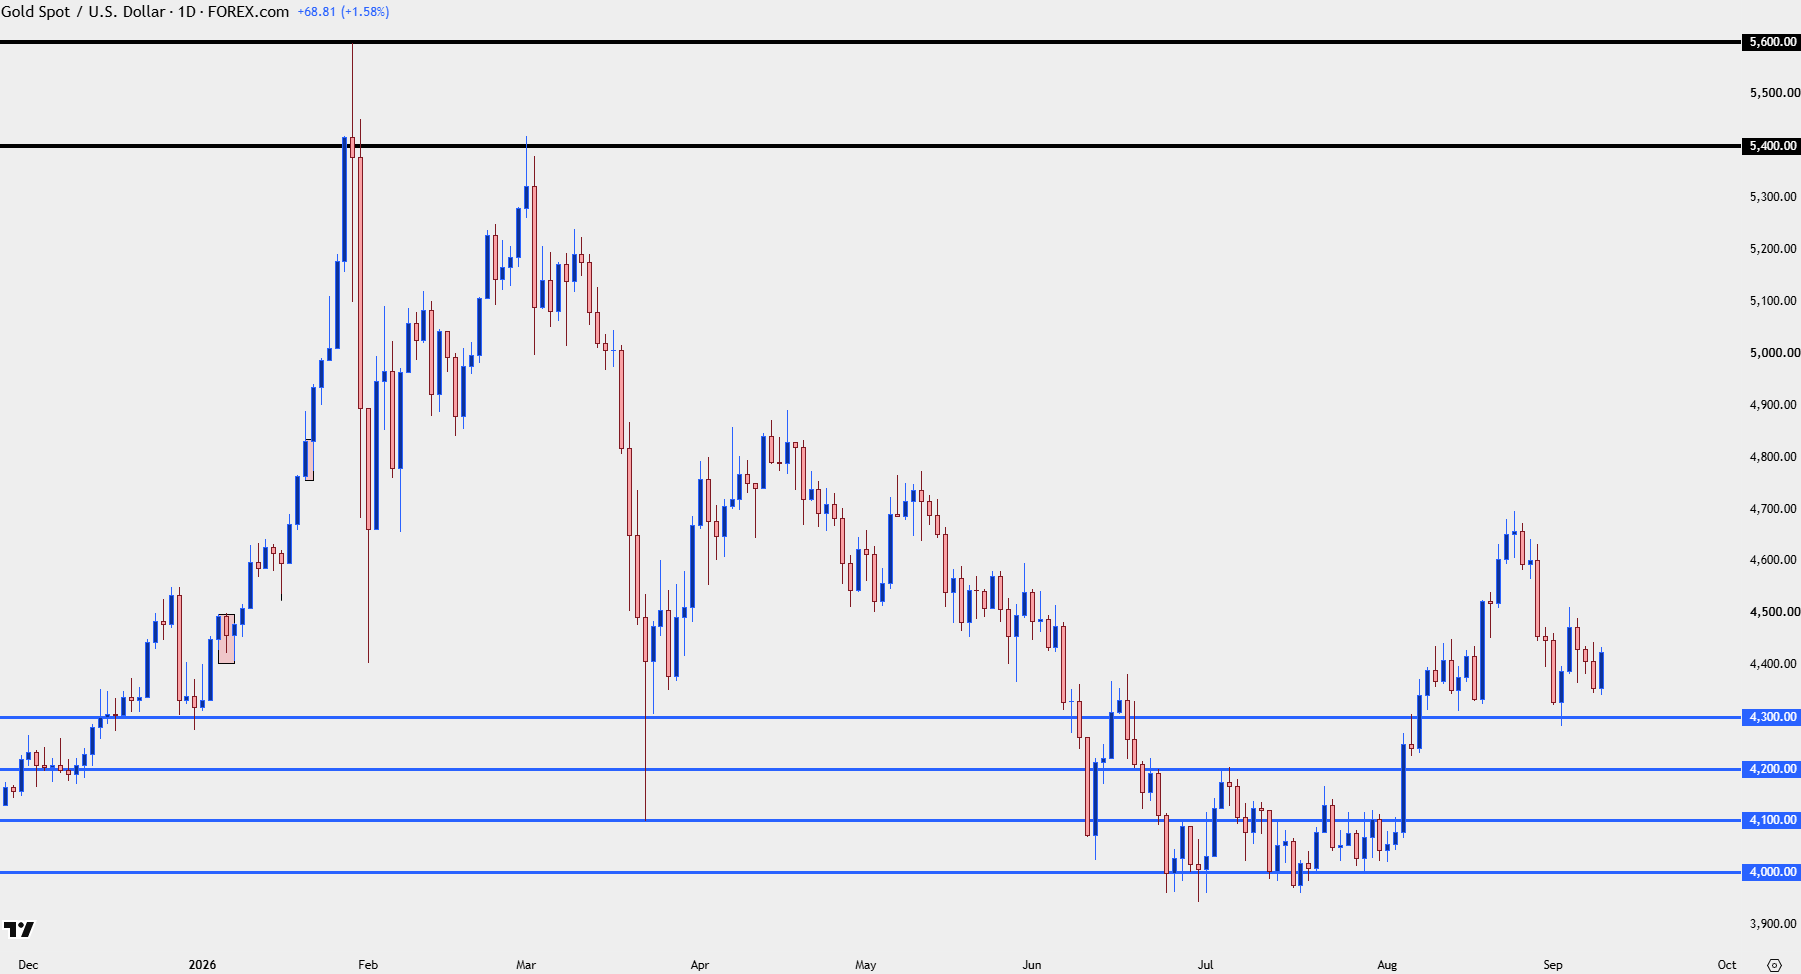
Chart prepared by James Stanley; data derived from Tradingview
Gold Compression
At this point there’s a case to be made on both sides of short-term gold charts as there’s been both lower-highs and, more recently, a higher-low. This type of symmetrical triangle doesn’t carry a directional connotation, although given the sell-off leading into it can be construed as a bear pennant which would lean more to the short side.
If that is the case, that sets up the above tango quite well, particularly if we see strong inflation and a hawkish lean around the FOMC. But – if we don’t, and if the above counter-scenario doesn’t play out, the next look would be for bulls to mount a rally above the $4500 level that was resistance last week, which would point to buyers getting back in the driver’s seat of the larger trend which would then point to re-test of $4600 and a test of $4700 before the metal might fling up to fresh highs.
It would seem as though below-expected inflation would be needed for such a scenario but traders should avoid getting married to that because, as we’ve seen, price and fundamentals don’t always move in the same direction. And of the two, price is more important because that’s what hits stops and can cause margin calls.
Gold Four-Hour Chart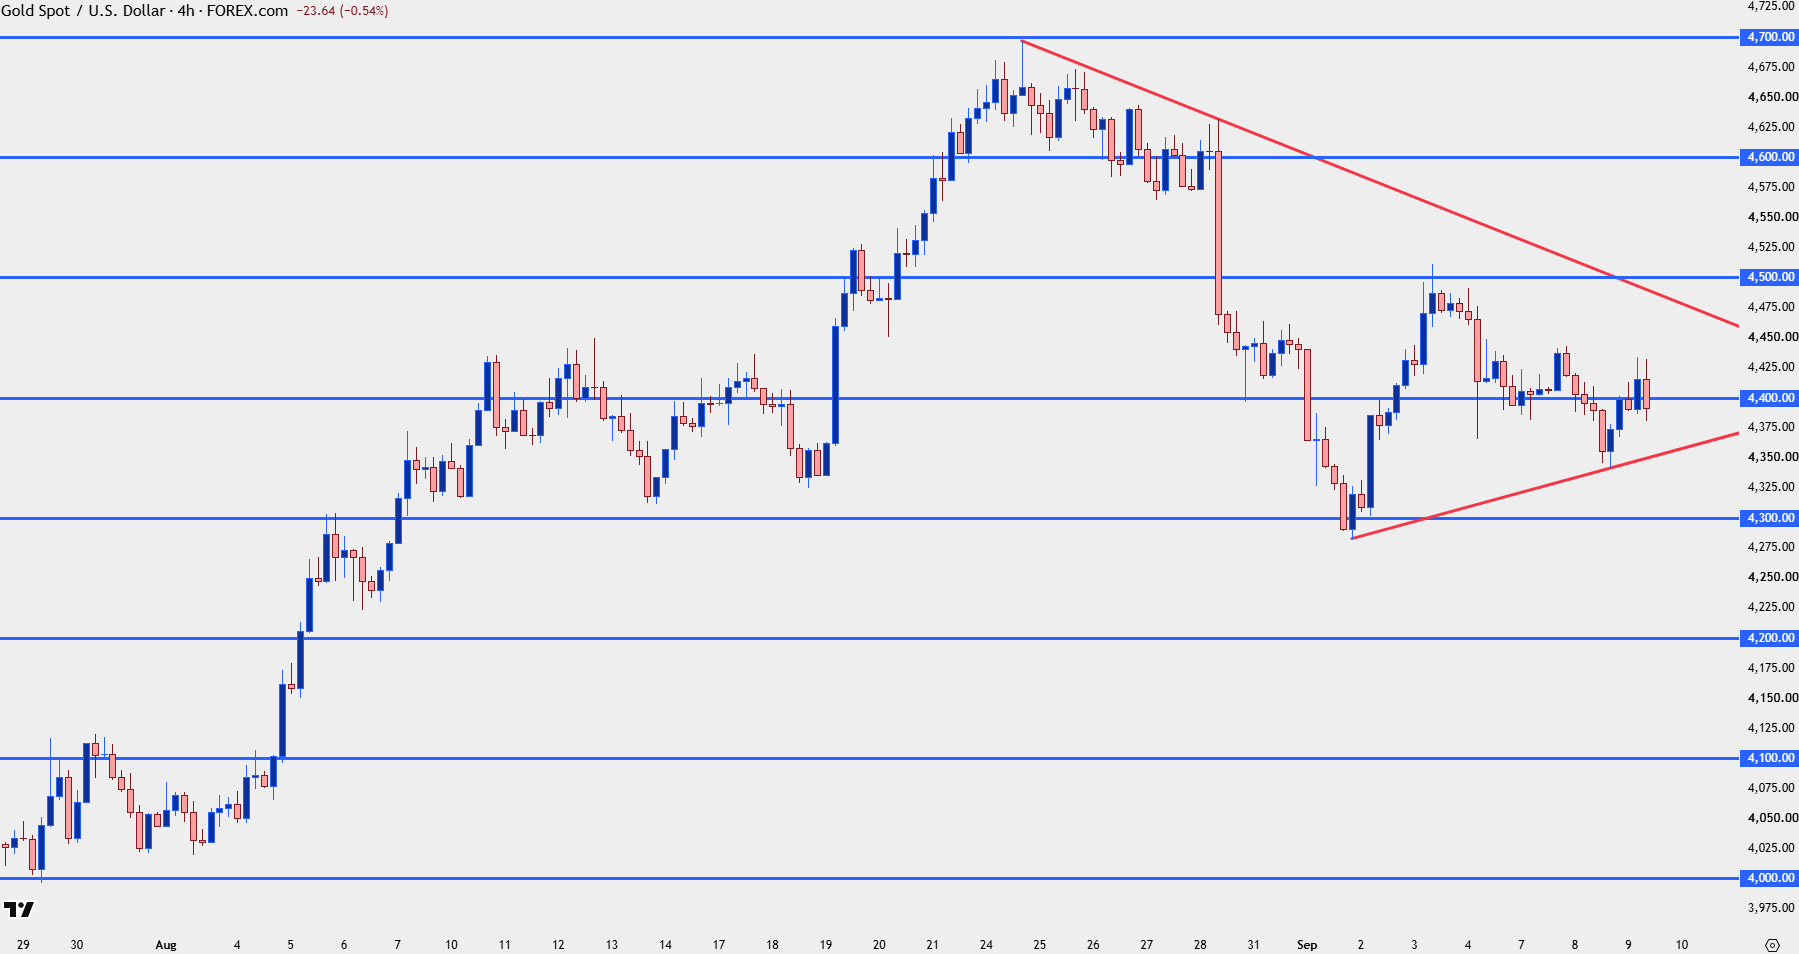
Chart prepared by James Stanley; data derived from Tradingview
--- written by James Stanley, Senior Market Analyst, Global Macro
Related tags:
Latest market news









Web Trader platform
Our sophisticated web-based platform is packed with features.
Open an account today
Experience award-winning platforms with fast and secure execution.
Economic calendar
Related articles

Gold and S&P 500 analysis: What now after Warsh’s hawkish speech?
The dollar surged across the board after the Fed Chair Kevin Warsh surprised with a hawkish-leaning speech at the Jackson Hole summit. All the bearish dollar bets that had been accumulated since last Friday on the back of data weakness and bond market troubles had to be squared and that triggered a short squeeze rally for the dollar. Gold and silver dropped, as a result, as too did bitcoin, while US indices were giving back earlier gains.


Gold Falters at Resistance, Grappling With PCE, Month-End Flows and Jackson Hole
Gold has pulled back from resistance after sticky PCE data, with month-end flows and Jackson Hole now shaping the near-term outlook.


Gold forecast: XAU/USD retreats along with dollar debasement trade
Gold was down nearly 1.5% on the session, with US indices and Bitcoin also struggling. Is this a mere pause before more gains are seen, or have we already seen the end of the recent bullish advance?