


Bessent’s buybacks: Will Treasury reignite the dollar debasement trade?
Gold and Bitcoin surged when Treasury first flagged larger long-dated Treasury buybacks in August, while USD/JPY fell sharply. Today’s announcement could determine whether we a resumption or reversal of those moves.
Written by
David Scutt
Market Analyst
- Treasury has already pledged to at least double long-end buybacks
- That would lift annualised capacity to around $144bn
- Gold, Bitcoin surged after the initial August announcement
- A materially larger figure could reignite dollar-debasement trade
- $10bn per operation looks unlikely given the volatility risk
On Wednesday, the US Treasury looks set to announce just how big its expanded long-dated Treasury buyback operations will be, having already committed to at least doubling the maximum amount it can purchase in a statement released in August.
When that change was first announced, the market reaction was significant. The US dollar fell sharply as the move rekindled the dollar-debasement trade that had been in full swing across various cohorts in markets late last year and earlier this year, helping to fuel big gains in crypto and precious metals in particular.
Bessent’s buybacks: What exactly is changing?
To get a sense of exactly what Treasury’s announcement later today refers to, it makes sense to take a step back and look at what it has been doing up until this point, along with the scale of longer-dated debt it is issuing.
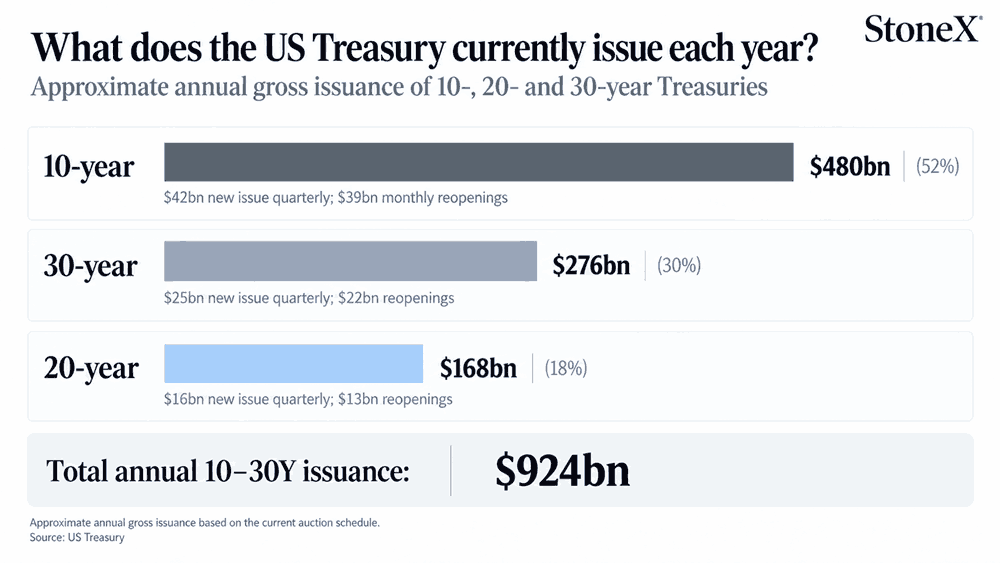
At current auction sizes, Treasury is issuing roughly $924 billion of nominal 10-to-30-year debt each year, comprising around $480 billion in 10-year notes, $168 billion in 20-year bonds and $276 billion in 30-year bonds.
Up until this point, Treasury has been conducting what are known as buybacks, where it purchases a small proportion of outstanding issuance with a maximum size of $2 billion per operation, targeting older, less-liquid securities between 10 and 30 years.
At the current cadence, around nine operations are conducted per quarter, or roughly 36 per year, which gives the program an absolute annualised limit of $72 billion in buybacks.
Despite the similarity in some aspects to what the Federal Reserve has done with quantitative easing previously, what Treasury has announced does not amount to that. Treasury is buying securities using cash rather than the Fed creating reserves to purchase them, meaning the purchases ultimately need to be funded either through additional US government debt issuance elsewhere on the curve, or by drawing on existing balances in the Treasury General Account, as some media reports have suggested.
If Treasury were to fund the purchases through increased issuance of shorter-dated securities such as bills, the effect would be something akin to an Operation Twist-style maturity shift, reducing the amount of longer-dated US government debt in private hands while increasing supply towards the front end of the curve.
How large could the buybacks become?
In the statement released on August 19, Treasury said it would at least double the size of its longer-dated buybacks.
That means today we are looking at a minimum of $4 billion per operation, which, if Treasury maintains the same number of operations across the same tenors, would see the current $72 billion annualised limit increase to $144 billion, equivalent to approximately 15.6% of current annual gross 10-to-30-year issuance.
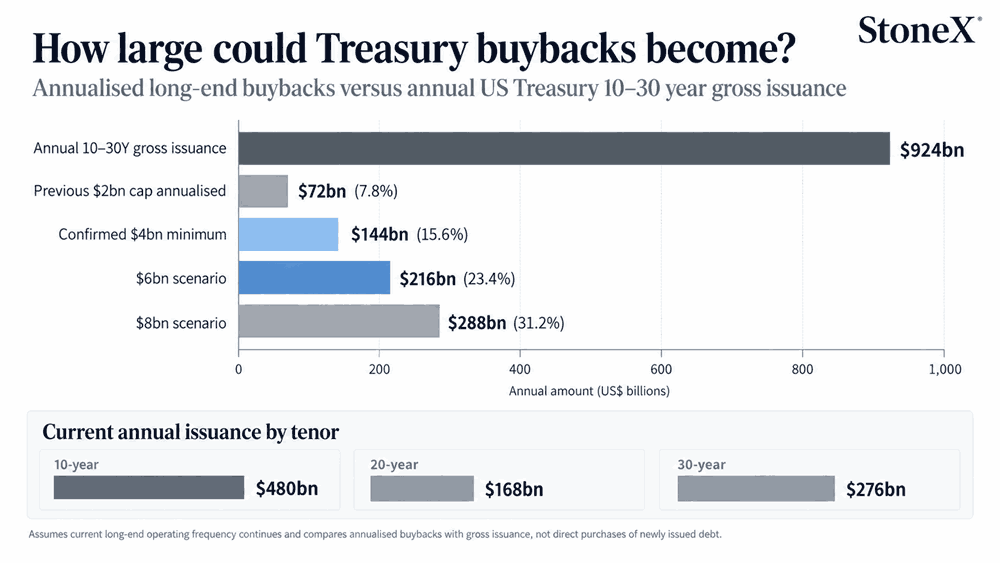
The question markets are now pondering is how much Treasury will look to repurchase. Will it stick with just the doubling, or go further? Several estimates have centred around $6 billion per operation, which would equate to nearly a quarter of current annual longer-dated issuance, while larger estimates suggest buybacks could absorb closer to a third.
When does market functioning morph to yield suppression?
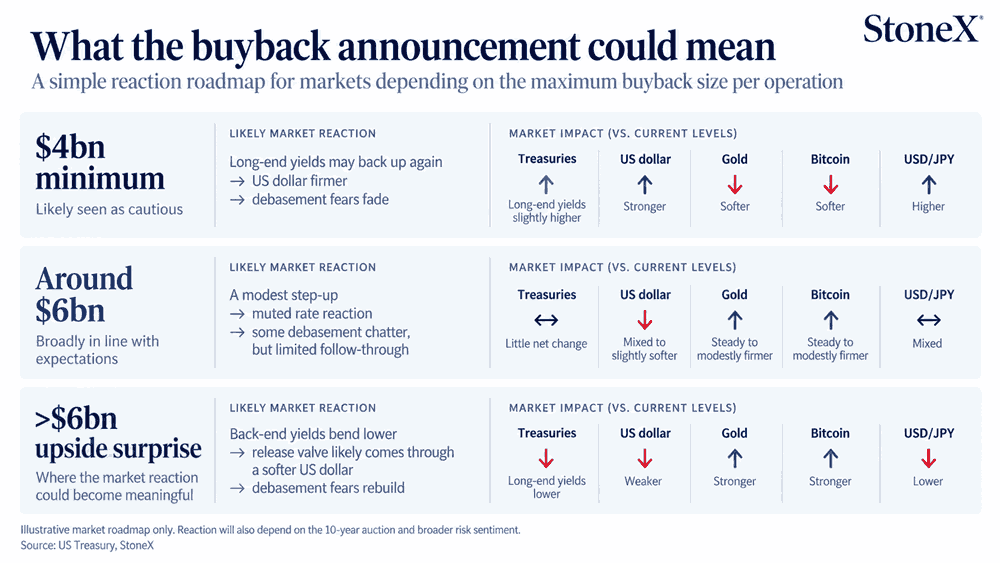
You get the impression that $4 billion would be deemed conservative relative to the estimates out there at the moment, looking far more like a liquidity-enhancing operation than any attempt to artificially suppress borrowing costs further out the curve.
The more interesting question is whether we get a figure around $6 billion. Given what we saw following the initial announcement less than a month ago, anything beyond simply doubling current buybacks may rekindle the same trade that emerged back then.
A figure materially above $6 billion per operation would likely really stir the dollar-debasement trade again and could shift the interpretation beyond simply improving liquidity in older long-duration securities, towards something more akin to yield suppression and an attempt to counter market forces.
The scenarios below are a guide to how markets may react rather than a prediction of what will necessarily happen.
What happened last time?
When Treasury first flagged the larger buybacks on August 19, the immediate market reaction followed the dollar-debasement playbook. Gold jumped sharply, Bitcoin rallied even harder, while USD/JPY fell as the dollar weakened and long-end yields came under pressure.
While the subsequent performance of those markets has varied in the period since, with the dispersion reflective of other factors, the broader message is that not only may today’s announcement create volatility, it could lead to a more lasting market move, especially if Treasury provides a strong hint that the increased buyback size has become a permanent feature beyond the current refunding period, or that even larger buybacks may be considered in the future.
Given they were amongst the biggest market movers when the original Treasury announcement came through, it makes sense to look at the technical setups in gold, Bitcoin and USD/JPY to gauge directional risks and the levels to watch either side of where they currently trade.
Gold: Key levels around the Treasury decision
Source: TradingView
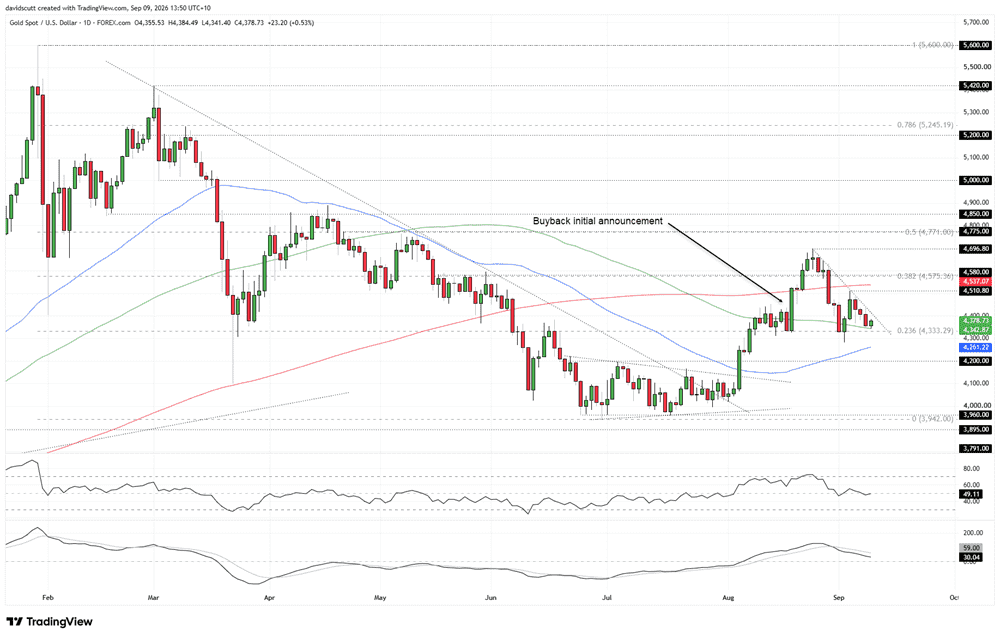
Gold has now completely retraced the move that followed the initial buyback announcement, leaving the price sitting in a downtrend running from the high set on August 25. The 100-day moving average and 23.6% Fibonacci retracement of the January-to-June bear move are the immediate focal points underneath where gold currently trades.
The oscillators are sitting in neutral territory, with RSI (14) just beneath 50 and MACD below its signal line while remaining in positive territory. As a result, I have no firm directional bias heading into the buyback announcement.
What is notable is that in the period either side of when the increased buyback size was first announced, the price has repeatedly found support around and beneath the 23.6% retracement. Depending on the detail later in the session, you get the sense we could see either a break of the downtrend or a move beneath the lows set in early September, below $4,300 an ounce.
If the move is to the downside, a break beneath the September low would bring the 50-day moving average into focus, along with $4,200 an ounce, the latter marking the top of the breakout zone seen at the start of the initial gold move in early August.
Should gold break above the downtrend running from the August 25 highs, $4,510 is the high set on September 3, with the 200-day simple moving average located just above at $4,537 an ounce. Another notable resistance zone sits overhead, where the 38.2% Fibonacci retracement of the January-to-June bear move runs alongside horizontal resistance at $4,580. That is the last major barrier standing in the way of a potential retest of the August swing high at $4,696 an ounce.
Bitcoin: Range holds, but momentum cools
Source: TradingView
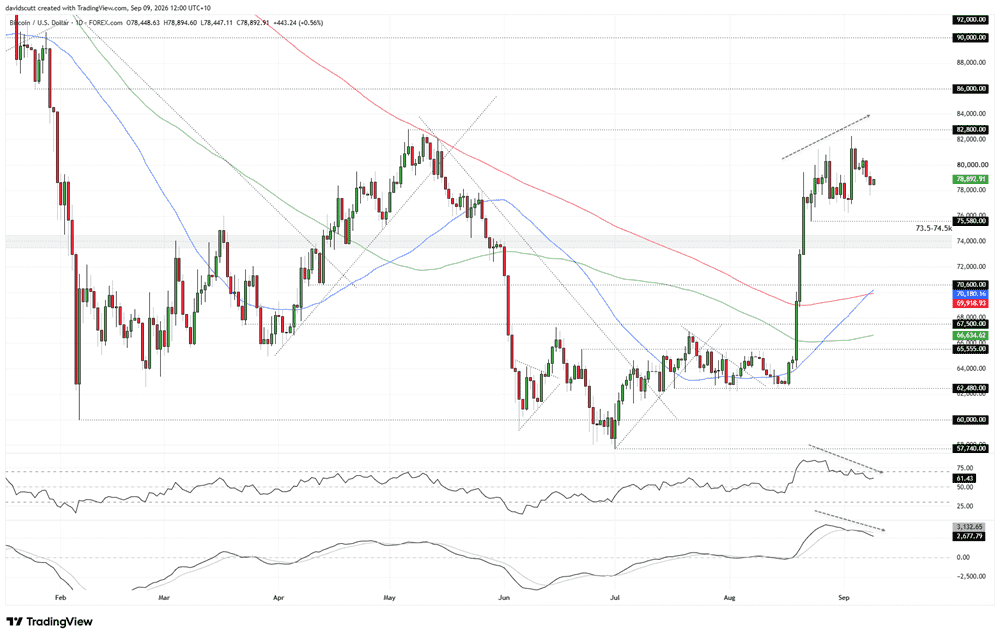
Bitcoin has been extremely rangy since the initial surge sparked by the buyback announcement, including a break above the important $73,000–$74,500 zone that has sparked some sizeable moves in the past. Since then, the price has largely consolidated between $75,580 and just above $82,000, with recent moves beneath $77,000 repeatedly attracting buyers without generating a definitive resumption of the initial bullish thrust.
The oscillators have rolled over, including possible negative divergence between the price and RSI (14), but they are not providing an outright bearish signal. It is more a message of caution for the bulls than one telling the bears to load up. RSI (14) is trending lower but still sits around 61, while MACD has crossed beneath its signal line but remains firmly in positive territory.
For what it’s worth, Bitcoin also registered a golden cross earlier this week as the 50-day moving average crossed above the 200-day, although there has been little notable reaction so far.
The prevailing range remains the immediate focus. Above it sits the May swing high at $82,800, with a break pointing to potential tests of $86,000 and then $90,000. Beneath the range, the $73,000–$74,500 zone is important. Should the price slink beneath that, $70,600 looms as the first real area of support, particularly with the 50- and 200-day moving averages sitting just below.
USD/JPY: Bearish but Oversold
Source: TradingView
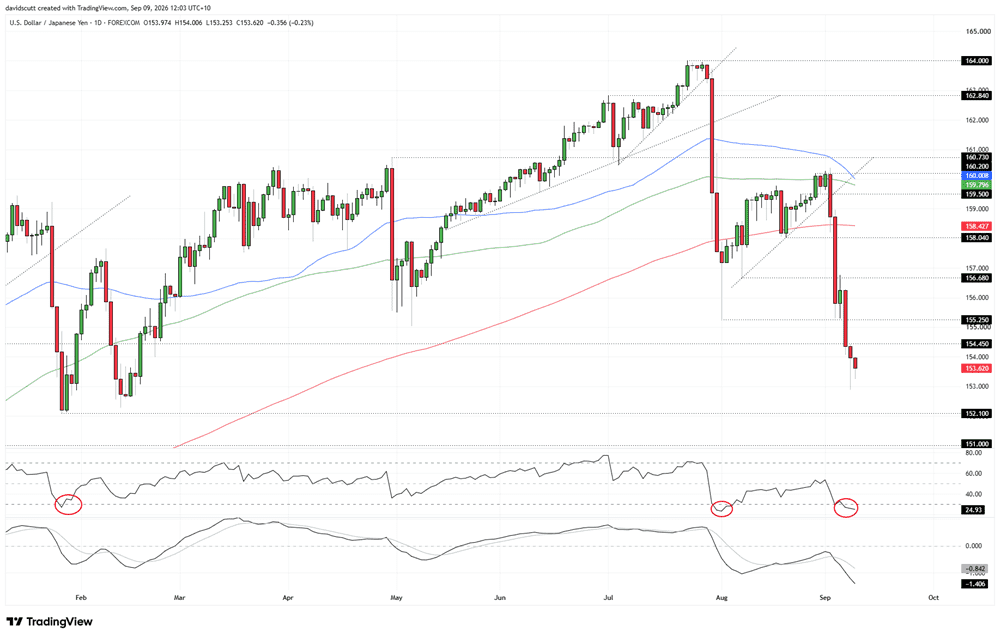
Turning to USD/JPY, while the initial knee-jerk reaction to the buyback announcement was reversed over the following week after a failure to break cleanly beneath the 200-day moving average, the price action in the period since has been definitive. A break of the minor uptrend running from the low set in early August was followed by a cascading move through multiple support levels, including the 200-day moving average and 155.25, which was the low set during the intervention episode of late July and early August.
While Tuesday’s daily candle resembled something akin to a hammer, it certainly wasn’t textbook and there has been absolutely no follow-through buying so far in Asia, with the price moving back beneath 154 towards Tuesday’s session low of 152.95.
Given the current speed of the move, selling into strength is favoured, with 152.10 and 151 two levels of note on the downside, the latter particularly important given it has acted as support and resistance on multiple occasions going back several years. Overhead, 154.45 has similarly seen plenty of price action either side of it over the course of this year and into 2025, with 156.68 the next level after that, coinciding with the low set on August 7 that then flipped to offer resistance in early September.
While the price action has been definitive, one thing that stands out is just how oversold the pair now is on a short-term basis. RSI (14) sits at 24 and continues to push lower, while MACD has crossed beneath its signal line in negative territory and is diverging further away from it.
It’s not shown on the chart, but the ATR (14) stretch indicator currently sits 4.3 times away from the 50-day moving average, the most extreme reading since September 2024. So while there are both fundamental and technical factors explaining the move, it is obvious the pair is vulnerable to some sort of violent squeeze given the right conditions.
As such, if Treasury only delivers a doubling of the buyback amount, given the speed and scale of the move already seen, that could be the catalyst to spark a reversal of the prevailing bearish trend.
Latest market news











Web Trader platform
Our sophisticated web-based platform is packed with features.
Open an account today
Experience award-winning platforms with fast and secure execution.
Economic calendar
Related articles

FX Futures Positioning: Dollar Rebound Meets Diverging Forex Bets | COT Report
US dollar longs held firm into Jackson Hole, while euro, yen and commodity FX positioning diverged ahead of ISM and NFP.


Gold and S&P 500 analysis: What now after Warsh’s hawkish speech?
The dollar surged across the board after the Fed Chair Kevin Warsh surprised with a hawkish-leaning speech at the Jackson Hole summit. All the bearish dollar bets that had been accumulated since last Friday on the back of data weakness and bond market troubles had to be squared and that triggered a short squeeze rally for the dollar. Gold and silver dropped, as a result, as too did bitcoin, while US indices were giving back earlier gains.


Nasdaq 100 Forecast: NDX slips ahead of Fed Chair Warsh’s speech
U.S. stocks are edging lower on Friday, giving back some of yesterday's gains after Nvidia's strong outlook revived the tech trade. The focus has now shifted firmly to Fed Chair Kevin Warsh's Jackson Hole speech, with investors looking for more clarity on the outlook for interest rates.
