


Gold, silver surge as Treasury fans embers of dollar debasement trade
The US dollar was hammered after Treasury moved to support longer-dated bonds, sending gold and silver sharply higher. It may be premature to declare the debasement trade back, but the embers are glowing.
Written by
David Scutt
Market Analyst
- Treasury doubles long-dated bond buybacks
- US public debt exceeds $40 trillion for first time
- Short covering likely amplified Wednesday’s bond-market reversal
- USD weakness revives debasement trade narrative
- Gold and silver rip higher as the greenback slumps
Yesterday, I argued that the US dollar was likely to be the key variable in determining whether the breakouts seen in gold and silver earlier this month would extend further or reverse.
Less than 24 hours later, we got our answer.
The dollar was absolutely shellacked on Wednesday as the US Treasury stepped in to support the long end of the bond market, helping gold and silver rip higher in response.
Treasury acts to support long bonds
Treasury announced it will double buyback sizes for 10 to 30-year debt to at least $4 billion per operation, potentially offsetting those purchases through greater issuance of shorter-dated securities. Selling short, buying long.
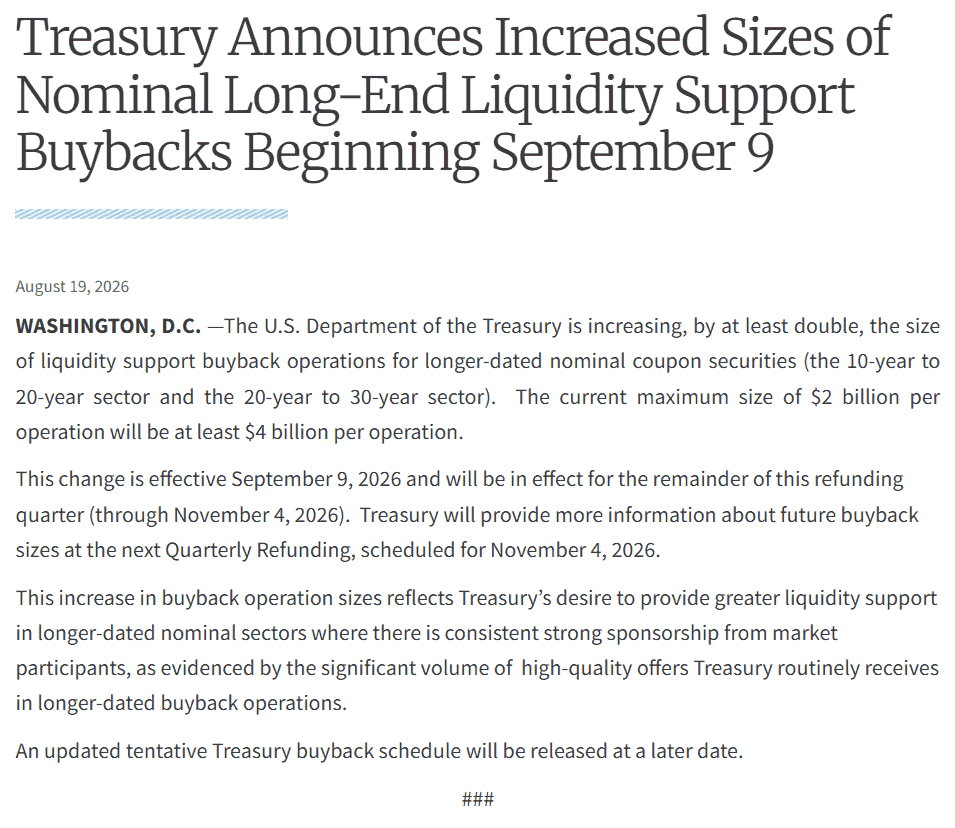
Source: US Treasury
Officially, the move is being sold as a mechanism to improve market functioning in longer-dated Treasuries. You can read the announcement for yourself above. But let’s not kid ourselves about what this is about: trying to cap the rise in longer-dated yields before higher borrowing costs create even more problems elsewhere in the economy.
The announcement came after a sharp backup in long-dated Treasury yields, with the 30-year yield briefly touching 5.34%, its highest level since 2007, as traders demanded greater compensation for holding US government debt.
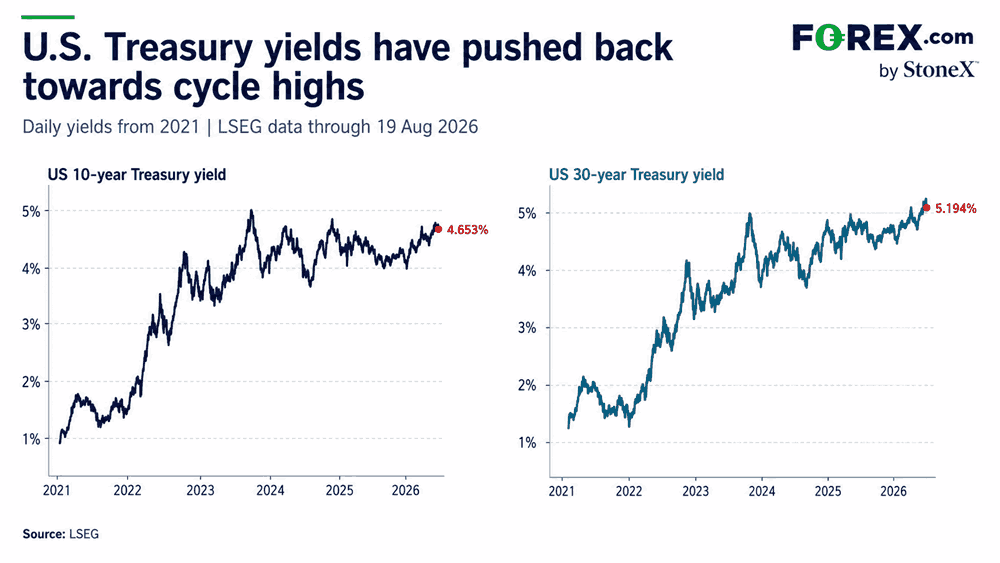
Source: LSEG, FOREX.com
While the move comes across as akin to taking an aspirin to treat an incurable disease given the size of the US debt pool, the signal it sends is far more important.
Scott Bessent and the Treasury are showing the market they are willing to be interventionist to prevent long-term borrowing costs from backing up further, especially when that threatens to spill into key cyclical areas of the economy such as the mortgage market.
Perhaps explaining the timing, the announcement arrived on the same day Treasury data showed US public debt had crossed the $40 trillion mark for the first time, underscoring unease among investors over the fiscal outlook.
And this is where the aspirin analogy matters. Larger buybacks may provide some temporary support for liquidity and long-dated bond prices, but they do nothing to alter the deficits, debt issuance or underlying fiscal trajectory driving pressure on borrowing costs in the first place.
Bessent shows his hand
Of course, this is not Scott Bessent’s first rodeo when it comes to interventionist policy when markets move in a direction he does not like.
Late last month, the US joined Japan in an unusual intervention episode to support the yen, with the Treasury buying yen by selling euros rather than dollars. That avoided adding pressure on Japan to sell Treasuries to fund its side of the intervention, an important detail given what has since unfolded at the long end of the US bond market.
Taken together, the two episodes are starting to show the market where Treasury’s priorities lie: the bond market.
As I’ve pointed out on multiple occasions over the years when discussing the Japanese yen, when policymakers attempt to coerce markets and intervene against prevailing market forces in one area, the pressure does not simply disappear. It often shifts somewhere else.
This content was created by an affiliate of FOREX.com and represents the views and opinions of the author/speakers, not the views and opinions of FOREX.com, StoneX Group Inc., or its subsidiaries. The content has not been independently reviewed by FOREX.com.
Pressure shifts to USD
The US dollar was understandably hammered on the back of the news, with the signalling from Treasury indicative that it does not want longer-dated yields to be determined entirely by market forces.
If Treasury continues down this path and interventionist policy, it raises a much bigger question about whether the highs for the greenback are already in, not just for this year, but potentially for the cycle.
For now, the increase in buybacks is only slated to remain in place until the next Quarterly Refunding announcement.
But if yields remain under pressure further out the curve, as the underlying fiscal fundamentals would suggest, there is every chance the larger buybacks stay in place, are increased again, or Treasury looks to reduce issuance of longer-dated coupon-bearing securities while shifting more borrowing towards the front end.
Beyond long-dated yields, it raises another key question. The more borrowing Treasury pushes towards the front end of the curve, the greater the sensitivity of government interest expense to policy rates, potentially complicating the Fed’s ability to increase rates without materially increasing Treasury’s interest burden.
Short squeeze may have fuelled bond bid
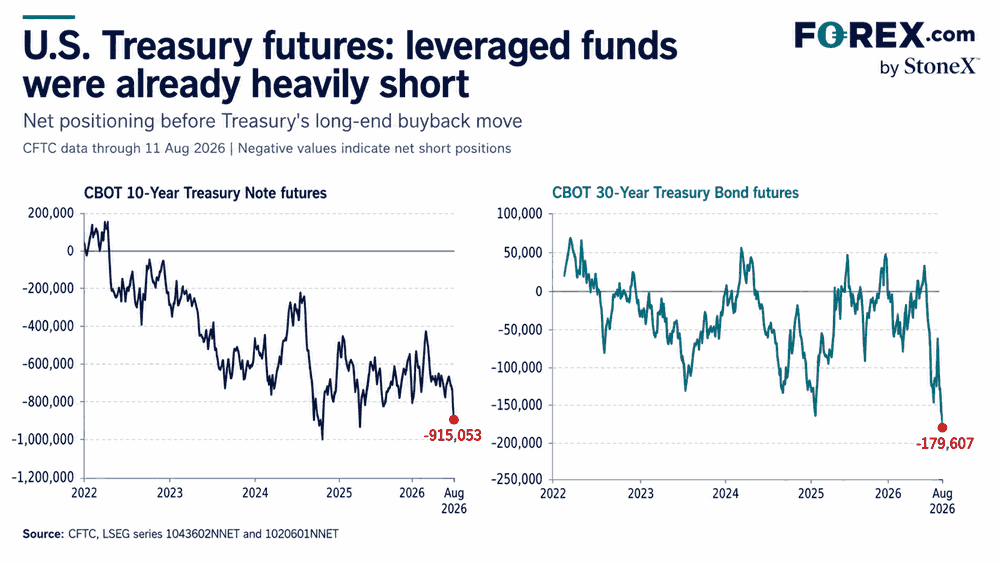
While I’m heavily speculating on how far Treasury may be willing to go, what we do know is that speculative positioning was heavily short in both 10-year and 30-year Treasury futures heading into the announcement.
That helps explain why the market reaction was so abrupt on Wednesday, completely overwhelming the influence of hawkish minutes from the July FOMC meeting and yet another soft 20-year Treasury auction.
Source: LSEG, FOREX.com
Leveraged funds were net short roughly 915,000 10-year Treasury futures contracts and around 180,000 30-year bond futures contracts in the latest CFTC report, leaving plenty of fuel for a sharp bout of short covering.
The question now is whether the announcement will have more than a fleeting impact once that short covering has run its course.
As seen so often with intervention in other markets, unless it is accompanied by a shift in the underlying fundamentals, it can amount to little more than putting a Band-Aid on a bullet wound when it comes to altering the prevailing trend.
Debasement trade 2.0?
Beyond whether larger buybacks prove successful in tempering the backup in longer-dated yields, you can’t help but ponder whether it may reignite the debasement trade narrative that was in full swing late last year and earlier this year.
That is not my baseline view at this stage. But ultimately, what matters is not what I think, but how the broader market interprets the signal being sent.
In the wake of the unusual yen intervention late last month and now Treasury’s decision to increase buybacks further out the curve, you can understand why investors may be starting to get twitchy again.
If policymakers are signalling they are not prepared to let market forces play out freely in the Treasury market, you cannot have your cake and eat it too and assume the dollar remains immune. Some of that adjustment may instead be forced through the currency, creating a potentially powerful tailwind for gold and silver.
Gold surge recovers 200DMA
Source: TradingView
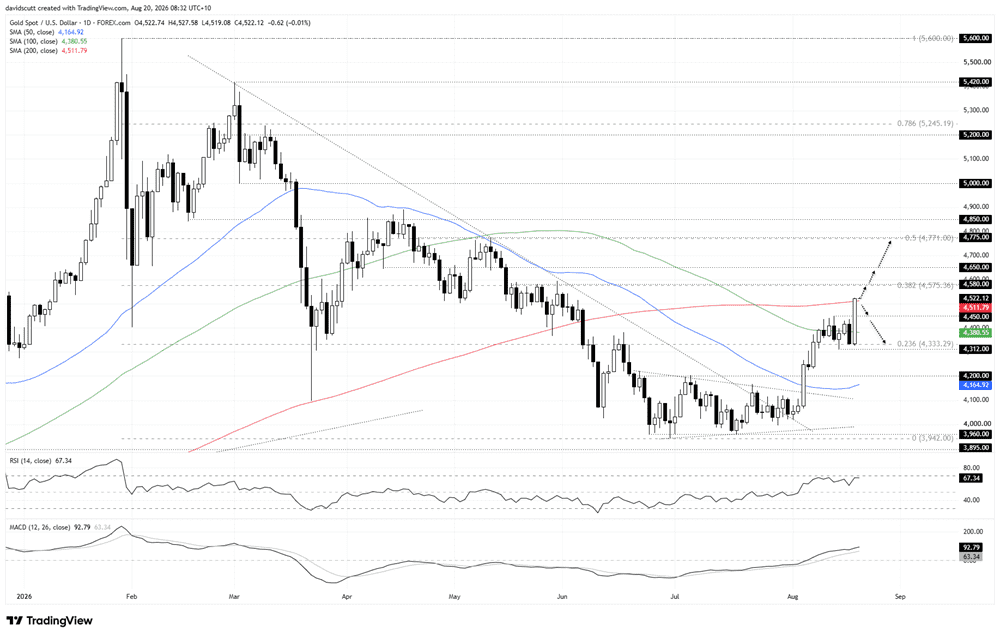
On the back of the announcement, gold printed a huge bullish engulfing candle on the daily, taking out the range high around $4,450 an ounce before reclaiming the important 200-day moving average.
That is now the key level to watch underneath where the price trades. If gold retests the 200-day and bounces, it would signal bulls are willing to step back in even on relatively shallow dips, putting a potential retest of the 38.2% Fibonacci retracement of the January to June bear move at $4,575 in focus. That level capped the gold price for lengthy periods earlier this year and looms as the first real test overhead.
Beyond that, $4,650 and the 50% retracement of the January to June bear move at $4,771 are the next topside targets should the move extend.
Of course, if gold fails to hold the 200-day moving average and slips back beneath it, which is a risk given the speed of the move, it would open the door to a potential short setup.
Such a scenario would allow shorts to be considered beneath the 200-day with a tight stop above for protection, initially targeting the former range high around $4,450, followed by the 23.6% Fibonacci retracement at $4,333, effectively near the bottom of the recent range.
For what it is worth, the oscillators remain bullish. RSI (14) sits just shy of overbought territory around 67 but is yet to set a fresh high, while MACD continues to diverge from its signal line in positive territory and trend higher.
That favours buying dips over selling rips, although given the circumstances, I would still place more emphasis on the price action itself.
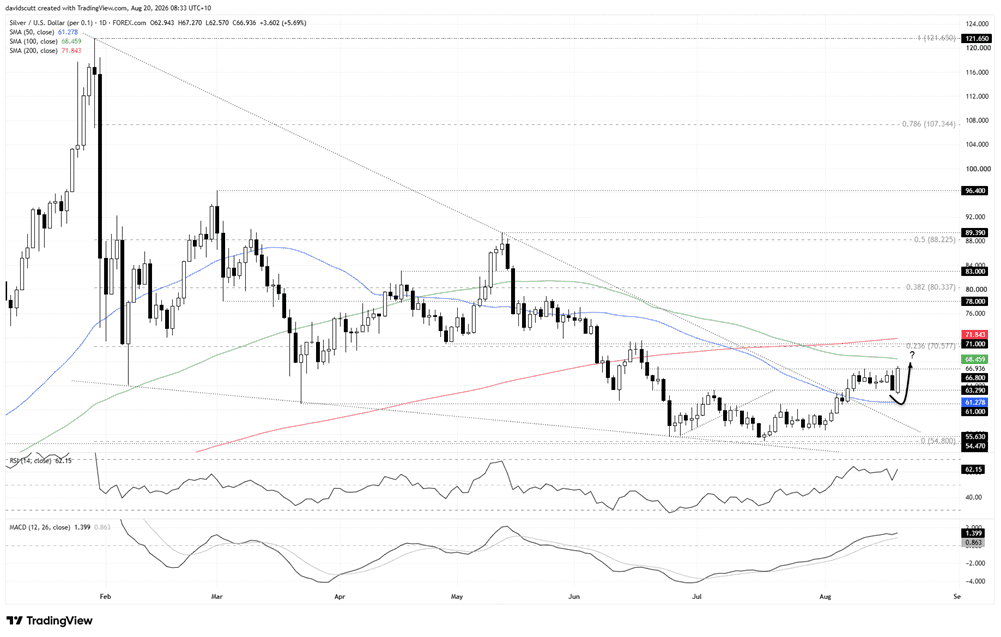
Silver prints bullish key reversal
Source: TradingView
While the move in silver does not look as spectacular on the chart, the bullish key reversal candle on the daily, which saw the price clear former range resistance at $66.80, suggests upside risk may be starting to build.
If silver can hold above $66.80, it would allow for longs to be considered with a tight stop beneath the level for protection, initially targeting the 100-day moving average. Beyond that sits an important resistance zone comprising the 23.6% Fibonacci retracement of the January to July bear move, horizontal resistance around $71 and the 200-day moving average at $71.84.
That looms as an important barrier overhead. If the price can clear it, it would materially strengthen the case for a more extensive bullish trend.
On the downside, a move back beneath $66.80 would bring the bottom of the prior sideways range at $63.29 into focus, followed by the confluence of the 50-day moving average and support around $61.
The message from the oscillators remains bullish. RSI (14) has perked up and moved further away from the neutral 50 level to around 62, while MACD is beginning to diverge from its signal line in positive territory.
Overall, the technical message still favours buying dips over selling rips.







Web Trader platform
Our sophisticated web-based platform is packed with features.
Open an account today
Experience award-winning platforms with fast and secure execution.
Economic calendar
Related articles

Canadian Dollar Forecast: USD/CAD Weekly Reversal Puts Yearly Uptrend Back in Focus 8 29 2026
USD/CAD has staged its strongest weekly advance since June, shifting the focus to whether a more durable low is finally taking shape.


USD/JPY weekly outlook: Payrolls may challenge the Fed’s hawkish reset
USD/JPY has finally woken from its slumber. Payrolls now loom as the key test of whether the latest hawkish repricing sticks or sinks.

Euro Short-term Outlook: EUR/USD Pullback Nears Pivotal Uptrend Support 8 28 2026
Warsh's comments accelerated the EUR/USD selloff, raising the stakes as buyers look to stabilize the broader recovery.