


Gold Suffers Fifth Worst-Day Drop on Record As Momentum Trade Unwinds
Gold plunged 5.7% in its fifth-worst session since 1970 as the momentum-fuelled rally snapped, leaving traders watching $4,000 for support.
Written by
Matt Simpson
Market Analyst
For some time now, I’ve been saying that gold had effectively become a pure momentum trade — one where the yellow metal was denied any meaningful pullback as traders chased prices higher. It always ends with a thud, and that’s exactly what we saw on Tuesday, with spot prices plunging 5.7%.
Not only was it a particularly volatile session, but it also ranked as gold’s fifth most bearish trading day on record, dating back to 1970. The drop was only slightly behind the 5.8% sell-offs seen in March 2008 and September 2011.
View related analysis:
- Gold Volatility Perks Up At $4k, Though Pullbacks Could Be Limiteda>
- Nikkei Hits 50k, Nasdaq Bulls Eye Record High Amid Thawing Trade Tensions
- ASX 200 Morning Market Outlook: ASX Hits Record High, Materials Lead
- Canadian Dollar Price Action Setups Into CPI: USD/CAD, GBP/CAD, EUR/CAD
- Japanese Yen Price Action Setups: USD/JPY, EUR/JPY, AUD/JPY
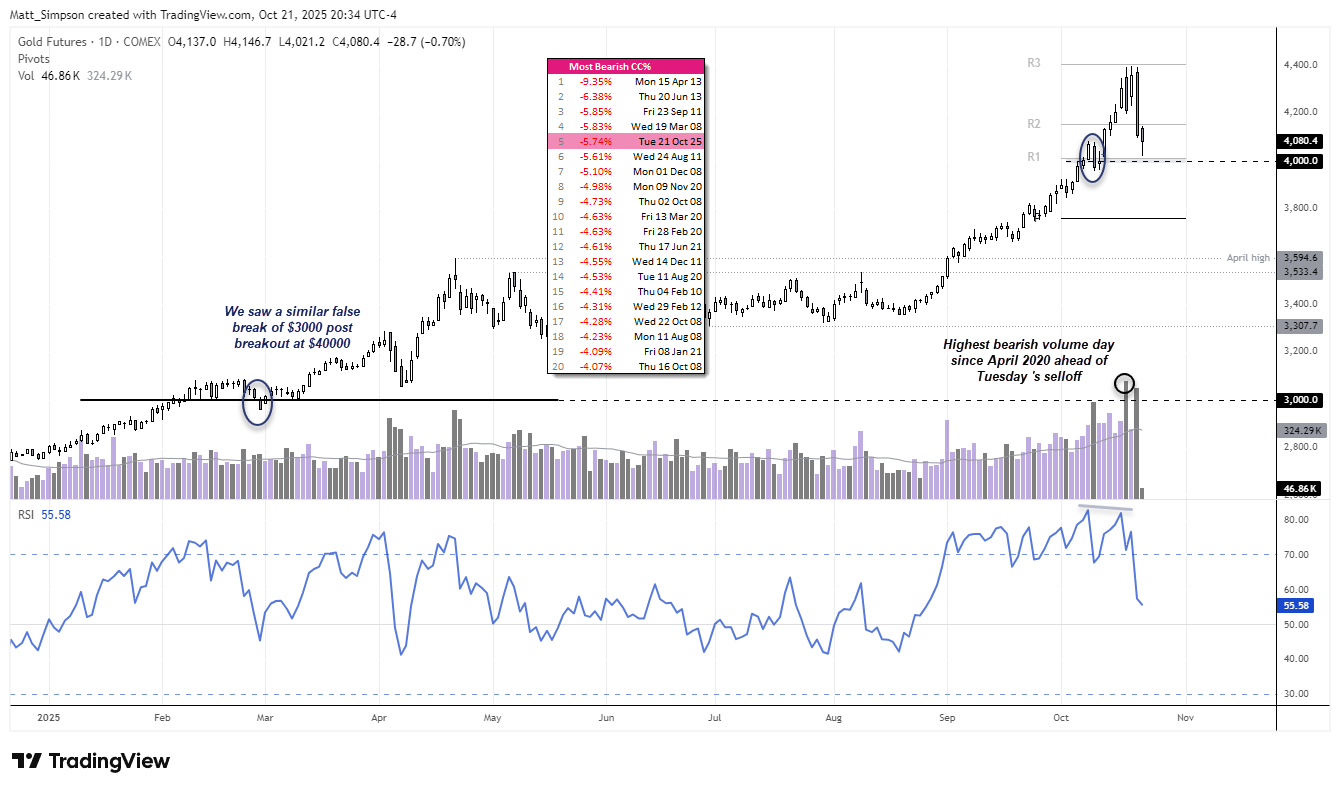
Chart analysis by Matt Simpson, Source: TradingView, COMEX Futures, Gold, LSEG
Hindsight is a wonderful thing, but the sell-off did not come without warning. Daily volatility had been rising alongside prices for more than a week, while a bearish divergence had formed against extremely overbought RSI(14) levels. More importantly, Friday’s bearish engulfing candle was accompanied by the highest daily volume since August 2020. This suggested that bearish initiation was far greater than expected given the day’s range — and that sellers held their ground at least through to yesterday. Tuesday’s trading volume was also gold’s second-highest daily print in over five years.

Gold Futures (GC) Technical Analysis
The 1-hour chart shows clear bearish follow-through from Tuesday’s sell-off, followed by a swift rebound at the monthly pivot just above the $4,000 level. Given the significance of this area for gold, an immediate break lower appears unlikely.
The RSI(14) also formed a bullish divergence and is now curling higher from oversold territory. This rebound, coupled with renewed two-way volatility, could see prices retest resistance near the weekly R2 pivot around $4,150. However, with the weekly pivot and Friday’s swing low near $4,200, bears may look to reload and attempt another push towards $4,000 in the near term.
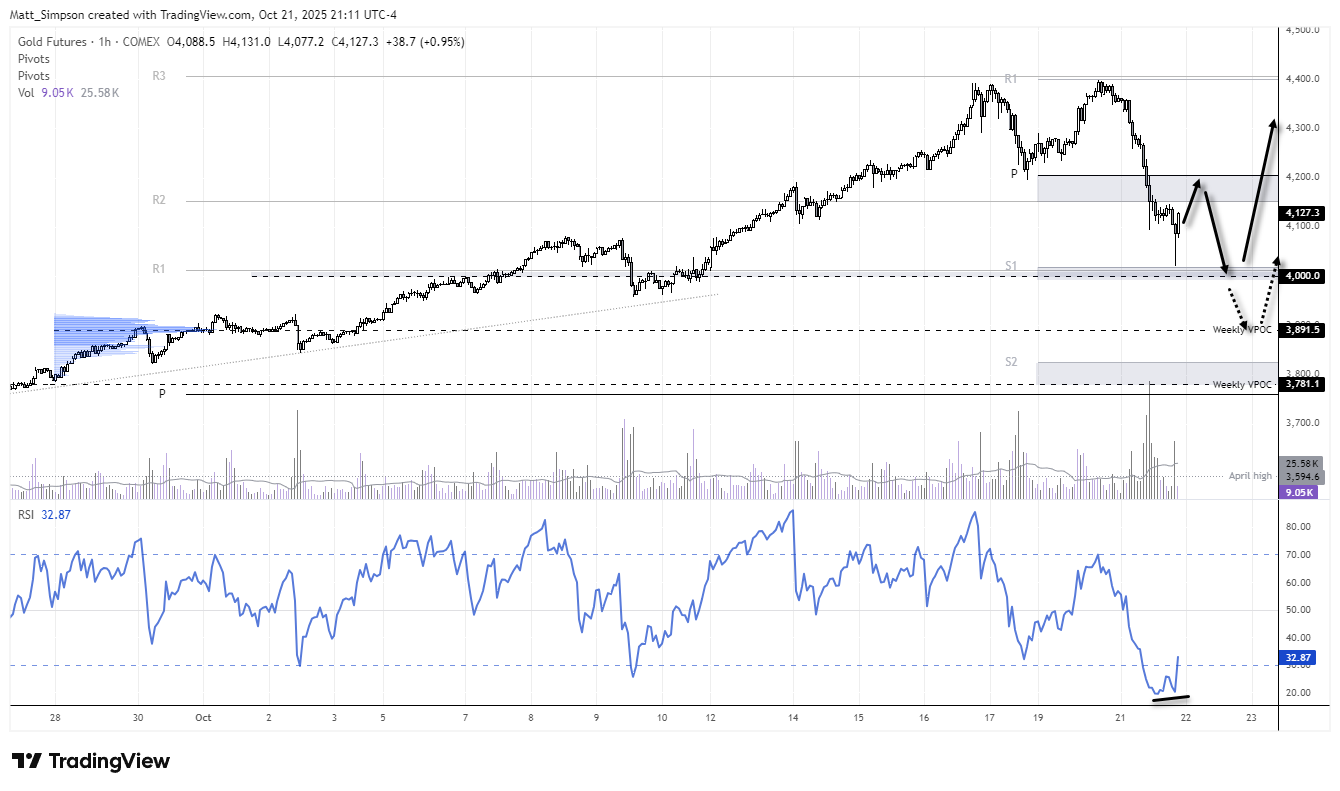
Chart analysis by Matt Simpson - Source: COMEX, LSEG
View the full economic calendar
-- Written by Matt Simpson
Follow Matt on Twitter @cLeverEdge
How to trade with City Index
You can trade with City Index by following these four easy steps:
- Open an account, or log in if you’re already a customer
• Open an account in the UK
• Open an account in Australia
• Open an account in Singapore
- Search for the market you want to trade in our award-winning platform
- Choose your position and size, and your stop and limit levels
- Place the trade
Related tags:







Web Trader platform
Our sophisticated web-based platform is packed with features.
Open an account today
Experience award-winning platforms with fast and secure execution.
Economic calendar
Related articles

Euro Short-term Outlook: EUR/USD Pullback Nears Pivotal Uptrend Support 8 28 2026
Warsh's comments accelerated the EUR/USD selloff, raising the stakes as buyers look to stabilize the broader recovery.


Gold and S&P 500 analysis: What now after Warsh’s hawkish speech?
The dollar surged across the board after the Fed Chair Kevin Warsh surprised with a hawkish-leaning speech at the Jackson Hole summit. All the bearish dollar bets that had been accumulated since last Friday on the back of data weakness and bond market troubles had to be squared and that triggered a short squeeze rally for the dollar. Gold and silver dropped, as a result, as too did bitcoin, while US indices were giving back earlier gains.


EUR/USD forecast: All eyes on Warsh at Jackson Hole - Forex Friday
For much of this week, the EUR/USD has been edging lower with the US dollar regaining some ground after last week’s sell-off that was triggered, in part, by the bond market worries. Investors have been unwilling to bet further against the US dollar so far this week ahead of Kevin Warsh’s keynote speech at the Jackson Hole summit, due later today.