


How to Read the COT Report to Track Forex Market Sentiment
Learn how to use the COT report to track forex market sentiment, analyse institutional positioning and identify crowded trades using custom dashboards.
Written by
Matt Simpson
Market Analyst
The Commitment of Traders (COT) report is one of the few tools retail traders can use to track institutional positioning. It shows how large speculators and asset managers are exposed across major currency futures markets— providing insight into broader market sentiment.
This guide cuts through the noise and explains how to read the COT report—and more importantly, how to actually use it in forex trading.
What Is the COT Report?
The COT report is published weekly by the US Commodity Futures Trading Commission (CFTC), with data available on their official CFTC Commitment of Traders page.
It breaks down positioning in futures markets, covering G10 currencies such as EUR, GBP, JPY and AUD. It also includes the US dollar index, the Chinese yuan, and select emerging market currencies such as the Brazilian real (BRL) and Mexican peso (MXN).
The CFTC releases the data in table format or as a downloadable CSV file for historical analysis. I build my own dashboards to analyse this data each week, which I explain in more detail below.
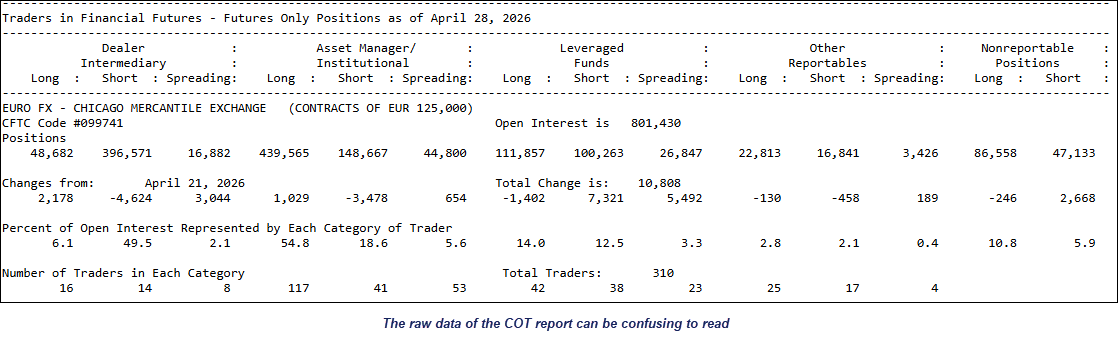
Source: CFTC (COT)
How to Read COT Positioning Data
Raw numbers don’t mean much on their own. What matters is context.
While the report groups traders by category—such as commercial hedgers, large traders and small traders—I focus on two core groups. These participants often drive trends, particularly when positioning becomes crowded or stretched.
- Large speculators (hedge funds, CTAs)
- Asset managers (institutional investors)
At its core, the COT report shows who is long, who is short, how positioning changes over time, and whether open interest is rising or falling. Combined, this helps traders and analysts assess whether a trend is likely to emerge, continue, or reverse.
It is also important to remember that the COT report is not real-time data. The report is released each Friday but reflects positioning from the preceding Tuesday, meaning it is already several days old by the time traders receive it.
That is why COT data works best as a broader sentiment and positioning tool rather than a precise trade signal. It helps traders understand where money is positioned and whether sentiment may be becoming crowded or stretched.
I publish weekly COT positioning analysis covering major FX futures markets, where I apply these concepts to live forex market conditions.

Net Positioning and Open Interest Explained
Net positioning measures the difference between long and short futures contracts (longs minus shorts). It provides a simple read on market bias and can make headlines when a market such as EUR/USD or GBP/USD ‘flips’ from net-long to net-short. Extreme levels of positioning can also signal overbought or oversold conditions.
Open interest—a proxy for volume in the futures market—can also be analysed to assess the strength of a move. Rising prices alongside increasing open interest can suggest strength behind the trend, while rising prices with falling open interest may point to a weakening rally.
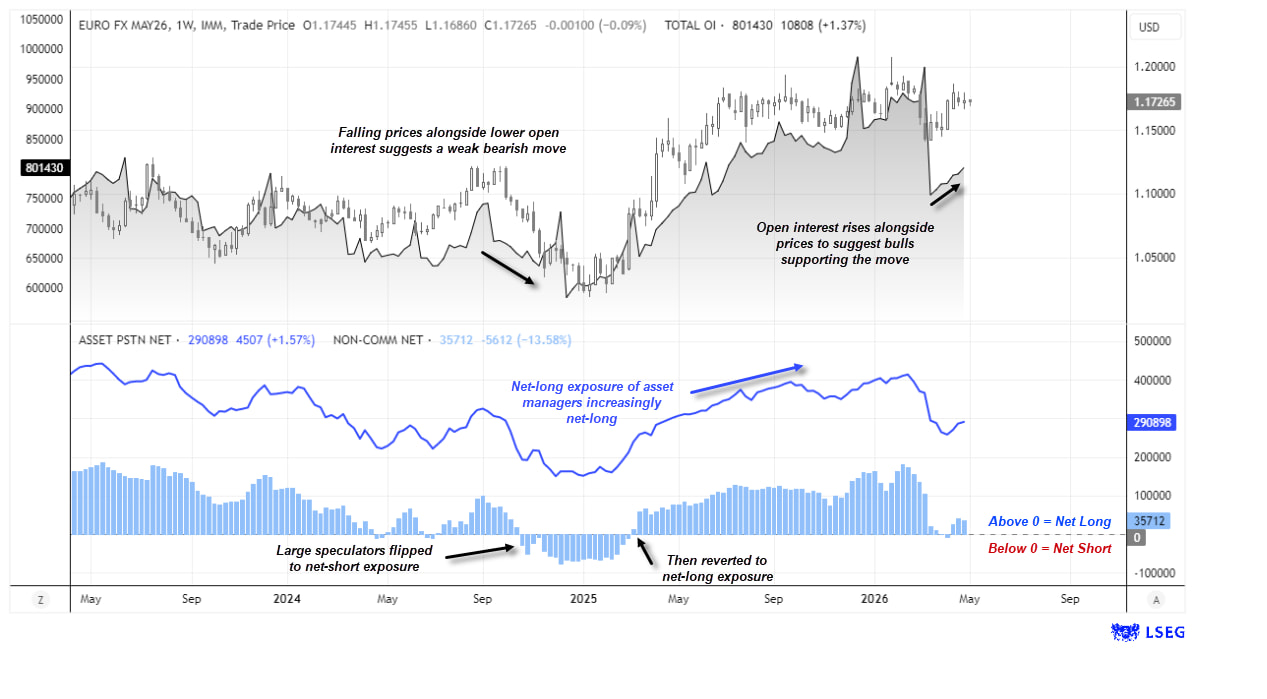
Source: CFTC (COT), LSEG
Net and Gross Exposure: Using COT Data to Track Market Sentiment
Positioning trends can provide insight into market sentiment, trend strength and potential reversal risks. Tracking how net exposure, gross longs and gross shorts evolve over time can help traders identify whether sentiment is strengthening, weakening, or approaching extremes.
Net-long Exposure
- Above zero, a bullish bias is assumed
- Long contracts outnumber short contracts
- Rising net-long exposure signals increasing bullish sentiment
- If it reaches extreme levels relative to history, it may indicate a crowded long trade
Net-short Exposure
- Below zero, a bearish bias is assumed
- Short contracts outnumber long contracts
- Increasingly negative net exposure signals growing bearish sentiment
- If positioning becomes extreme, it may point to an oversold market or a crowded short
Gross Long and Short Exposure
- A healthy uptrend is typically accompanied by rising longs and falling short exposure
- Divergences can help anticipate potential reversals, such as prices rising while net-long or gross-long exposure declines
- Rising short exposure during a rally can also warn of weakening sentiment or a potential reversal
- Historical peaks and troughs in net or gross exposure can help identify potential sentiment extremes
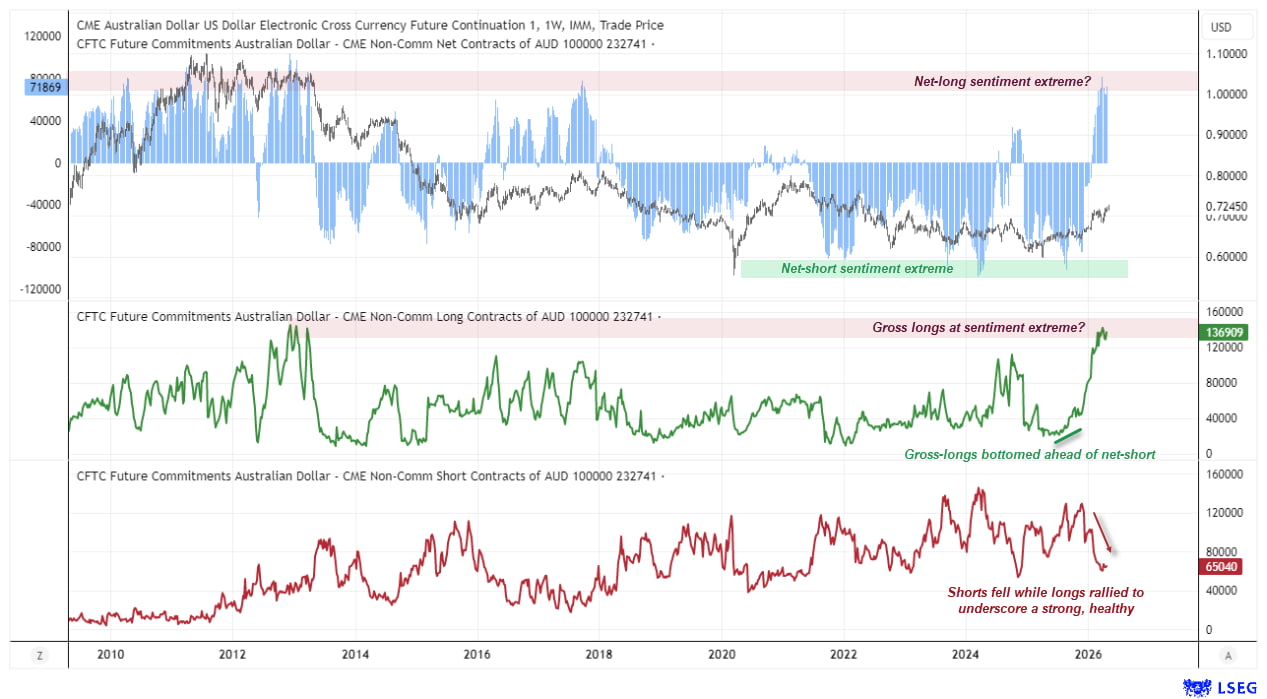
Source: CFTC (COT), LSEG
Using COT Dashboards to Analyse Forex Sentiment
Raw COT data can be messy and difficult to interpret in isolation. Without context, it’s easy to draw the wrong conclusions.
That is why I created my COT dashboard to standardise the data, allowing me to quickly visualise and compare trends, net exposure and positioning extremes across FX futures markets.
The dashboard below compares large speculator positioning across major FX futures markets using net exposure relative to open interest. It also tracks where current positioning sits relative to historical highs and lows, helping identify whether sentiment is becoming crowded or stretched.
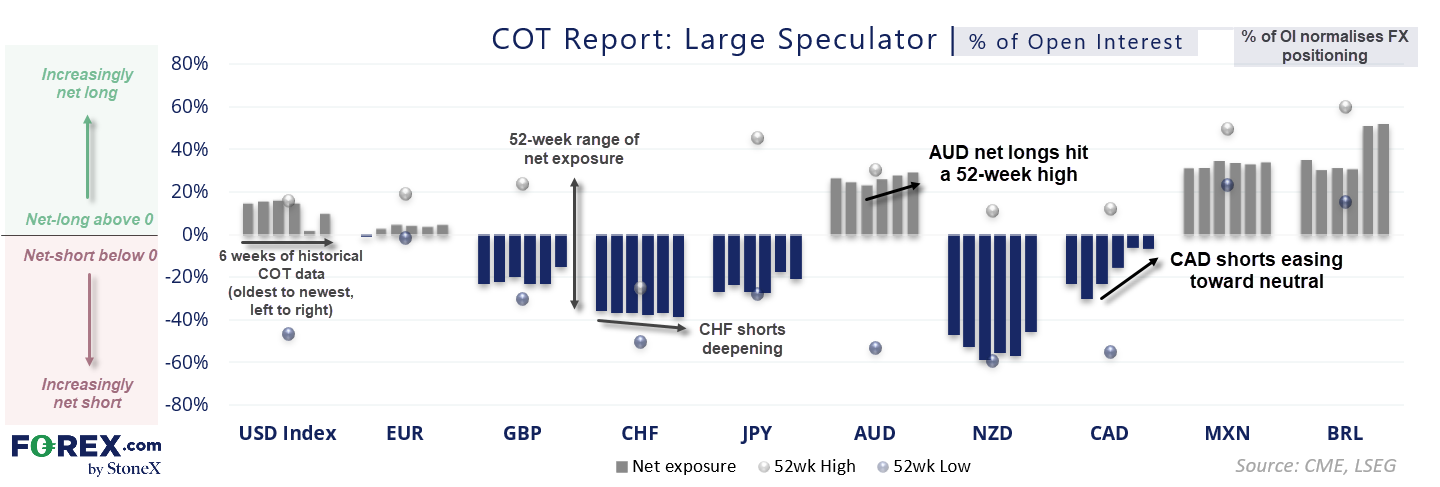
Source: CME, LSEG
Net Exposure and Open Interest in COT Analysis
One of the key metrics I use is net exposure as a percentage of open interest, calculated as:
Net as % of open interest = (Long as % of OI – Short as % of OI)
I primarily use this approach to normalise positioning across currencies with vastly different market sizes. For example, NZD futures trade far lower volumes than euro futures, so comparing raw net positioning data directly can distort relative positioning trends.
Using net exposure as a percentage of open interest also provides several additional advantages:
- It standardises positioning across markets with different liquidity profiles
- It makes sentiment extremes easier to identify visually
- It highlights whether positioning is becoming crowded relative to market size
- It improves cross-market comparisons between currencies
- It reduces distortions caused by structurally large futures markets such as Euro FX
The dashboard also helps visualise how sentiment evolves over time. The six bars for each currency represent six weeks of historical COT data, allowing trends to be tracked from left to right. Markets above zero are considered net-long, while markets below zero are net-short.
The 52-week high and low markers help frame whether positioning is approaching historical sentiment extremes. This makes it easier to identify crowded trades, weakening trends, or currencies where positioning may be vulnerable to reversal.

Percentile Rank and Historical Positioning Extremes
Raw positioning data only tells part of the story. A market can still appear heavily net-long or net-short without necessarily being at an extreme relative to its own history.
To help frame positioning in context, I also compare current net exposure against its historical range over three different time horizons:
- 3 years
- 1 year
- 3 months
The dashboard below converts positioning into percentile rank, showing where current sentiment sits relative to its historical range across each timeframe.
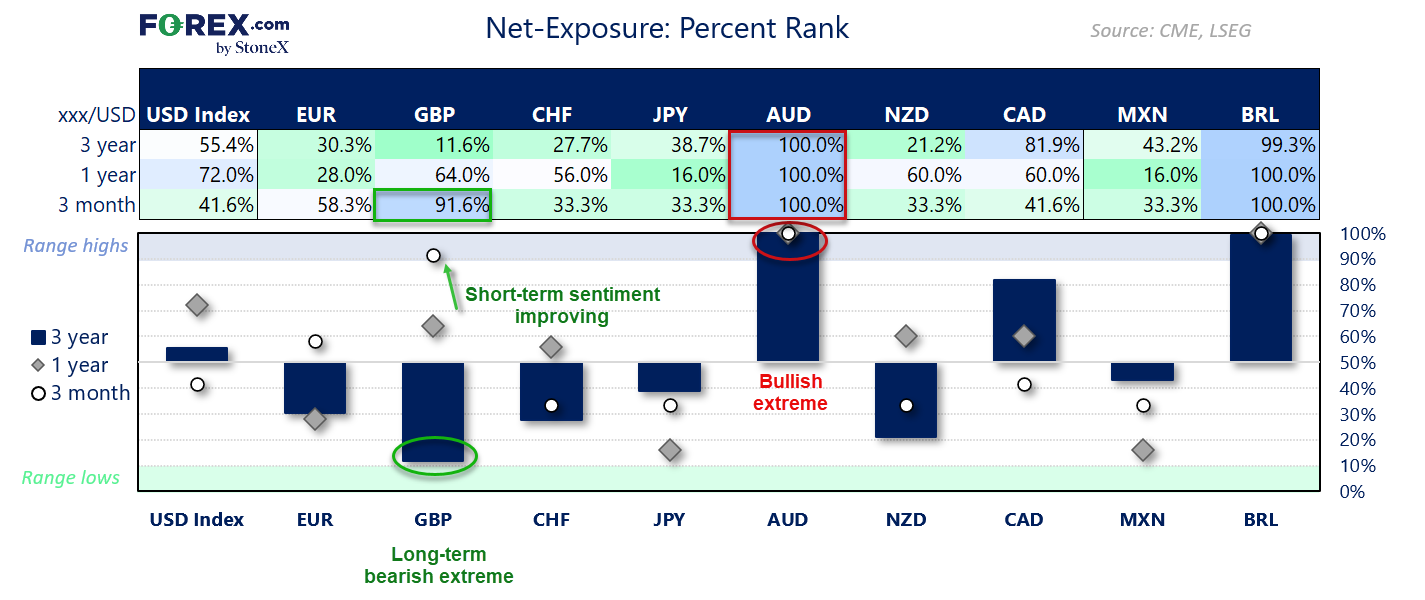
Source: CME, LSEG
A percentile rank near 100% suggests positioning is approaching the upper end of its historical range, while readings closer to 0% suggest sentiment may be approaching bearish extremes.
This approach helps identify:
- crowded long or short trades
- potential sentiment exhaustion
- improving or deteriorating positioning trends
- relative strength and weakness between FX markets
The shorter-term 3-month percentile rank can also help identify shifts in momentum before they become visible in longer-term positioning trends. For example, a market may still appear structurally bullish on a 3-year basis while weakening noticeably over the past three months.
Conversely, when percentile ranks align across all three timeframes, it can reinforce the strength and persistence of the broader positioning trend.
COT analysis is most effective when combined with technical analysis, macro themes and price action. Extreme positioning alone is not necessarily a reversal signal, but it can help traders identify when sentiment becomes crowded and markets may be vulnerable to a squeeze or trend reversal.
Final Thoughts on Using the COT Report in Forex Trading
The COT report offers a unique window into institutional positioning across the forex market. While the raw data can appear complex at first glance, using dashboards and percentile ranking can help transform it into a far more practical sentiment tool.
By tracking net exposure, open interest and historical positioning extremes, traders can better understand where sentiment is strengthening, weakening or becoming crowded across FX futures markets.
Rather than relying on positioning alone, the real value of COT analysis comes from combining it with broader market context to identify potential opportunities, sentiment shifts and developing trends.
Frequently Asked Questions About the COT Report
How do professional traders use the COT report?
Professional traders typically use the COT report as a sentiment indicator rather than a standalone trading signal. By combining institutional positioning with price action, technical analysis and macroeconomic themes, traders can identify crowded trades, assess trend strength and evaluate whether market sentiment is becoming stretched.
What is the COT report?
The Commitment of Traders (COT) report is published weekly by the US Commodity Futures Trading Commission (CFTC). It shows how different groups of traders—including large speculators, asset managers and commercial hedgers—are positioned across futures markets, making it one of the most widely used tools for analysing institutional market sentiment.
When is the COT report released?
The COT report is released every Friday by the CFTC. However, the data reflects trader positions held at the close of trading on the preceding Tuesday, meaning it is approximately three days old when published.
Is the COT report free?
Yes. The COT report is available free of charge from the CFTC website. Traders can view the latest report online or download historical data in CSV format for their own analysis.
Does the COT report cover the spot forex market?
No. The COT report tracks currency futures traded on the Chicago Mercantile Exchange (CME), not the decentralised spot forex market. However, because futures and spot exchange rates are closely linked, many forex traders use COT positioning as a proxy for broader institutional sentiment.
Which currencies are included in the COT report?
The COT report includes major currency futures such as the euro (EUR), British pound (GBP), Japanese yen (JPY), Australian dollar (AUD), Swiss franc (CHF), Canadian dollar (CAD), New Zealand dollar (NZD), Mexican peso (MXN), Brazilian real (BRL), offshore Chinese yuan (CNH), South African rand (ZAR), Swedish krona (SEK), Norwegian krone (NOK), and the US Dollar Index (DXY).
Can I use the COT report to analyse EUR/USD, GBP/USD or AUD/USD?
Yes. Although these are spot forex pairs rather than futures contracts, traders commonly use Euro FX, British pound and Australian dollar futures positioning to assess institutional sentiment. Comparing positioning with price action can help identify strengthening trends, crowded trades and potential reversal risks.
Which trader groups should I follow in the COT report?
Many traders focus on large speculators, such as hedge funds and commodity trading advisers (CTAs), together with asset managers. These groups often provide the clearest indication of speculative sentiment and longer-term investment flows, whereas commercial traders typically use futures to hedge business exposure.
Can the COT report predict market reversals?
Not on its own. Extreme positioning can indicate that sentiment has become crowded, increasing the risk of a reversal or short squeeze. However, positioning should always be analysed alongside price action, technical analysis and macroeconomic developments before making trading decisions.
Is the COT report useful for day trading?
Generally no. Because the report is published once a week and reflects Tuesday's positions, it is better suited to swing traders, position traders and macro analysts than short-term day traders. It is most effective for identifying broader market sentiment rather than precise trade entries.
What is open interest in the COT report?
Open interest is the total number of outstanding futures contracts that remain open. Rising open interest alongside rising prices often suggests new money is supporting the trend, while falling open interest may indicate weakening participation. Analysing open interest alongside net positioning provides additional insight into trend strength.
Why do you use net exposure as a percentage of open interest?
Normalising net positioning by open interest makes it easier to compare institutional sentiment across currency futures markets with very different trading volumes. It also helps identify positioning extremes, crowded trades and shifts in market sentiment on a like-for-like basis, regardless of the size of each futures market.
Stay Updated With Weekly COT Reports
I publish weekly COT reports covering institutional positioning across major forex markets, including the US dollar, EUR/USD, GBP/USD, AUD/USD, USD/JPY and emerging market currencies.
Explore more forex sentiment, COT analysis and trading education here:
-- Written by Matt Simpson
Follow Matt on Twitter @cLeverEdge
Related tags:







Web Trader platform
Our sophisticated web-based platform is packed with features.
Open an account today
Experience award-winning platforms with fast and secure execution.
Economic calendar
Related articles

Euro Short-term Outlook: EUR/USD Pullback Nears Pivotal Uptrend Support 8 28 2026
Warsh's comments accelerated the EUR/USD selloff, raising the stakes as buyers look to stabilize the broader recovery.


EUR/USD forecast: All eyes on Warsh at Jackson Hole - Forex Friday
For much of this week, the EUR/USD has been edging lower with the US dollar regaining some ground after last week’s sell-off that was triggered, in part, by the bond market worries. Investors have been unwilling to bet further against the US dollar so far this week ahead of Kevin Warsh’s keynote speech at the Jackson Hole summit, due later today.


AUD/CAD breakout puts the Bradman barrier in sight
A bullish breakout has pushed AUD/CAD to its highest level since early 2021. Whether it can clear 0.9994 may determine if the move extends well above parity.
