


How to trade Equity Indices using Foreign Exchange
When looking at the equity indices vs foreign exchange pairs, traders often point to the inverse correlation between the SPX 500 and the DXY
Written by
Global Author
Financial Analyst
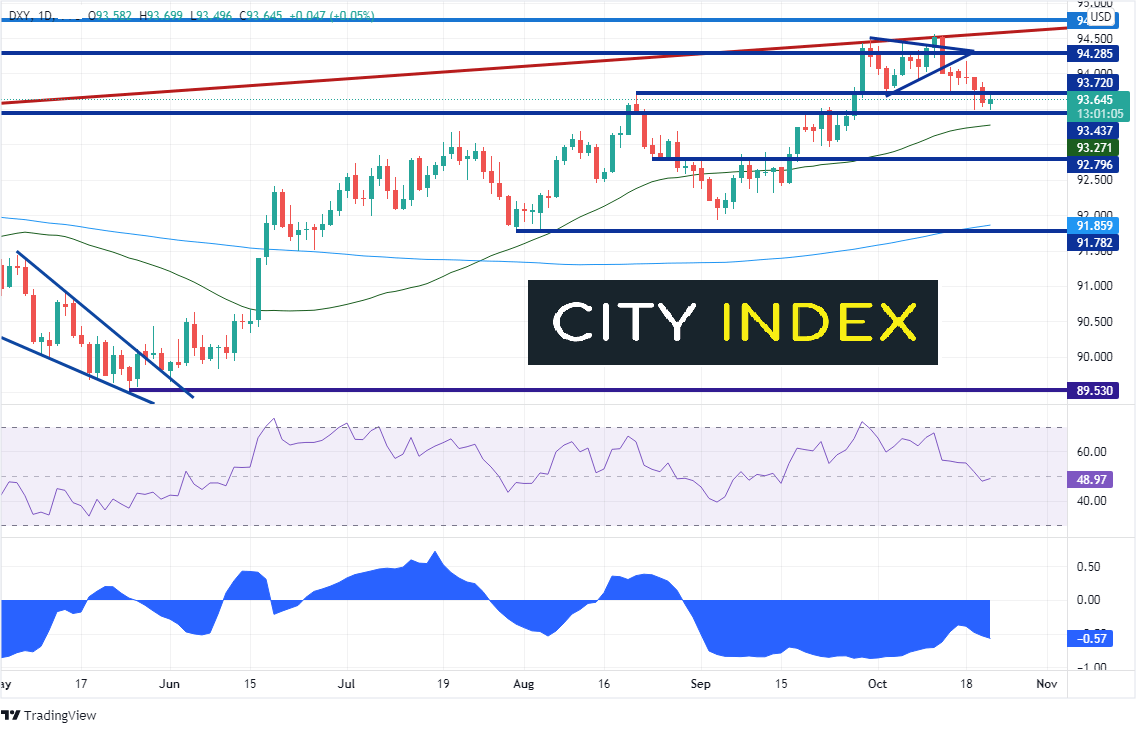
When looking at the Equity Indices vs foreign exchange pairs, traders often point to the inverse correlation between the SPX 500 and the DXY, that is, when one asset moves higher the other moves lower. However, that isn’t always the case. For example, the current daily correlation coefficient between DXY and SPX 500, shown on the bottom of the chart below, is -0.57. Although this is a negative correlation, it is not considered significant. Traders should look for correlation coefficients +0.80 or -0.80 for it to be significant.
Source: Tradingview, Stone X
What is the US Dollar Index (DXY)?
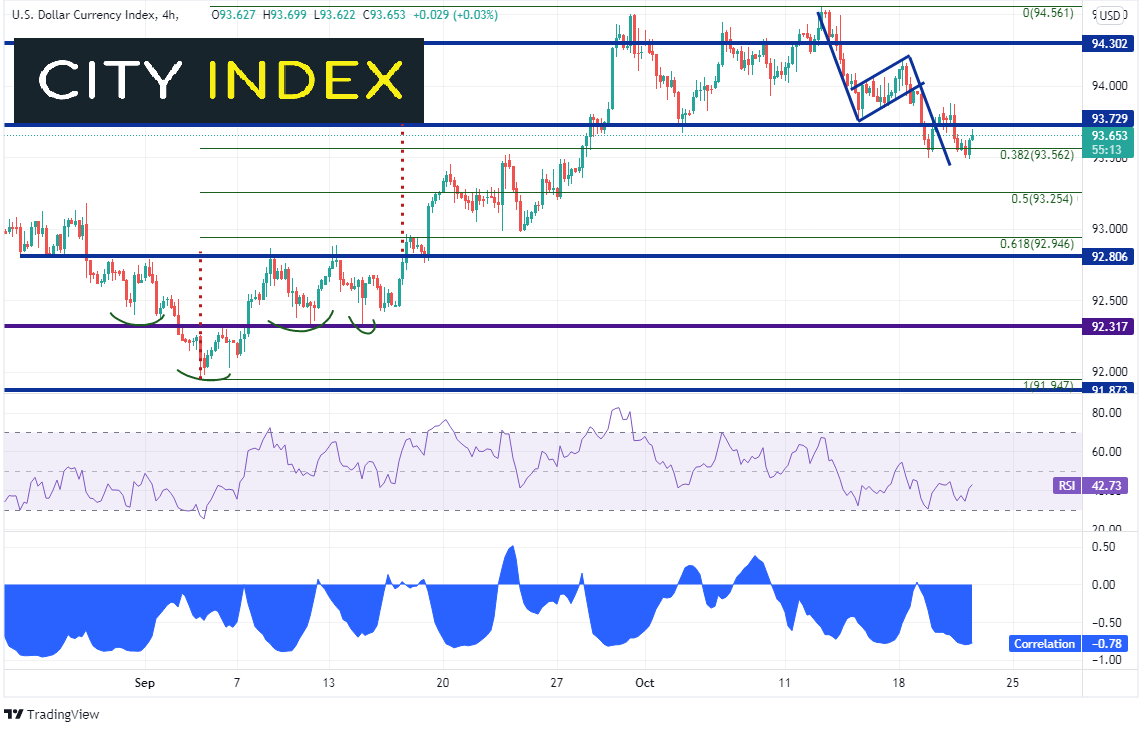
On 240-minute timeframe between DXY and the SPX 500, the correlation is -0.78, which is considered borderline. If traders decide to use this correlation on the shorter timeframe as part of their decision-making process, make sure there are plenty of other confirming indicators.
Source: Tradingview, Stone X
Other USD pairs and SPX 500
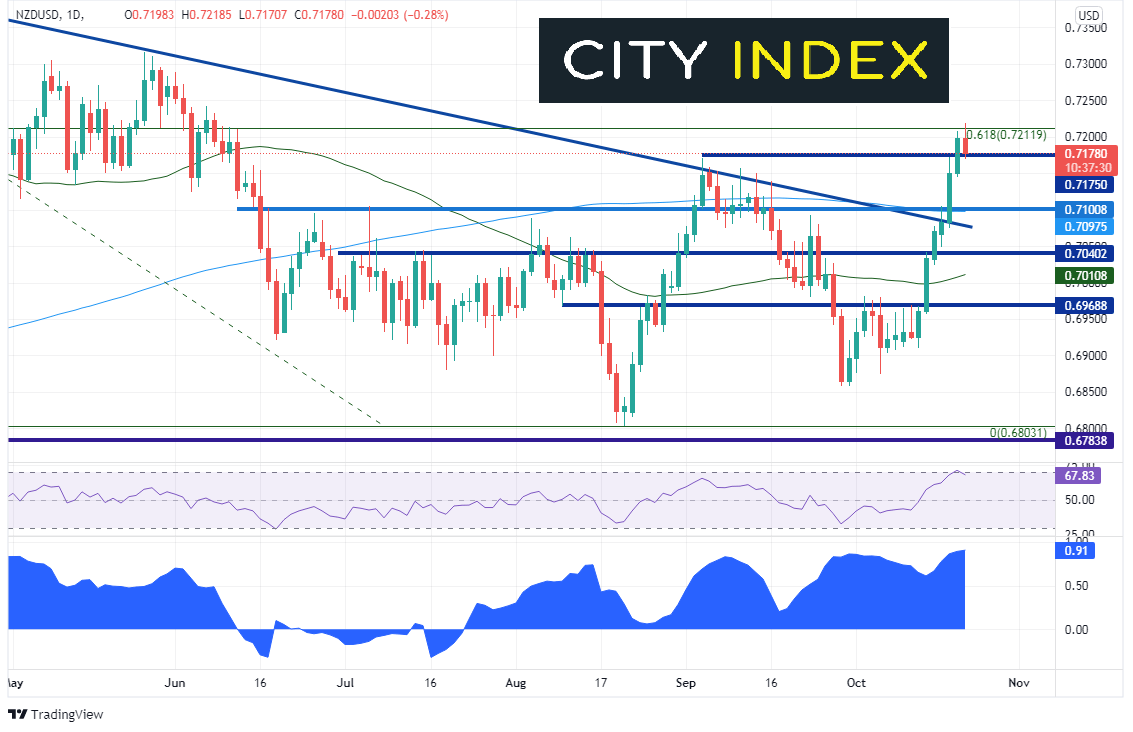
Although DXY may not be the best US Dollar instrument to use to determine correlation, there are plenty of US Dollar pairs to look at which currently are a good fit. For example, sticking with the SPX 500 as a popular broad market equity index, the daily correlation between SPX 500 and the NZD/USD is +0.91! Therefore, if one looks at the NZD/USD and believes the pair is ready move higher, there is a good chance that the SPX 500 will move higher with it. Notice however that NZD/USD is running into resistance at the 61.8% Fibonacci retracement from the highs of February 2020 to the lows of August 20th, near 0.7212. The pair may be ready to pause or pullback at this resistance level.
Source: Tradingview, Stone X
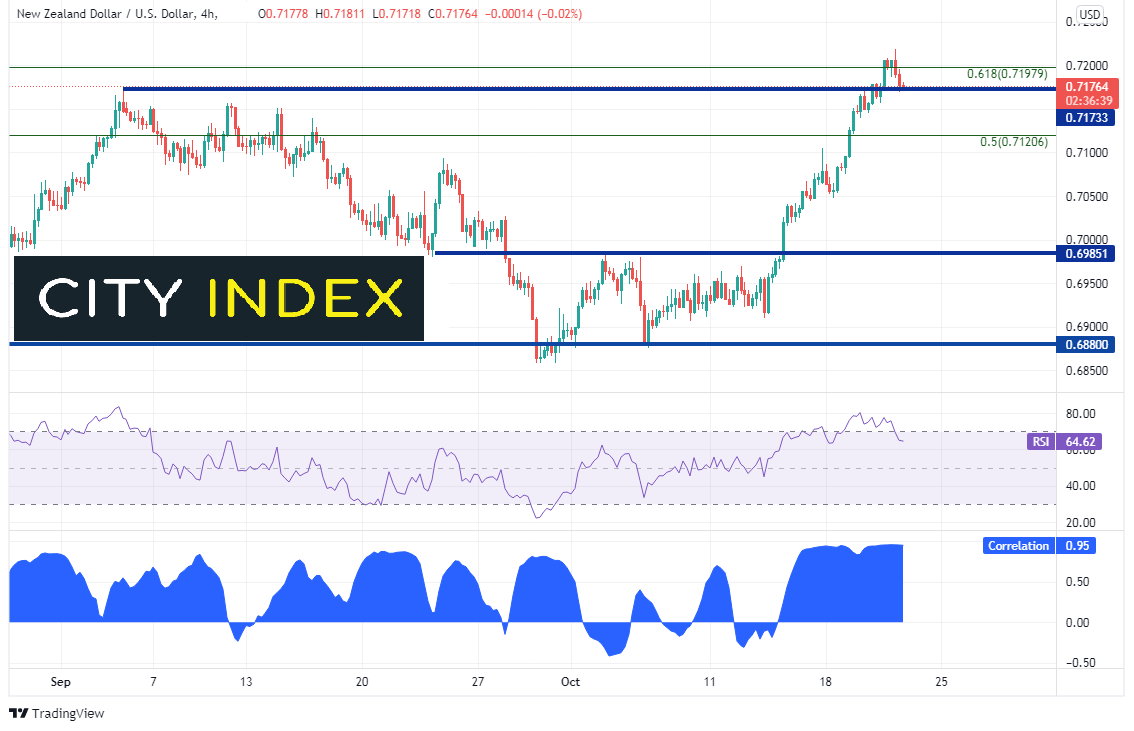
On a 240-minute timeframe the correlation is almost a perfect positive correlation at +0.95! Therefore, if NZD/USD pulls back soon, there is a good chance that the SPX 500 may pull back along with it in the shorter timeframe.
Source: Tradingview, Stone X
Trade NZD/USD now: Login or open a new account!
Non-USD currency pairs and SPX 500
Looking across the board of current correlation coefficients between the SPX 500 and fx pairs, there are some very strong correlations between the 2 assets on a 240-minute timeframe. These should be used for analysis on a medium-term basis. Some of the stronger readings are as follows:
- AUD/USD (+0.95)
- GBP/USD (+0.89)
- USD/CAD (+0.83)
- CAD/JPY (+0.81)
- AUD/CAD (+0.95)
- AUD/CHF (+0.88)
- AUD/JPY (+0.94)
- AUD/NZD (-0.83)
- EUR/AUD (-0.96)
- EUR/MXN(-0.81)
- EUR/NOK (-0.85)
- EUR/NZD(-0.97)
- GBP/AUD (-0.91)
- GBP/JPY(+0.83)
- GBP/NZD (-0.95)
- GBP/ZAR (-0.89)
- NZD/CAD (+0.95)
- NZD/JPY (+0.96)
- USD/MNX (-0.90)
- USD/NOK (-0.87)
- USD/SEK (-0.84)
- USD/ZAR (-0.94)
Not all indices are equal
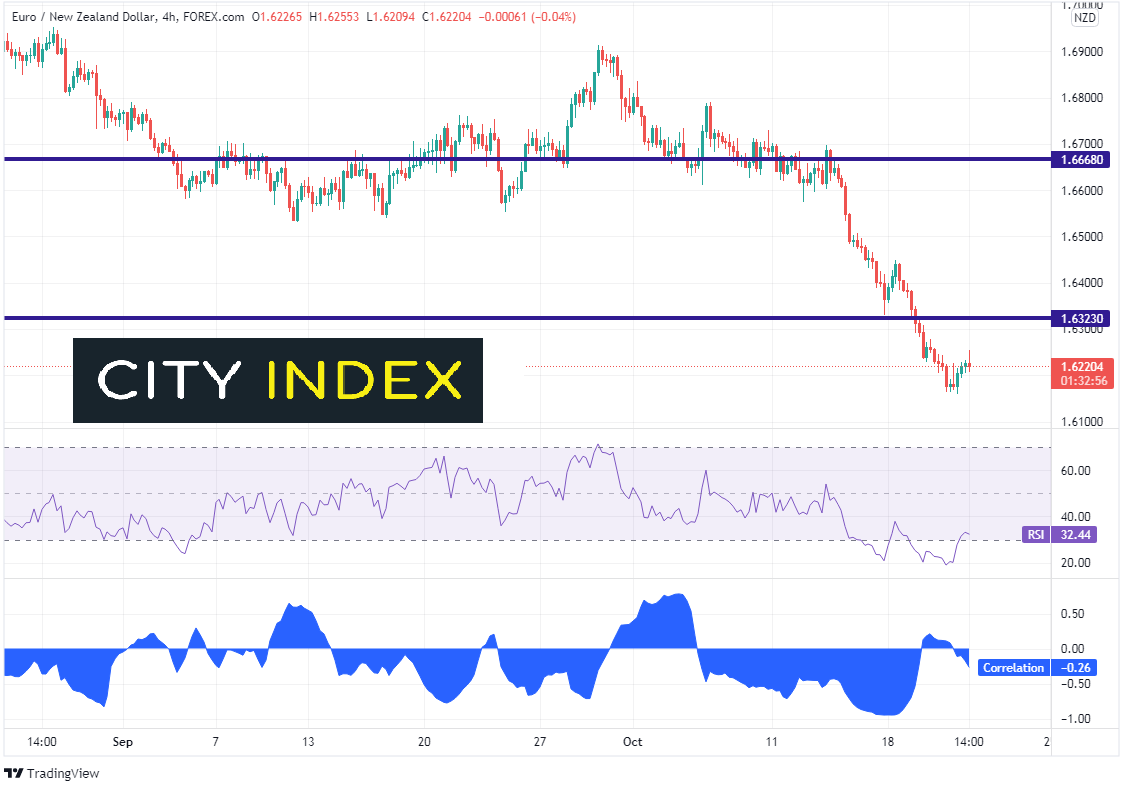
Not all equity indices are the same. For example, when checking the correlation between the FTSE 100 or the German Dax and the above currency pairs, only a few are within the strong correlation area. For example, the currency pair with the highest correlation to the S&P 500 on a 240-minute timeframe is EUR/NZD with a correlation coefficient of -0.97. However, went compared to the FTSE 100, the correlation is extremely weak, at -0.26. Although there is still an inverse correlation, a reading such as this should not be used as a signal to trade.
Source: Tradingview, Stone X
If fx traders would like to trade equity indices, but may not have access, the correlation coefficient can be a useful tool. If there is a strong reading between the equity index (such as the SPX 500) and a currency pair (above +0.80 or below -0.80), traders can use the fx pair as a substitute for the index. However, note that the signal is only for direction, not magnitude.
Learn more about forex trading opportunities.
Related tags:
Latest market news










Web Trader platform
Our sophisticated web-based platform is packed with features.
Open an account today
Experience award-winning platforms with fast and secure execution.
Economic calendar
Related articles

Gold and S&P 500 analysis: What now after Warsh’s hawkish speech?
The dollar surged across the board after the Fed Chair Kevin Warsh surprised with a hawkish-leaning speech at the Jackson Hole summit. All the bearish dollar bets that had been accumulated since last Friday on the back of data weakness and bond market troubles had to be squared and that triggered a short squeeze rally for the dollar. Gold and silver dropped, as a result, as too did bitcoin, while US indices were giving back earlier gains.


EUR/USD forecast: All eyes on Warsh at Jackson Hole - Forex Friday
For much of this week, the EUR/USD has been edging lower with the US dollar regaining some ground after last week’s sell-off that was triggered, in part, by the bond market worries. Investors have been unwilling to bet further against the US dollar so far this week ahead of Kevin Warsh’s keynote speech at the Jackson Hole summit, due later today.

S&P 500 Forecast: SPX after Nvidia revives confidence in the AI trade
U.S. stocks are heading higher on Thursday, with technology leading the move after Nvidia's stronger-than-expected outlook revived confidence in the AI trade.
