

Japanese Yen Technical Analysis: USD/JPY Nears 160 But is that the Line in the Sand?
USD/JPY fell dramatically two weeks ago as dual intervention drove a sell-off in the pair, but since then bulls have been clawing back and are nearing a re-test of a major psychological level.
Written by
James Stanley
Sr. Strategist
Japanese Yen Talking Points:
- It’s a cat and mouse game in USD/JPY as bulls are clawing back in the pair following the dual intervention two weeks ago.
- The pair had stalled just inside of 165 two weeks ago but bulls remained aggressive on pullbacks or at support, ultimately leading to the intervention order. But after the sell-off, is there a new line in the sand at 160, or is the BoJ going to react passively? Rumors of a BoJ rate hike in September have done little to deter buyers in the pair and inflation in Japan came in at 1.7%, so half of what just printed in the US at 3.4%. There’s not pressing demand for a rate hike right now other than to try to quell Yen weakness and markets seem to be sniffing that out already.
USD/JPY is up more than 400 pips from the lows of last week, and bulls are tip-toeing back into the pair. While there hasn’t been an emphatic breakout yet, there has been ardent defense of support and of recent that’s come in at higher-lows. This sets up for a dangerous backdrop, on both sides of the pair, as the carry remains positive for longs and the fundamental bias is still decisively-tilted against the Japanese Yen.
The 164/165 area is probably safe to assume as a hard line in the sand given that we’ve already seen an intervention at that price but perhaps the bigger question for now is whether the BoJ would respond to a test above 160.00 in USD/JPY. That’s the price that they defended back in April of 2024 and it was a level that got attention earlier in the year, leading into a ‘rate check’ from the US Treasury Department via the New York Federal Reserve.
Those normally happen from the Japanese side of the matter and the fact that the US Treasury Department and Treasury Secretary Scott Bessent were so interested in the matter is what makes our current situation so unique. Solo interventions have often failed, like the one in April of 2024. The BoJ buying yen and forcing a pullback into USD/JPY have, in essence, just created an opportunity for bulls to position-in at more favorable prices. But, historically, dual interventions have tended to show more success in stabilizing and even reversing exchange rates although there’s the very real question of funding from the US side as Scott Bessent’s approach two weeks ago came into question from Nick Timiraos of the Wall Street Journal, who Bessent later attacked and called him a ‘stenographer that relies on backroom gossip.’
Gossip and innuendo aside, like I said after the intervention long USD/JPY at 155.00 could make more sense as it seemed unlikely that we’d get an intervention there. And with the harboring expectation that the US will hike rates later this year there’s still rational for the carry trade, which means there’s still a need for hedges against JPY currency weakness.
For this week, the risk factor was US data and if that did show a cratering in inflation, then there could be rationale for longs to close, similar to episodes in November 2022 or 2023, or again in July of 2024. But that inflation remained well above target, even if below expectations for PPI and right at the expectation for CPI.
So, the question now is two-fold. The first is for how long might bulls be able to push? Traditionally this would be a gradual affair where buyers in the pair go for a little more and a little more until, eventually, they pose a breakout. It’s what happens after that matters as a failure from the BoJ to respond will lead to a stronger topside move as markets try to sniff out weakness. And secondly, if bulls do get beyond 160.00, are Bank of Japan officials standing by to try to swat down the move, similar to April of 2024?
At this point, a short-term ascending triangle can be argued in USD/JPY, which is a bullish breakout formation defined by horizontal resistance and a series of higher-lows. That high is showing below the 160.00 handle so as we go into late-week trade, we may see a push from bulls to get closer to that test of the big figure, and perhaps even a test beyond that, with the very real question as to whether policymakers from either economy will show more aggression this time.
USD/JPY Four-Hour Price Chart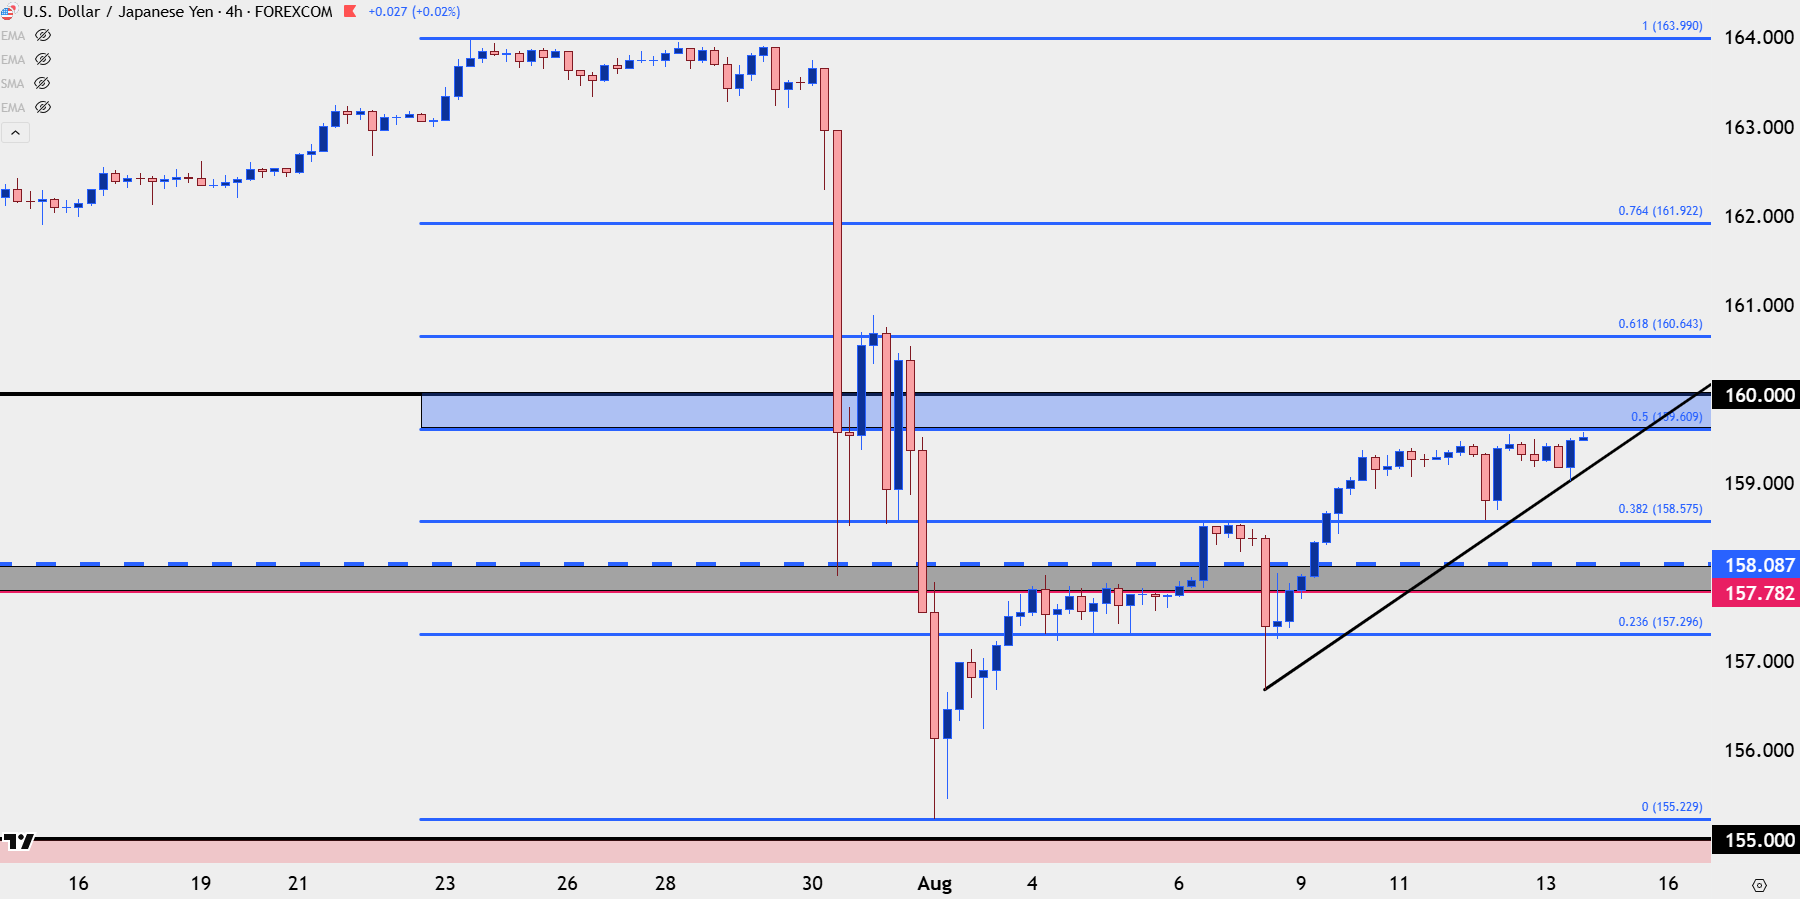
Chart prepared by James Stanley; data derived from Tradingview
USD/JPY Beyond 160.00
The difficult part about interventions is often the subjectivity behind them. While USD/JPY broke out above 160 and ultimately stalled just below 165, it was the response after the FOMC meeting that ultimately compelled the BoJ to act.
And that response from markets that led to the intervention was one of persistence as a Fed-fueled dip was merely bought by bulls and even with USD weakness showing more prominently against the Euro or British Pound, USD/JPY still retained strength. It was the BoJ intervention later that night that began to shift matters and then the next morning, the US Treasury Department jumping in.
So, while 160.00 would be a logical place for a more aggressive defense, the fact of the matter is that we simply don’t know if that would be the line in the sand, because, after all, interventions are not ideal as it requires burning finite FX reserves to bid down an exchange rate that your own policy is encouraging.
And on the rate hike front, there’s not really pressing demand for that in Japan, where CPI is roughly half the level of that seen in the US. This, once again, speaks to the fundamental bias on the long side of the pair and it’s even more rationale for longs to continue accumulating save for the risk of intervention.
But, if we do see that test above 160 the next spot circled on my chart is 160.60, which is both a prior swing-high turned swing-low that’s confluent with the 61.8% Fibonacci retracement of the recent sell-off. And the 38.2% retracement of that move is what caught the lows after the CPI print yesterday, inviting bulls to jump back in on the trend.
Remember what happened in 2022 – when the BoJ wanted to defend 150 but they waited, and by the time they did intervene price was at 151.95. If 160 gets taken out, the next move can happen very quickly.
USD/JPY Daily Chart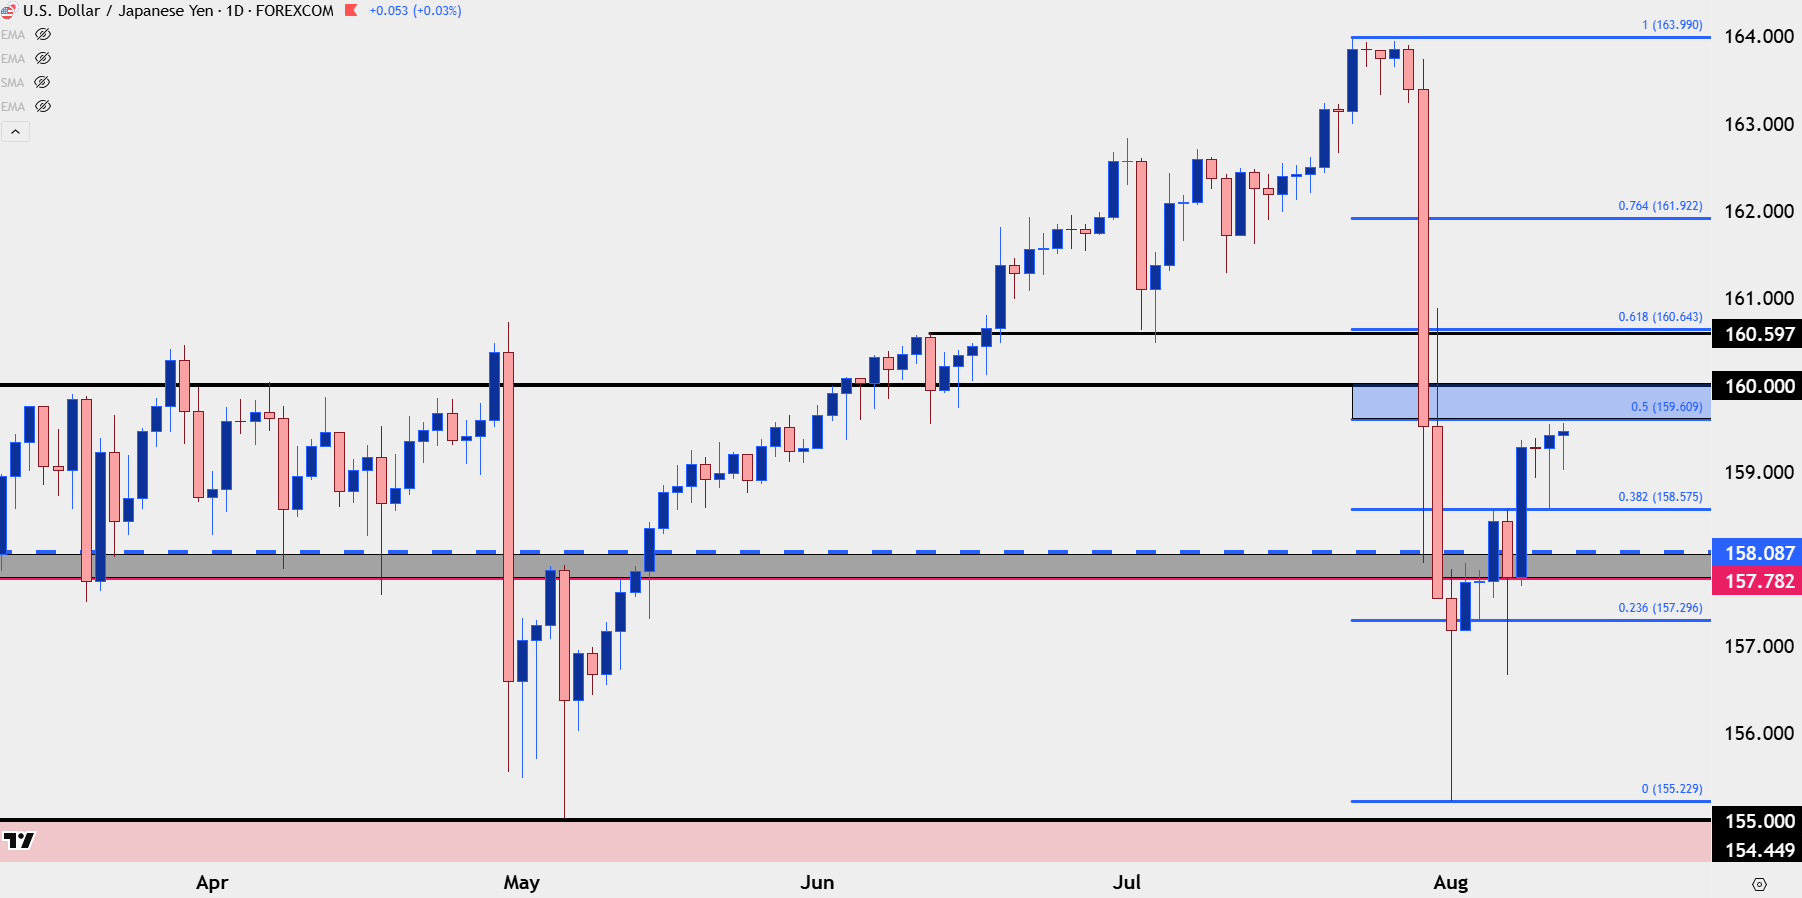
Chart prepared by James Stanley; data derived from Tradingview
--- written by James Stanley, Senior Market Analyst, Global Macro
Related tags:







Web Trader platform
Our sophisticated web-based platform is packed with features.
Open an account today
Experience award-winning platforms with fast and secure execution.
Economic calendar
Related articles

Canadian Dollar Forecast: USD/CAD Weekly Reversal Puts Yearly Uptrend Back in Focus 8 29 2026
USD/CAD has staged its strongest weekly advance since June, shifting the focus to whether a more durable low is finally taking shape.


USD/JPY weekly outlook: Payrolls may challenge the Fed’s hawkish reset
USD/JPY has finally woken from its slumber. Payrolls now loom as the key test of whether the latest hawkish repricing sticks or sinks.


Euro Short-term Outlook: EUR/USD Pullback Nears Pivotal Uptrend Support 8 28 2026
Warsh's comments accelerated the EUR/USD selloff, raising the stakes as buyers look to stabilize the broader recovery.