


USD Up After CPI: USD/JPY Edges Towards 160, EUR/USD, AUD/USD, GBP/USD Pull Back
CPI printed in-line with expectations and the net result at this point is a stronger Dollar, carried by USD/JPY clawing back following an early-morning sell-off.
Written by
James Stanley
Sr. Strategist
US Dollar Talking Points:
- The focus shifts to PPI as an expected reduction in Producer Prices highlights tomorrow’s macro calendar. Markets are looking for a 4.2% print from a prior month of 4.7%.
- At this morning’s CPI print, there was little excitement as both headline and core printed right at the expected 3.4% and 2.5%, respectively.
The USD is bouncing in late US trade following this morning’s CPI print, which came in right at the expected 3.4% and 2.5% for headline and core. At this point it still looks like the USD/JPY pair is dominating Dollar flows and that showed throughout today’s trade, with an early-morning sell-off in both markets reversing after the data release.
As looked at yesterday, inflation remains a hot button on the USD/JPY trade. Given that the pair is more than 50% above early 2021 levels there’s still a heavy long position holding on, and a whiff of change such as we saw in November of 2022 or 2023, or in July of 2024, can compel a sizable sell-off.
With this morning’s inflation report still showing well above the Fed’s targets, there’s still the harboring expectation for rate hikes later this year which removes some of that worry for USD/JPY longs. But the next chapter on inflation is in the spotlight tomorrow with the PPI release, which is often considered to be a lead-in for consumer prices, especially given our current backdrop.
With higher oil prices driving inflation in areas other than energy, the concern is whether the Fed is looking at a more systemic worry than just higher gas prices due to the war in Iran. That had started to show a couple of months ago, as Core CPI popped up to a 2.9% read after printing at 2.5% just a few months prior, and that’s likely one reason that the Fed started to shift into a more-hawkish stance in June which, in-turn, drove breakouts in both the USD and USD/JPY.
At this point, the USD has round-tripped since that June Fed meeting when the bank suddenly started to sound hawkish. The DXY basket has been finding support at the same spot that was in-play leading into that meeting, spanning up to the 99.52 area on the chart.
On that chart, we have a few important waypoints overhead, with the 100 handle in DXY followed by a big zone spanning from 100.22 up to 100.40. This was support back in 2024 as the Fed started hiking rates before coming in as resistance multiple times last year and then resistance-turned-support earlier this year.
US Dollar Daily Chart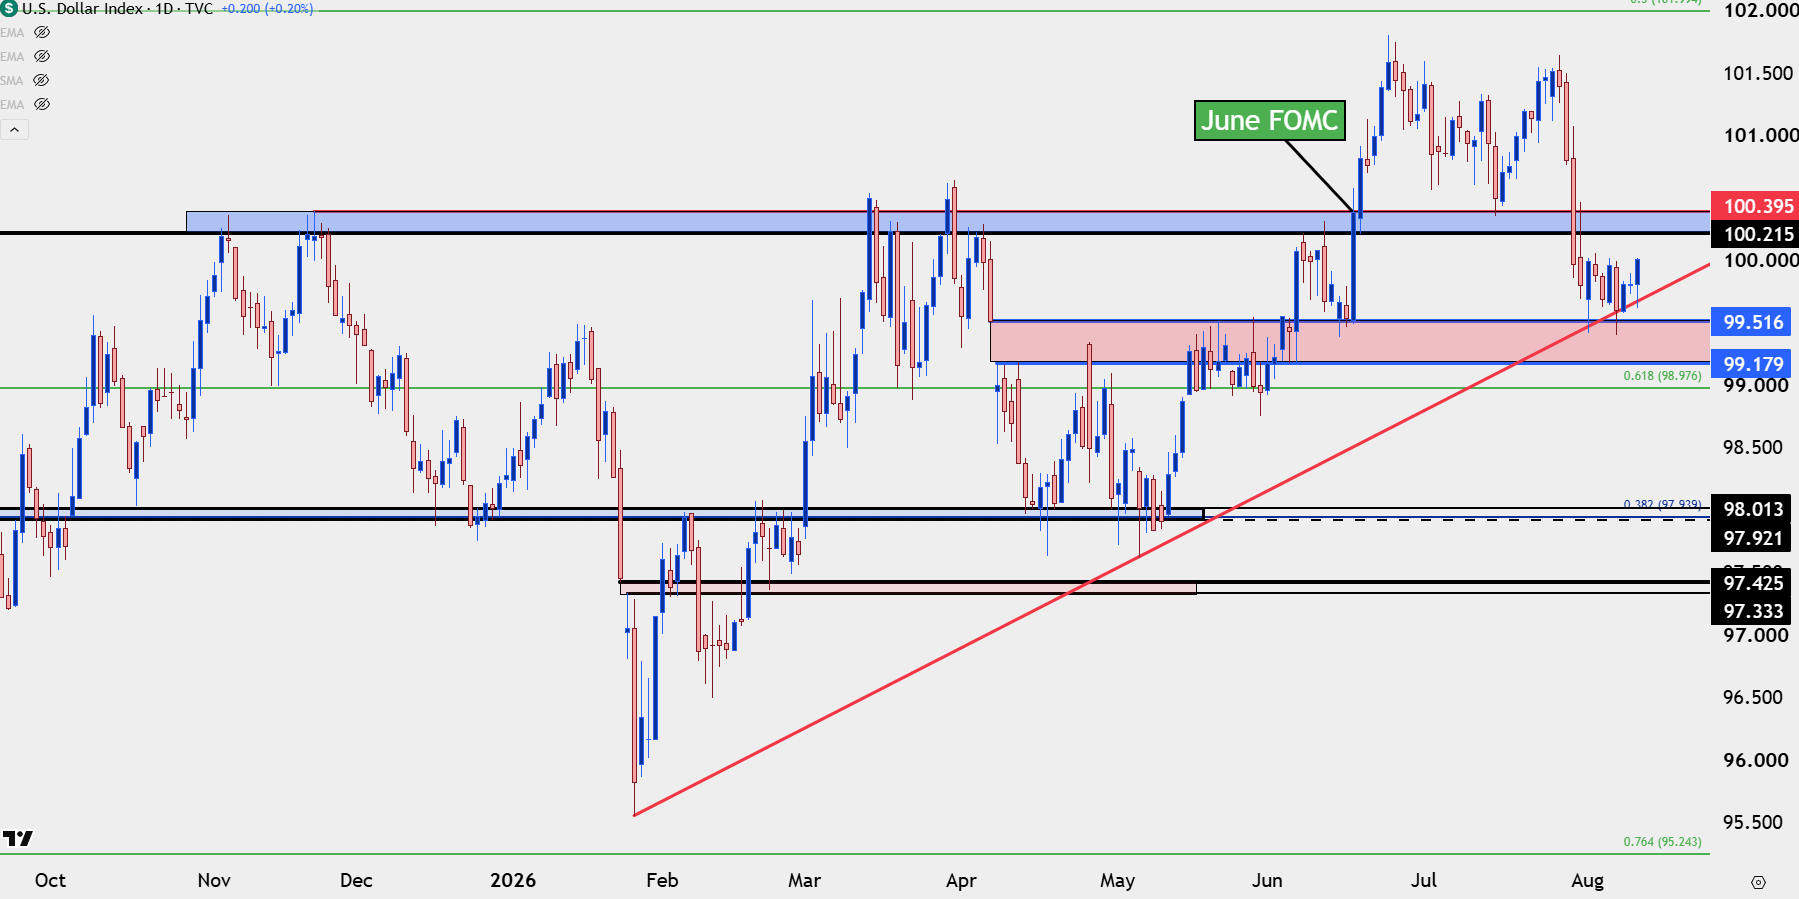
Chart prepared by James Stanley; data derived from Tradingview
USD/JPY
As goes USD/JPY, so goes the Dollar basket. And the underside wick on DXY followed by a rally into late trade echoes that sentiment with USD/JPY looking primed to re-test the 160.00 level of resistance.
The big question with 160 is whether we see another intervention. They last intervened when the pair was around 164 so, perhaps they won’t be so aggressive, and I think that’s what we’re seeing from bulls at this point as the rally has remained rather tepid near highs or tests of resistance while still aggressive on pullbacks or tests of support – and this makes sense if we consider the fact that an intervention seems unlikely at lower price levels while gains encounter a higher risk of such.
The important item from this morning is where support showed up. There was a quick pullback before the US opened and that pushed price right down to the 38.2% Fibonacci retracement of 158.58, which has so far set up as support. This price was also previous resistance so there’s a couple of different items of importance there and the 50% mark from that same move is nearing overhead. I’ve spanned that level up to the 160.00 spot for a resistance zone in the pair on the below chart.
Markets have an incredible way of sniffing out weakness and I think that’s what we’re seeing now, as the dual intervention from the US and Japan has set a line in the sand at 164, but will both, or either jump in earlier this time at 160? Markets seem to be getting more comfortable with testing that thesis right now.
USD/JPY Daily Chart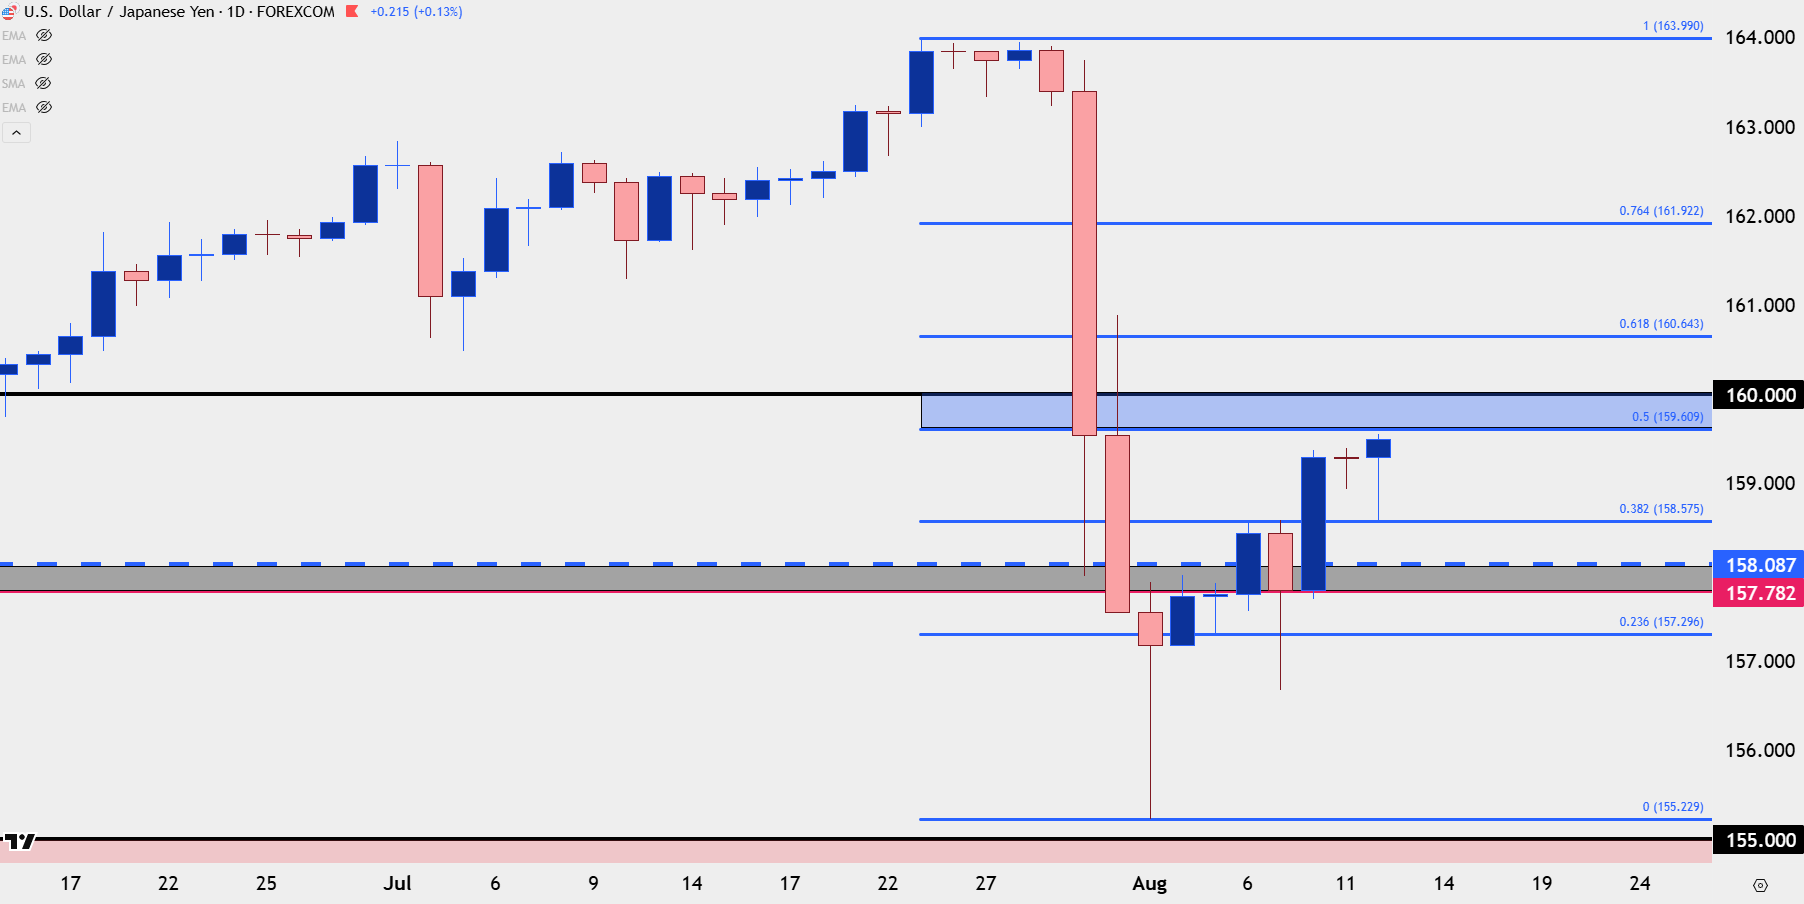
Chart prepared by James Stanley; data derived from Tradingview
EUR/USD
EUR/USD has put in minimal change so far in August and I think a lot of that dials back to the larger matter of the crowded trade in USD/JPY. But – EUR/USD is pulling back today following a resistance test last week, and there’s a big spot of support coming into view from around 1.1500 up to 1.1515, and there’s secondary support a bit lower from around 1.1455 up to 1.1469.
EUR/USD Daily Chart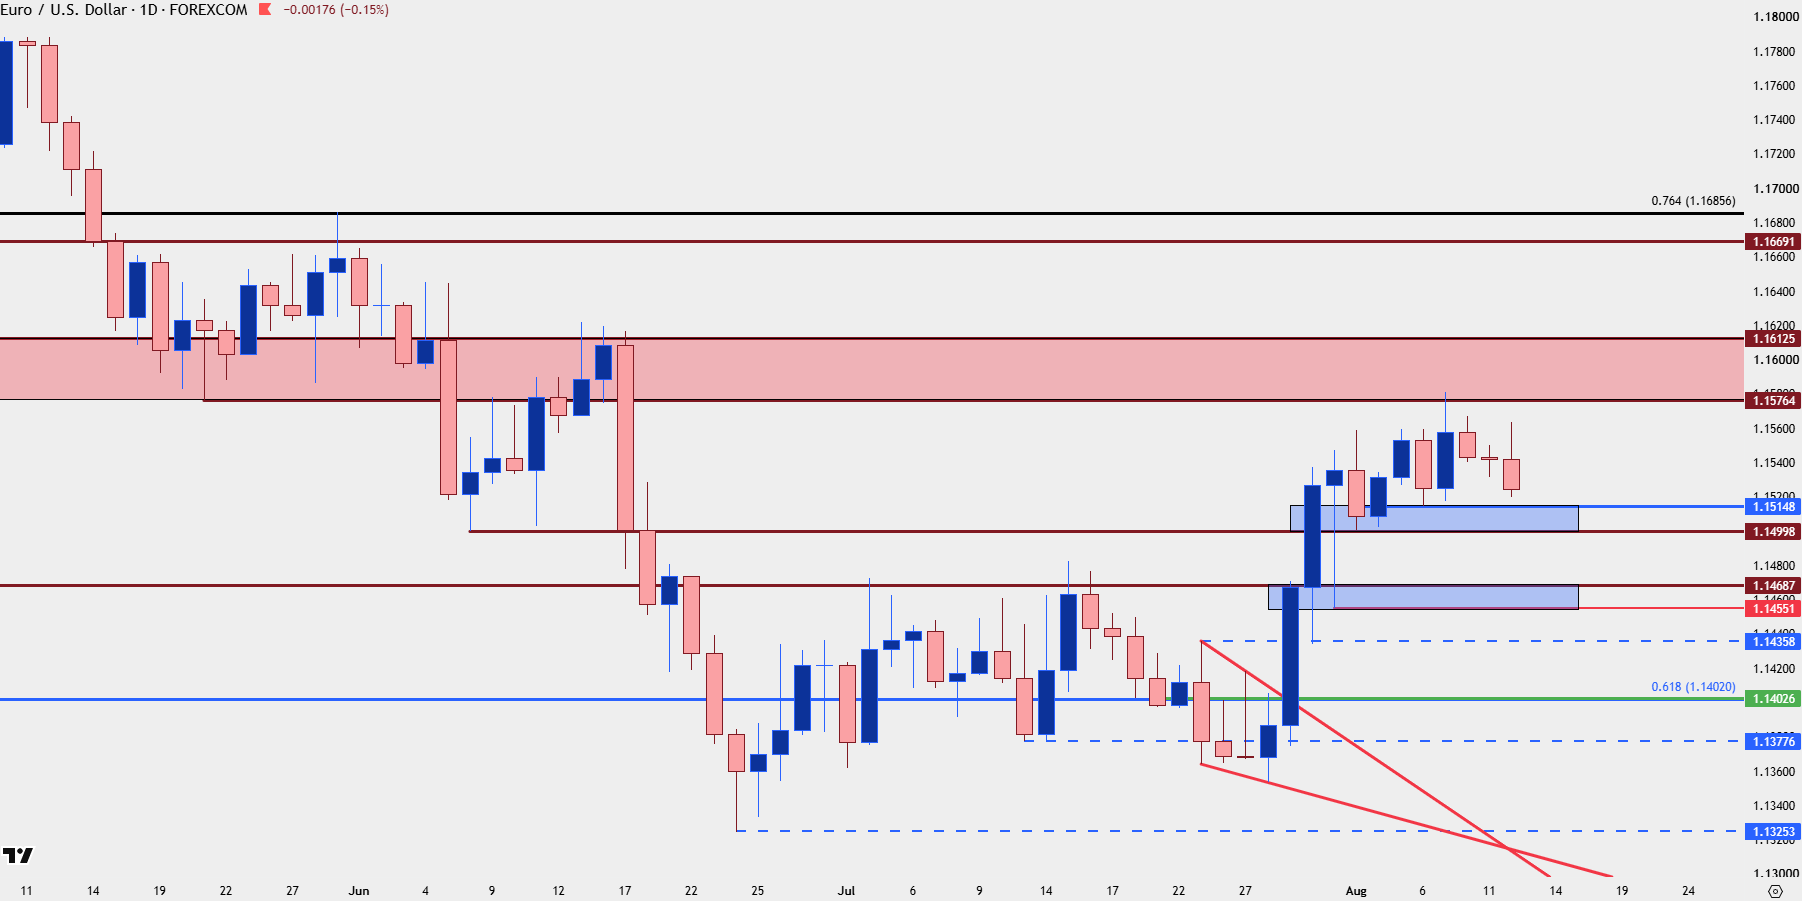
Chart prepared by James Stanley; data derived from Tradingview
GBP/USD
While EUR/USD held below key resistance established last week, GBP/USD extended its rally with another fresh high this morning when we had that initial push of USD-weakness following the USD/JPY pullback. With USD strength re-appearing, GBP/USD has similarly pulled back and now there’s a couple of support levels coming into view, with 1.3484 and 1.3470 getting closer.
GBP/USD Four-Hour Chart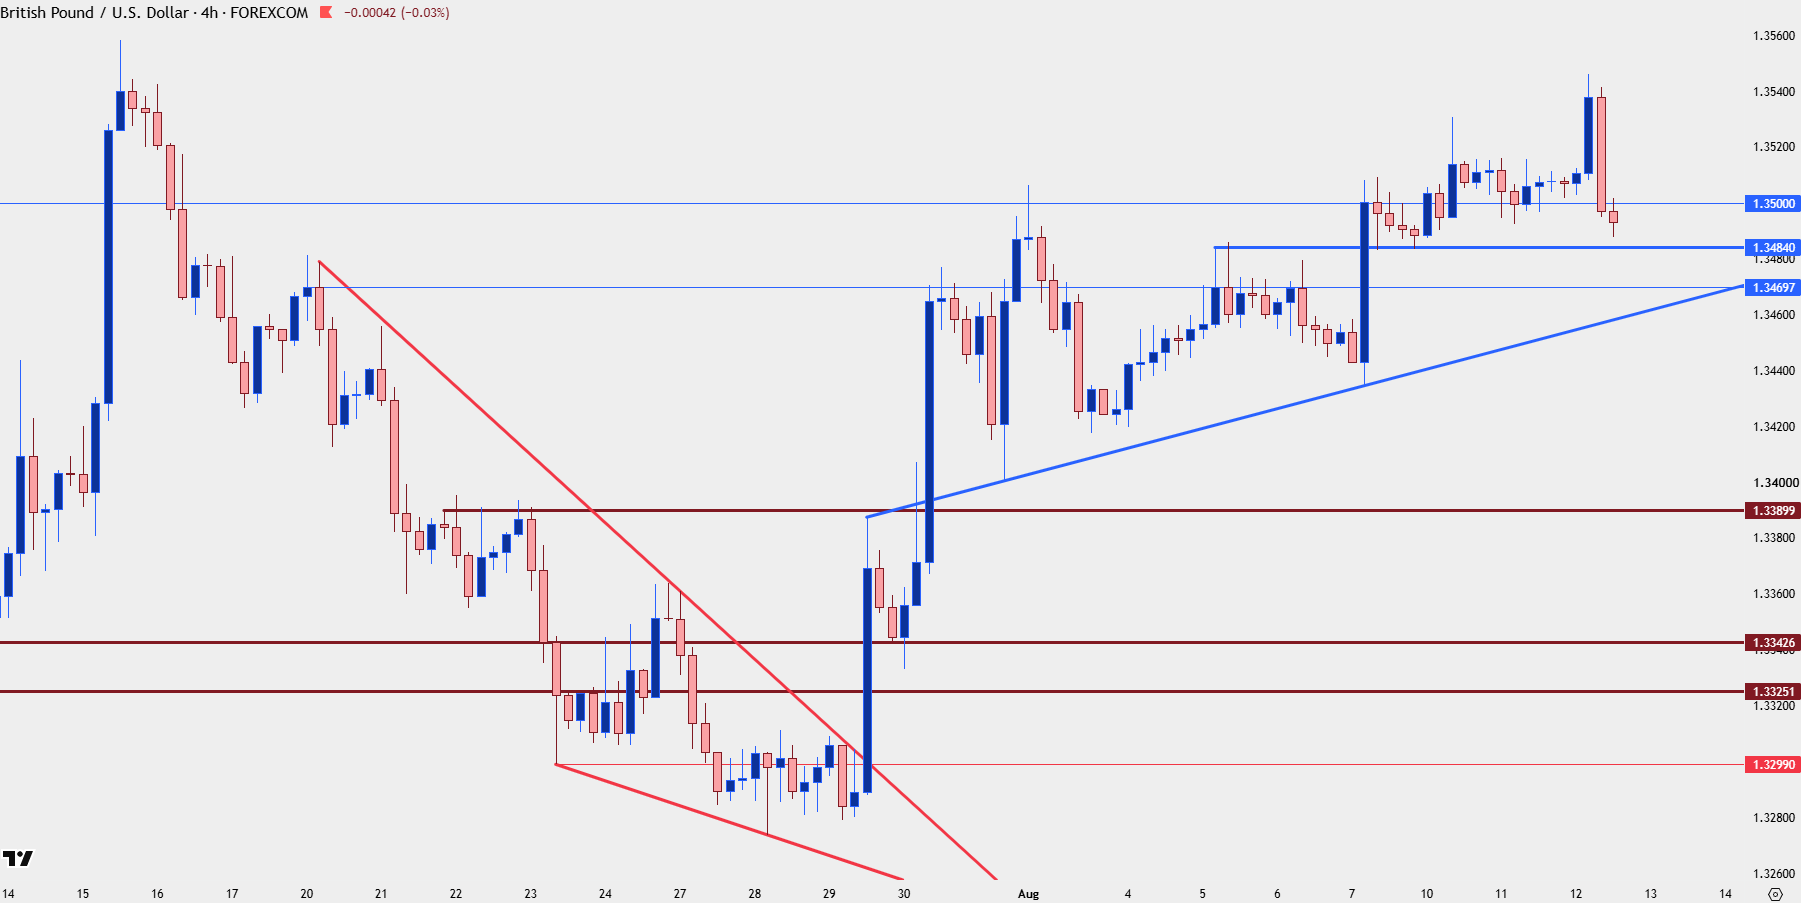
Chart prepared by James Stanley; data derived from Tradingview
AUD/USD
In this morning’s webinar which was about an hour after the CPI release, AUD/USD was testing the top of a resistance zone just inside of the .7100 handle. Since then, the USD pullback has erased those gains and at this point he daily bar is looking quite indecisive. This isn’t necessarily doom and gloom, but it does highlight how chasing fresh breakouts especially with the noisiness of a news release can be a dangerous way to go.
At this point the big question is whether higher-low support plays and there’s a big spot that’s already being tested around .7050 and another sits below around .7021.
AUD/USD Daily Chart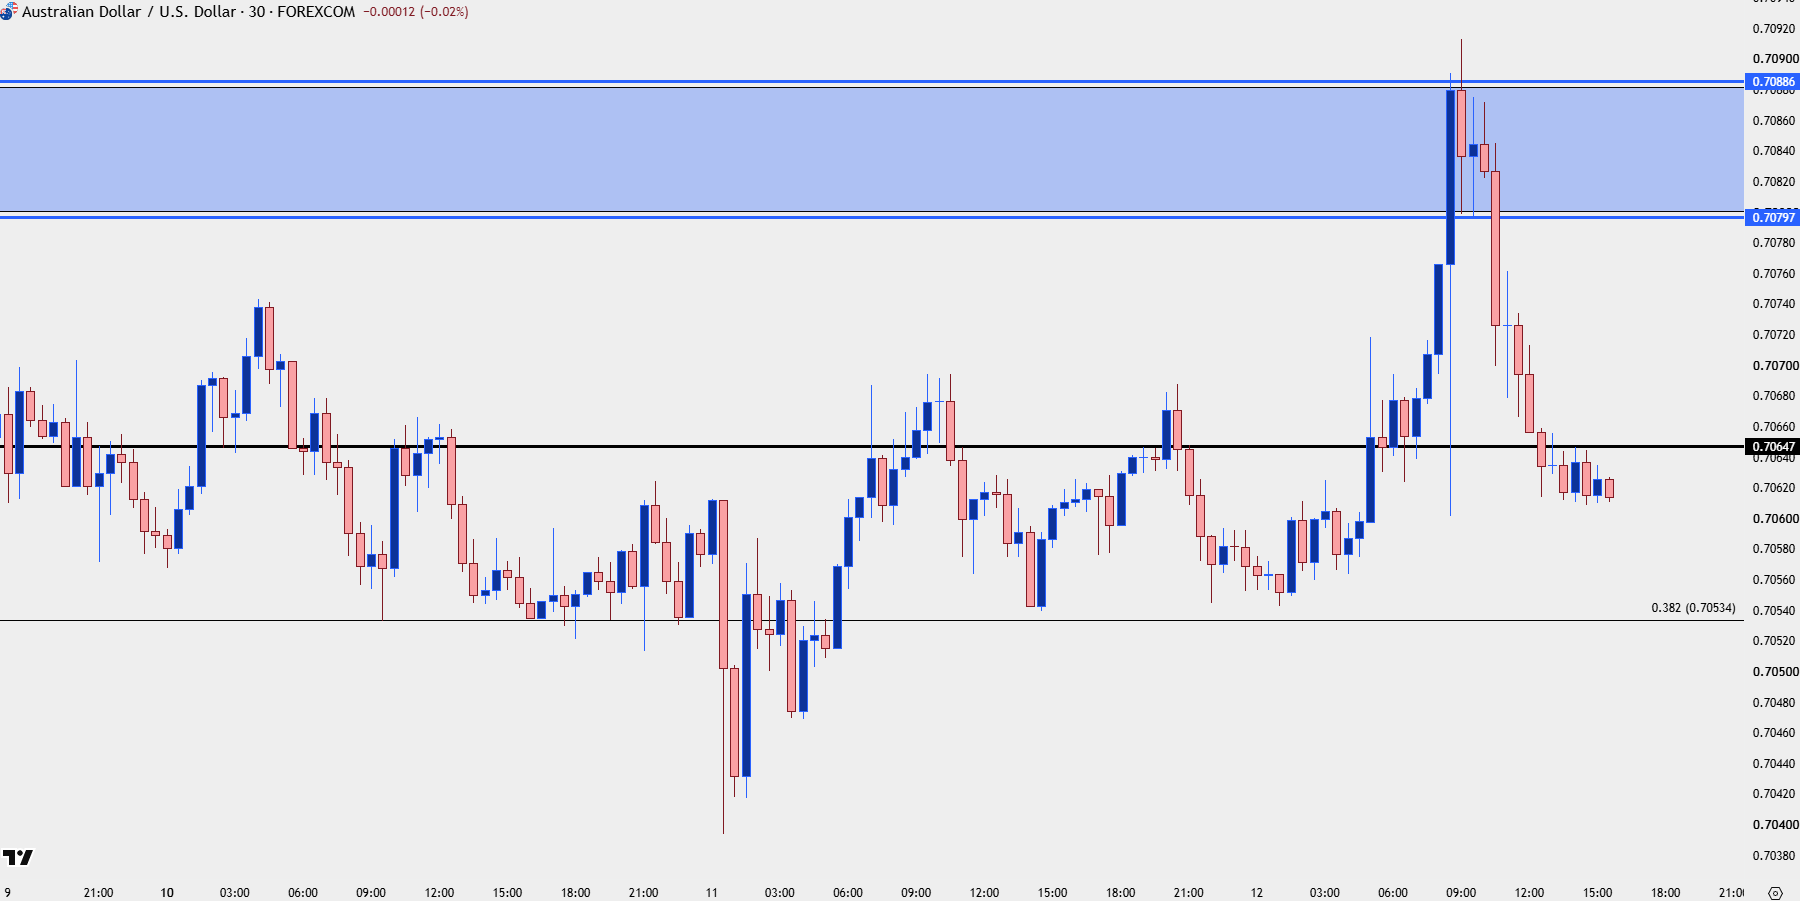
Chart prepared by James Stanley; data derived from Tradingview
--- written by James Stanley, Senior Market Analyst, Global Macro
Latest market news










Web Trader platform
Our sophisticated web-based platform is packed with features.
Open an account today
Experience award-winning platforms with fast and secure execution.
Economic calendar
Related articles

EUR/USD forecast: All eyes on Warsh at Jackson Hole - Forex Friday
For much of this week, the EUR/USD has been edging lower with the US dollar regaining some ground after last week’s sell-off that was triggered, in part, by the bond market worries. Investors have been unwilling to bet further against the US dollar so far this week ahead of Kevin Warsh’s keynote speech at the Jackson Hole summit, due later today.


DAX, GBP/USD Forecast: Two trades to watch 2708
DAX rises as Nvidia boosts AI trade ahead of Jackson Hole. GBP/USD slips below 1.36 as Fed expectations shift.


DAX and EUR/USD forecast: Lower energy prices, yields offer support
But the question, of course, is how much further oil prices and bond yields can fall. For now, the combination is supportive of risk assets and is helping to sustain a relatively benign decline in the dollar. The focus today will be on US core PCE inflation, due for release shortly, while Nvidia’s second-quarter earnings will provide another test for risk appetite after the US markets close – not just for US indices but for global tech-heavy indices given the influence Nvidia has over the global tech and AI names.