


Nasdaq 100 Update NDX Continues Moving Away from the 30000 Point Area
Trading conditions remain challenging for Nasdaq 100. Over the past five trading sessions, the index has declined by nearly 3.2%, reinforcing a meaningful bearish bias in the short term. Selling pressure has persisted even after the release of the Federal Reserve's minutes, while bond market yields continue to trade at elevated levels.
Written by
Julian Pineda
Market Analyst
Trading conditions remain challenging for Nasdaq 100. Over the past five trading sessions, the index has declined by nearly 3.2%, reinforcing a meaningful bearish bias in the short term. Selling pressure has persisted even after the release of the Federal Reserve's minutes, while bond market yields continue to trade at elevated levels. These factors have limited the recovery in risk appetite and appear to be weighing on demand for technology stocks. As long as this environment remains in place, downside pressure could continue to influence Nasdaq price action in the coming sessions.

Are Central Bank Expectations Failing to Support Confidence?
This week has been particularly important from a macroeconomic perspective due to the release of the Federal Reserve's meeting minutes, an event that continues to provide clues about the future direction of U.S. interest rates. Although the minutes did not confirm a clearly aggressive stance, they did keep alive the possibility of additional rate hikes later this year because of ongoing concerns surrounding inflation.
In this environment, as long as inflation remains a key issue for the Fed, markets are likely to continue pricing in the risk of a more restrictive monetary policy. This could affect both financial liquidity and broader growth expectations, two factors that are especially important for the large technology companies that make up the Nasdaq 100.
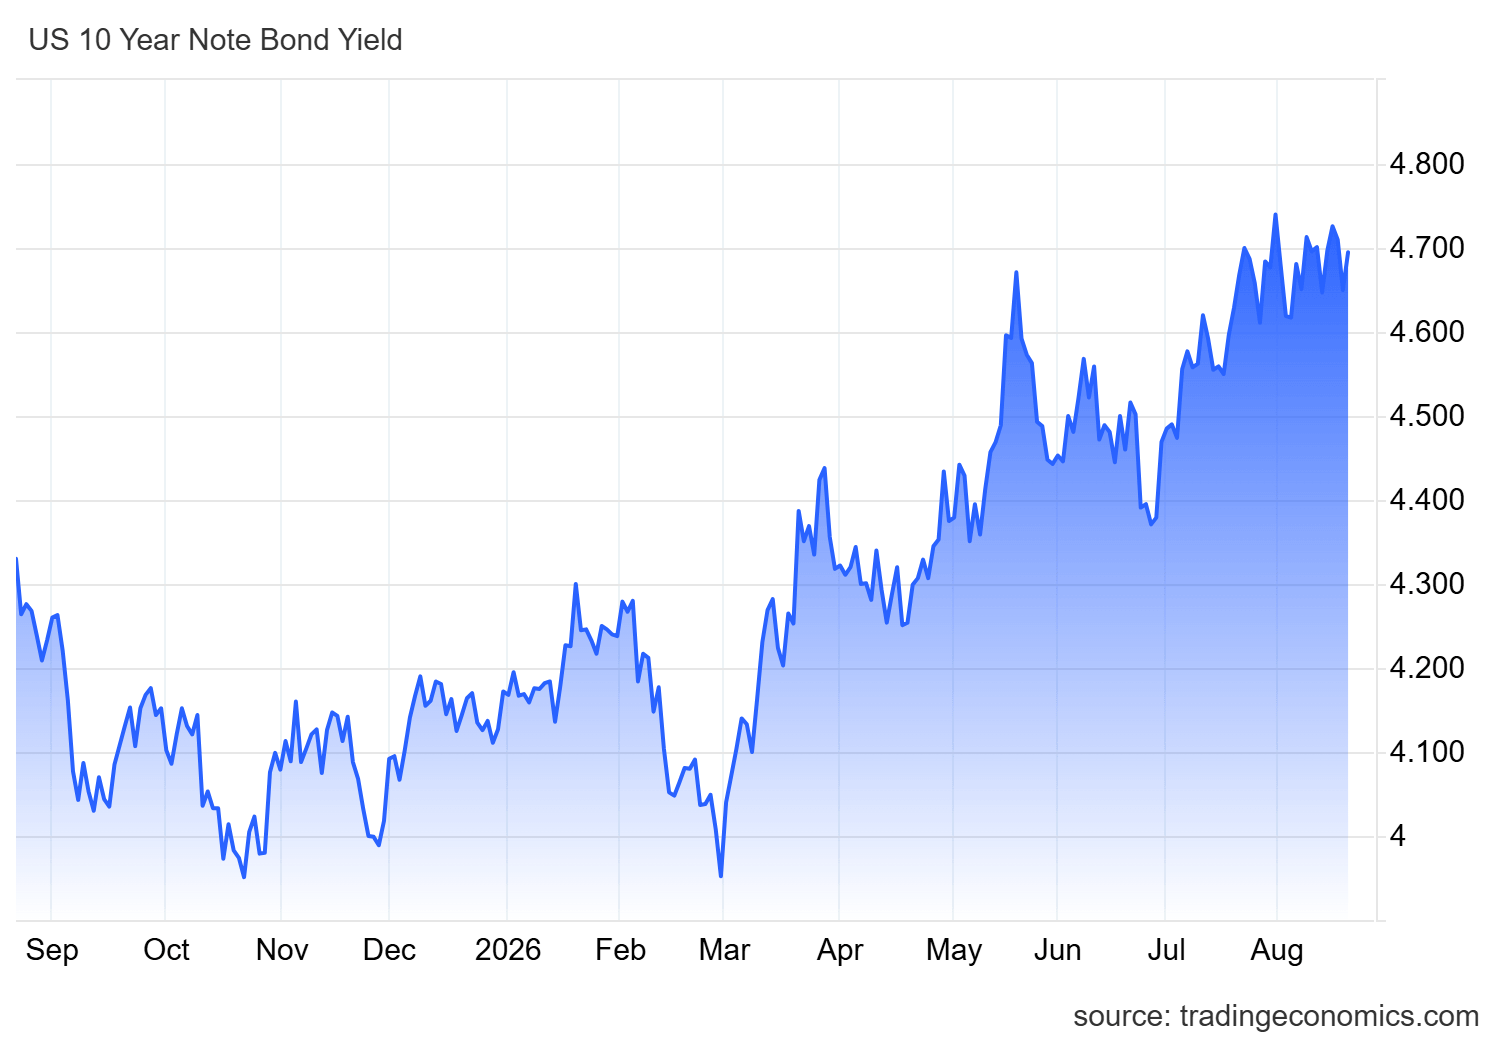
Another important development has been the behavior of the bond market. Despite a temporary pullback in yields during the previous session, U.S. Treasury yields quickly resumed their upward move, with the 10-year Treasury yield returning toward the 4.7% area and remaining close to the highs recorded in 2026. Elevated bond yields continue to offer investors an attractive alternative to equities, which may reduce capital flows toward growth-oriented indices such as Nasdaq.
Source: TradingEconomics
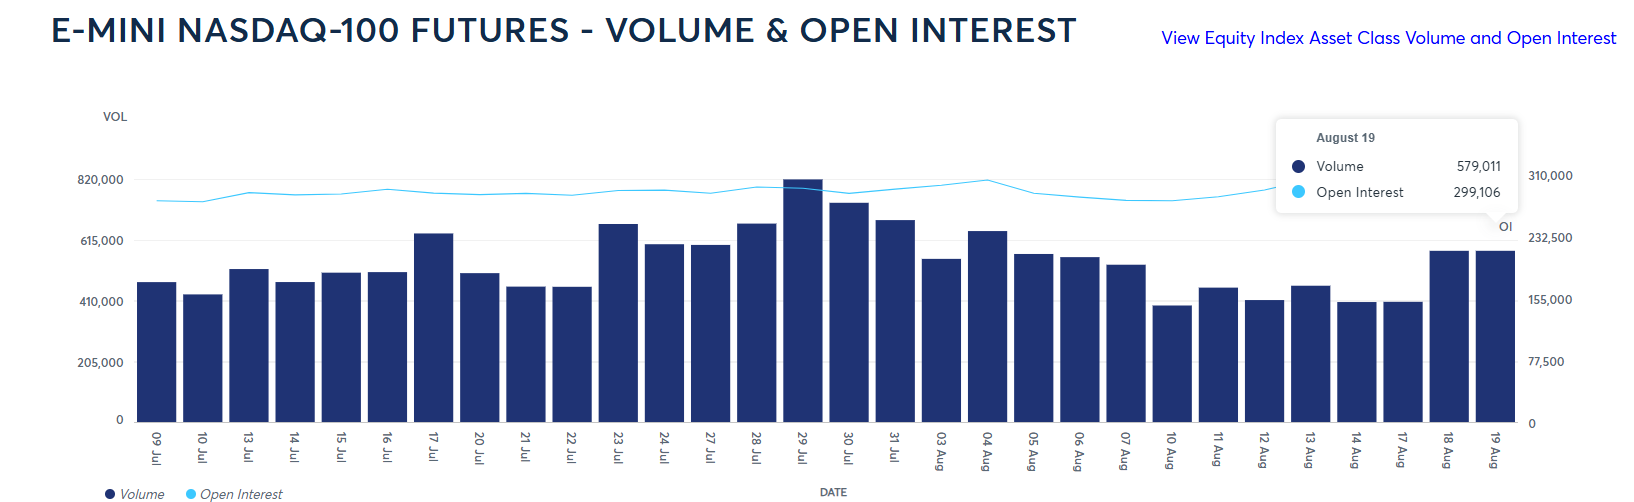
The combination of elevated yields and uncertainty surrounding the Federal Reserve's next moves has also prevented a meaningful improvement in market confidence. This can be seen in the futures market, where Open Interest in E-mini Nasdaq Futures remained close to 300,000 open contracts as of August 19. The relatively stable figure suggests that investors have not yet begun building significant new bullish positions, reflecting a cautious approach as questions surrounding monetary policy and financial conditions remain unresolved.
Source: CMEGROUP
Taking all of this into account, Nasdaq activity continues to face short-term limitations. Concerns surrounding Federal Reserve policy and the behavior of the bond market remain key drivers of sentiment, meaning that selling pressure could continue to play an important role over the coming sessions.
How Is Long-Term Confidence Evolving?
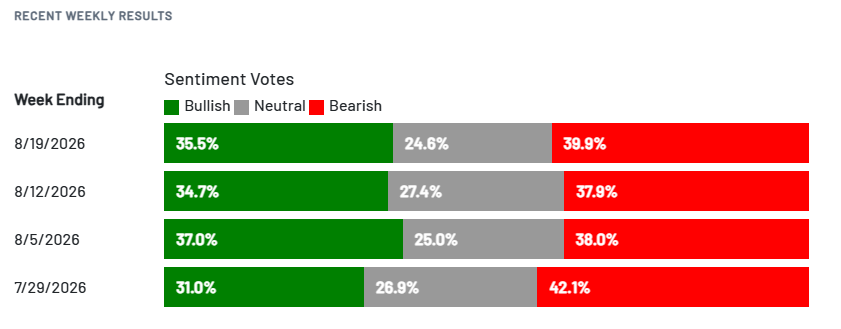
The medium- and long-term outlook continues to show signs of uncertainty. This can be observed through the AAII Sentiment Survey, where expectations for the stock market over the next six months show 35.5% bullish sentiment, 24.6% neutral sentiment, and 39.9% bearish sentiment. These figures suggest that a significant portion of market participants still has reservations about the stock market's ability to sustain consistent growth in the months ahead.
Part of these concerns remains linked to the substantial investments that major U.S. companies continue to make in artificial intelligence. While the long-term growth potential of the sector remains attractive, some investors continue to question how quickly these investments will translate into stronger corporate earnings.
Source: AAII
Until confidence indicators begin to show a clearer directional bias, uncertainty is likely to remain an important factor for the Nasdaq. The lack of a dominant bullish or bearish conviction could continue to favor periods of indecision and range-bound price action over the coming weeks.
Nasdaq 100 Technical Forecast

Source: StoneX, Tradingview
- Sideways range continues to dominate: Over recent weeks, Nasdaq has maintained a relatively clear consolidation structure. Despite recent volatility, the index continues to trade within a broad sideways range that remains the dominant technical pattern on the chart. Unless price manages to break decisively beyond either boundary of this range, the lack of a clear directional trend is likely to remain the market's defining characteristic.
- RSI: The RSI continues to fluctuate around the neutral 50 level, suggesting that the balance between buyers and sellers remains relatively stable. As long as the indicator stays near this threshold, neutral conditions may continue to dominate short-term price action.
- MACD: A similar pattern can be seen in the MACD, whose histogram remains close to the zero line. This indicates that the average strength of short-term moving averages remains relatively balanced, reinforcing the view that the market is currently moving through a consolidation phase.
Key Levels to Watch:
- 30,700 Points – Key Resistance: This area represents the most important upside barrier on the chart and coincides with the highs recorded during 2026. Price action returning to this zone could challenge the current consolidation range and open the door to a stronger bullish bias.
- 29,380 Points – Near-Term Barrier: A reference level that aligns with the 50-period simple moving average. Continued trading around this area could reinforce the current neutral outlook and support the continuation of the broader sideways range.
- 27,308 Points – Key Support: A significant support area that coincides with a period of market indecision observed in April of this year. If selling pressure extends toward this level, a more pronounced bearish bias could begin to emerge and potentially create room for the development of a short-term downward trend.
Written by Julian Pineda, CFA, CMT – Market Analyst
Follow him on: @julianpineda25
Latest market news










Web Trader platform
Our sophisticated web-based platform is packed with features.
Open an account today
Experience award-winning platforms with fast and secure execution.
Economic calendar
Related articles

Gold and S&P 500 analysis: What now after Warsh’s hawkish speech?
The dollar surged across the board after the Fed Chair Kevin Warsh surprised with a hawkish-leaning speech at the Jackson Hole summit. All the bearish dollar bets that had been accumulated since last Friday on the back of data weakness and bond market troubles had to be squared and that triggered a short squeeze rally for the dollar. Gold and silver dropped, as a result, as too did bitcoin, while US indices were giving back earlier gains.


Nasdaq 100 Forecast: NDX slips ahead of Fed Chair Warsh’s speech
U.S. stocks are edging lower on Friday, giving back some of yesterday's gains after Nvidia's strong outlook revived the tech trade. The focus has now shifted firmly to Fed Chair Kevin Warsh's Jackson Hole speech, with investors looking for more clarity on the outlook for interest rates.


Nasdaq 100 forecast: Tech stocks shine as Nvidia results underpin AI trade
Much of this week’s attention has been on Nvidia’s earnings, and the chipmaker delivered the sort of numbers of investors had been hoping for. US index futures initially wobbled before moving higher overnight, with the results providing a fresh lift to the AI trade