


Nasdaq Leads Wall Street Lower: Tesla Turns, Apple Sours
Wall Street slumped as delayed NFP data hit sentiment, the Nasdaq reversed sharply, and bearish signals emerged in Tesla and Apple.
Written by
Matt Simpson
Market Analyst
Wall Street weakened sharply on Thursday as delayed NFP data reignited volatility and the Nasdaq led indices lower. Mega-cap tech names added fuel to the slide, with bearish signals now emerging across Tesla and Apple — raising the stakes for markets already on edge.
View related analysis:
Nasdaq Leads Wall Street Lower as Tesla Turns and Apple Sours
Delayed NFP Release Triggers Volatility
Wall Street had a volatile jolt on Thursday following the delayed release of September’s Nonfarm Payrolls (NFP) figures. While the rise in unemployment to 4.4% added an element of weakness overall, the 119k jobs added — alongside a higher participation rate — was enough to convince traders there’s no immediate need for the Fed to cut. This comes on top of the latest FOMC minutes, which effectively confirmed no December cut is coming.
Nvidia Earnings Bounce Fades as Nasdaq Leads the Selloff
Nasdaq 100 futures again led the S&P 500 and Dow Jones lower, despite initially gapping higher after strong Nvidia (NVDA) earnings released after Wednesday’s close. It marked the most bearish day on Wall Street in six weeks and the Nasdaq’s most volatile session since Trump’s tariffs fractured sentiment in April.
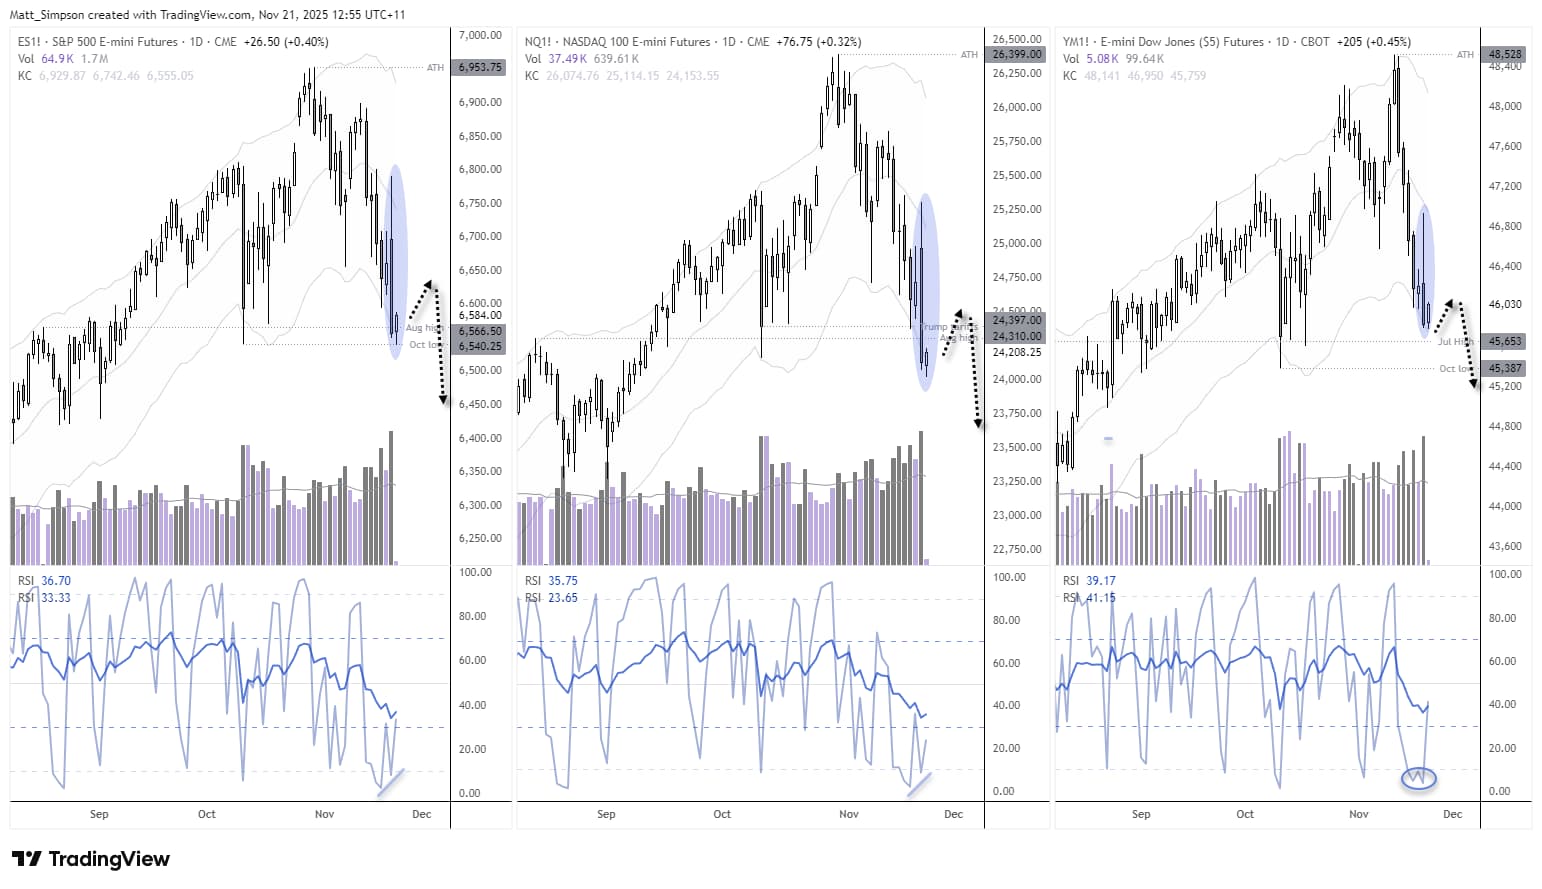
Chart analysis by Matt Simpson - data source: TradingView
- S&P 500 futures fell -1.6% and formed a prominent bearish engulfing day, though they held above the October low for now.
- Nasdaq 100 futures fell -2.6%, closed beneath the bearish candle formed when Trump recently threatened to raise tariffs on China again, and also finished below the October low.
- Dow Jones futures were again the relative outperformer, falling -0.8% but holding above both the July high and October low.
- This keeps the same dynamic in play: the Dow tends to outperform on up days, while the Nasdaq leads the downside moves.

Volumes Point to Bearish Initiation Despite Oversold Readings
Trading volumes have been trending higher across all three Wall Street indices, signalling bearish initiation and suggesting further losses may be ahead. With that said, all three indices have daily RSI (2) in oversold territory or forming bullish divergence while prices sit just beneath the lower Keltner band — so a bounce wouldn’t be surprising. The core bias, though, remains for bears to fade into any minor rallies and aim lower.
Nasdaq 100 Futures Technical Analysis: Trend Weakens After Three-Week Decline
The US tech sector is on track for a third straight weekly decline. The Nasdaq hasn’t seen a bearish weekly sequence like this since February, when the index went on to fall -26% from the February high that marked the start of that selloff.
For context, the Nasdaq is currently -9% off its record high. A repeat of a -26% decline from the peak would take it below 20,000. I’m not that bearish at this stage, but a move towards its 2024 high at 23,114 — near the 50-week EMA — looks feasible.
The 1-hour chart shows support has formed around the 24,090 high-volume node and the 100% projection level. Prices are trying to rise, but volumes are thin — in stark contrast to the heavy bearish volumes during the decline. That makes any bounce without a meaningful bullish catalyst questionable, and likely something bears will look to fade.
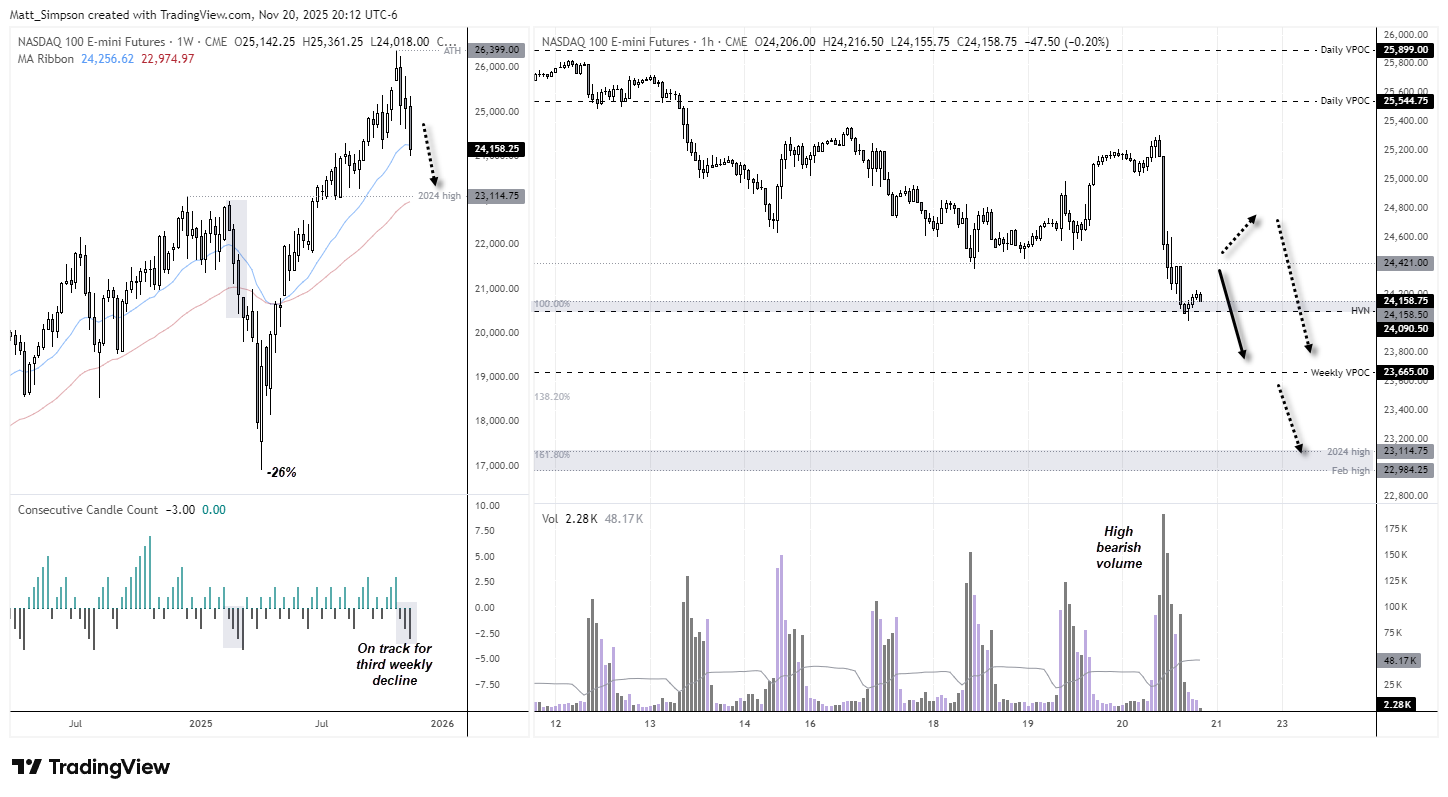
Charts prepared by Matt Simpson, Source: TradingView
Tesla (TSLA) Technical Analysis: Bearish Momentum Hints at Swing HIgh
A double top formed around 470 on the weekly chart, which itself was a lower high relative to its record set in December. Momentum has clearly turned lower after a bearish divergence formed on the weekly RSI (14).
The daily chart shows a bearish engulfing day formed on high volume which strongly hints at a swing high. That the engulfing candle failed to retest the high-volume node (HVN) of the prior congestion area, and reversed back beneath the monthly S1 pivot, adds to my bearish conviction on this timeframe.
The May high (367.7) and 200-day EMA (359.29) are now in focus for bears, a break beneath which brings the HVN ~320 into focus.

Chart analysis by Matt Simpson - data source: NYSE, TradingView

Apple (AAPL) Technical Analysis: Momentum Weakens After Rejection at 272
Apple’s decision to scale back AI investment has helped its share price hold up far better than other mega-cap tech stocks during the recent AI rout. That’s why early signs of momentum turning lower in Apple deserve attention.
The weekly chart shows repeated upper wicks above 272, signalling a clear lack of buying strength at those highs. A bearish divergence has also formed on the weekly RSI (2), even though the RSI (14) hasn’t quite reached overbought.
Thursday produced a notably bearish candle that failed to retest the cycle high, suggesting momentum may now be shifting.
Apple may not be the ideal short candidate given its relative strength, but it’s absolutely one to watch — because if the wheels come off here, it likely means far heavier selling elsewhere.
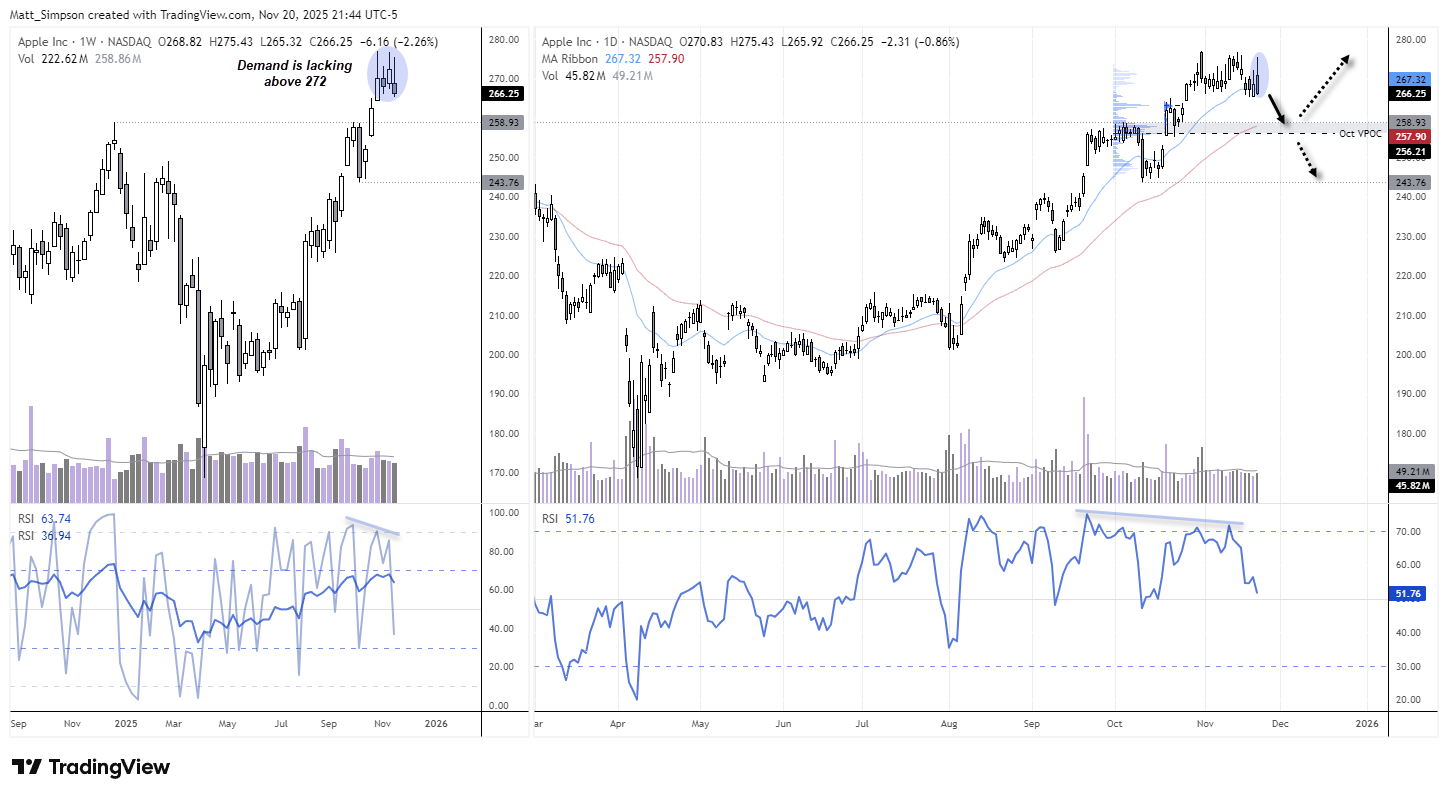
Chart analysis by Matt Simpson - data source: TradingView
View the full economic calendar
-- Written by Matt Simpson
Follow Matt on Twitter @cLeverEdge
How to trade with City Index
You can trade with City Index by following these four easy steps:
- Open an account, or log in if you’re already a customer
• Open an account in the UK
• Open an account in Australia
• Open an account in Singapore
- Search for the market you want to trade in our award-winning platform
- Choose your position and size, and your stop and limit levels
- Place the trade







Web Trader platform
Our sophisticated web-based platform is packed with features.
Open an account today
Experience award-winning platforms with fast and secure execution.
Economic calendar
Related articles

Euro Short-term Outlook: EUR/USD Pullback Nears Pivotal Uptrend Support 8 28 2026
Warsh's comments accelerated the EUR/USD selloff, raising the stakes as buyers look to stabilize the broader recovery.


Gold and S&P 500 analysis: What now after Warsh’s hawkish speech?
The dollar surged across the board after the Fed Chair Kevin Warsh surprised with a hawkish-leaning speech at the Jackson Hole summit. All the bearish dollar bets that had been accumulated since last Friday on the back of data weakness and bond market troubles had to be squared and that triggered a short squeeze rally for the dollar. Gold and silver dropped, as a result, as too did bitcoin, while US indices were giving back earlier gains.


EUR/USD forecast: All eyes on Warsh at Jackson Hole - Forex Friday
For much of this week, the EUR/USD has been edging lower with the US dollar regaining some ground after last week’s sell-off that was triggered, in part, by the bond market worries. Investors have been unwilling to bet further against the US dollar so far this week ahead of Kevin Warsh’s keynote speech at the Jackson Hole summit, due later today.