

NZD/USD Forecast: RBNZ Survey Threatens to Break the Calm
The Kiwi has gone quiet, but the RBNZ Survey of Expectations out soon may provide the catalyst traders have been waiting for.
Written by
David Scutt
Market Analyst
- NZD/USD volatility sits near two-decade lows
- Kiwi swaps price aggressive RBNZ tightening
- Two-year inflation expectations headline crucial RBNZ survey
- AUD/NZD probes potential bullish breakout
- NZD/USD bullish momentum fading fast
The Survey That Could Shift RBNZ Pricing
The Kiwi has been unbelievably quiet in August, but that calm may be living on borrowed time. Volatility is sitting near the lowest levels seen in two decades, Kiwi rates markets are heavily priced for further RBNZ tightening, and today brings the release of a survey that has historically carried meaningful implications for interest rates.
The RBNZ’s Survey of Expectations is probably the most important New Zealand release most have never heard of. Two-year inflation expectations are the number to watch, with a meaningful deviation carrying the potential to jolt the Kiwi out of its funk.
Markets Have Priced Plenty of Hikes
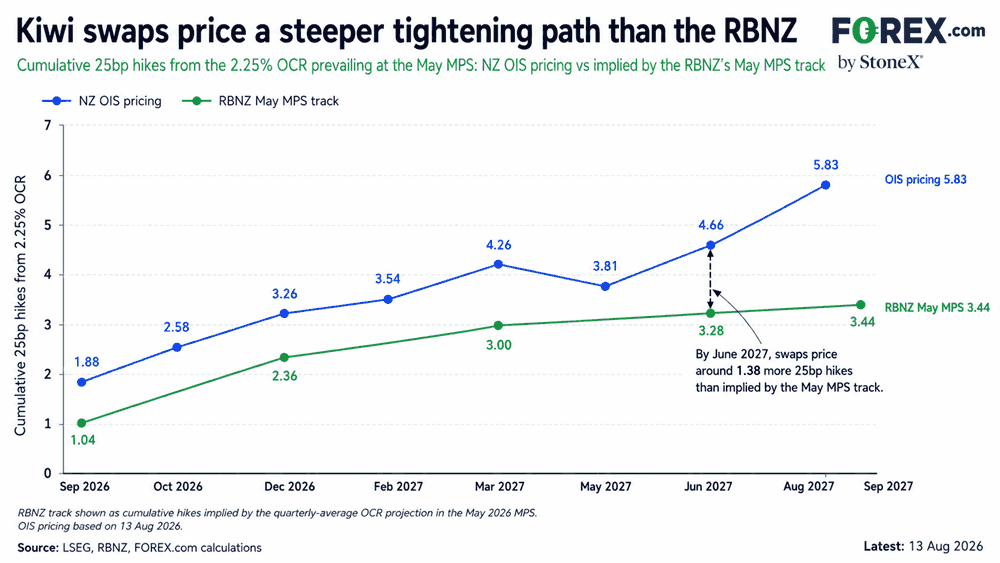
Ahead of its release, swaps traders continue to expect a relatively aggressive monetary policy tightening cycle from the RBNZ, even after the modest pullback sparked by the soft New Zealand employment report earlier this month. Implied pricing puts the probability of a hike at the September meeting at 88%, with roughly 3.7 further hikes priced by June next year and close to five by August, on top of the first increase of the cycle delivered last month.
Source: RBNZ, FOREX.com, Bloomberg
That is far steeper than the path implied by the RBNZ’s May forecasts. From the 2.25% OCR prevailing at the time, its track implied around 3.3 hikes by the middle of next year. That differential suggests the hurdle for a further hawkish repricing is high, meaning a modest increase in inflation expectations later today may not be enough. If we were to see a retracement in inflation expectations, it could prove far more meaningful for Kiwi rates and currency.
RBNZ Reaction Function Is More Sensitive to Falls
The survey provides several measures of inflation, but it’s the two-year reading that tends to be more influential when it comes to monetary policy. It is more reflective of medium-term price pressures, rather than capturing near-term volatility in food, energy and other prices. Two-year expectations rose to 2.53% in the May survey, putting them well above the 2% midpoint of the RBNZ’s 1–3% inflation target.
Source: RBNZ, FOREX.com
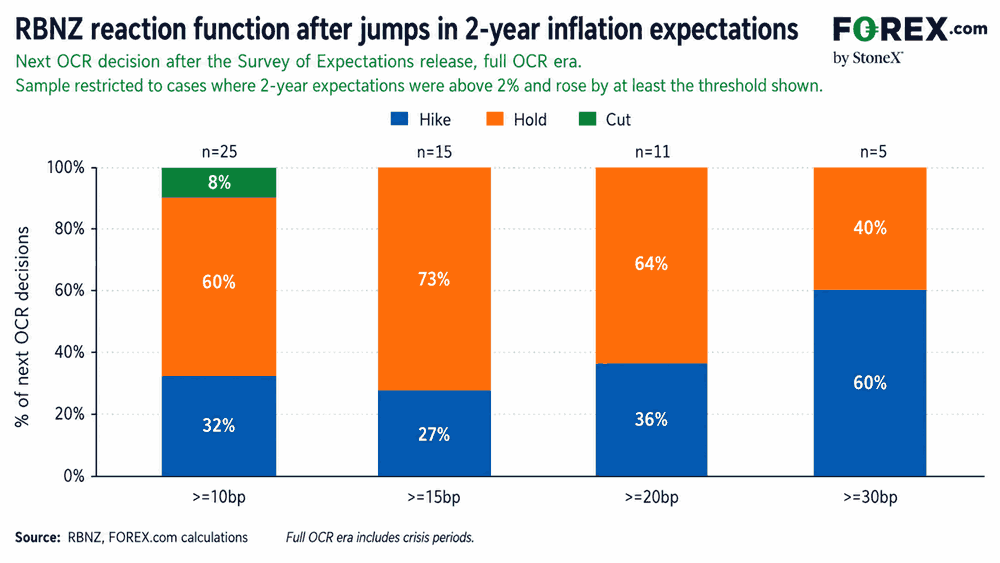
What’s interesting is that the historical relationship is not especially mechanical when expectations rise. Increases of at least 10bp, 15bp and 20bp while two-year expectations were above 2% were followed by a hike at the next meeting only 32%, 27% and 36% of the time respectively. It was only when the increase reached 30bp or more that the response became noticeably more hawkish, with the RBNZ hiking in 60% of cases, although that is based on only five observations.
The reaction has been considerably stronger since 2020. Increases of at least 20bp while two-year expectations were above 2% were followed by a hike at the next meeting in 60% of cases, while all three increases of 30bp or more were followed by a hike.
Source: RBNZ, FOREX.com
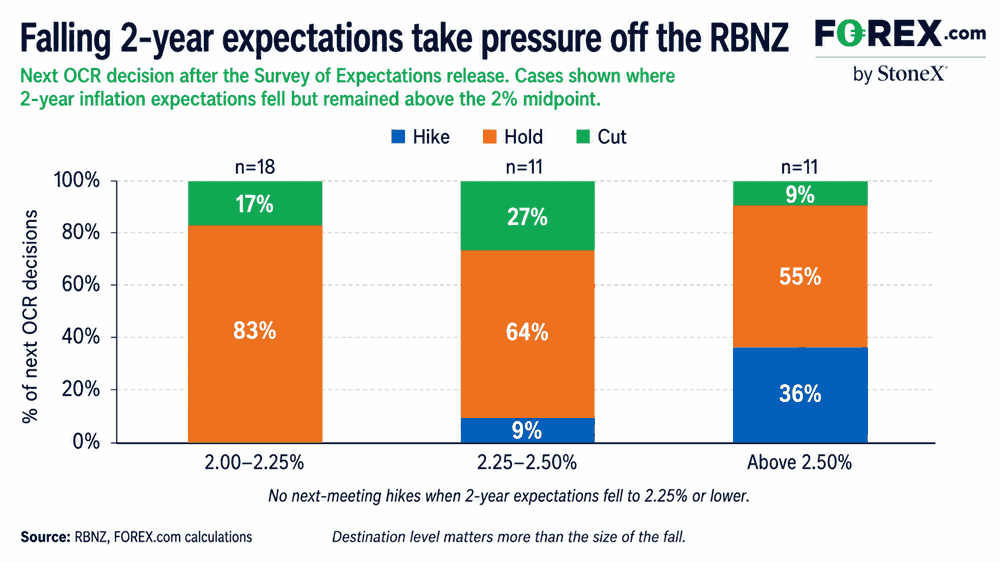
More interesting is what happens when inflation expectations fall, particularly when the decline takes the two-year measure back towards the RBNZ’s 2% target midpoint. Historically, that has produced a much stronger reaction function at the following policy meeting than an equivalent increases in expectations.
When two-year expectations fell but remained between 2.00% and 2.25%, the RBNZ did not hike at the next meeting in any observation across more than two decades of data. When they finished between 2.25% and 2.50%, the next-meeting hike rate was just 9%. By contrast, when expectations fell but remained above 2.50%, the RBNZ still hiked 36% of the time.
Kiwi Volatility Goes Cold
Source: LSEG, FOREX.com
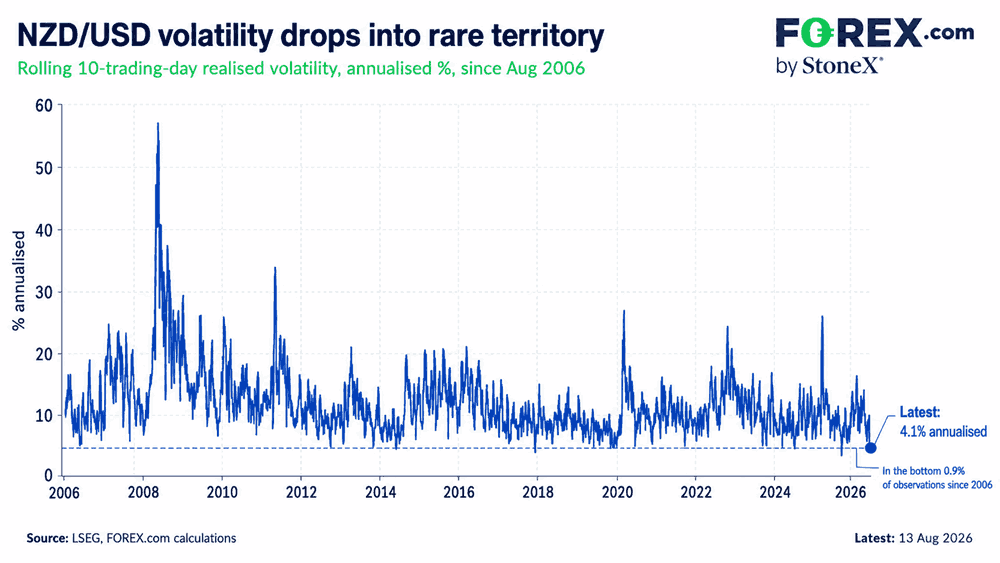
While there’s been plenty of political instability in New Zealand over the past week, there's been almost none in the Kiwi. NZD/USD has been remarkably subdued, with 10-day realised volatility falling to 4.1% annualised, putting it in roughly the bottom 1% of observations going back two decades!
A decline in inflation expectations, particularly back towards the RBNZ’s 2% target midpoint, could force traders to rethink the aggressive tightening path and weigh on the Kiwi as a result.
NZD/USD Downside Risk Starts to Build
Source: TradingView
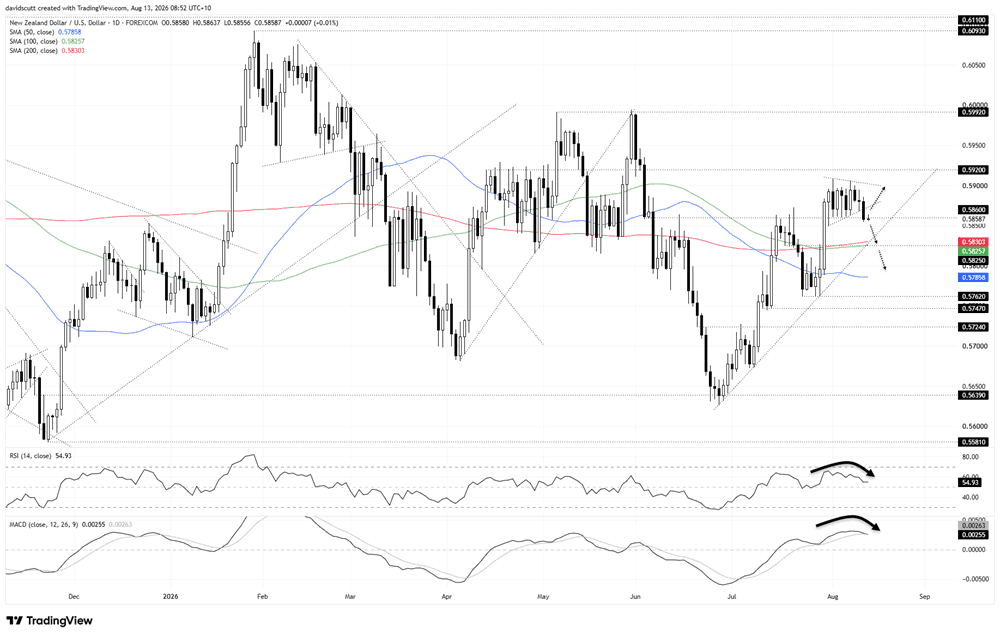
You can see visually how quiet NZD/USD has been over the past fortnight. What has piqued my interest is the pair breaking lower from what resembles a wedge structure in the wake of the US July inflation report, pushing down to test 0.5860, a level that has acted as both support and resistance earlier this year.
The message from the oscillators suggests upside momentum is fading fast. RSI (14) has been setting sequentially lower highs and lower lows and now sits only marginally above the neutral 50 level. MACD has also staged a bearish crossover, although it remains in positive territory. Combined with the recent price action, that suggests the bears may be slowly gaining the upper hand.
If the breakdown extends through 0.5860, attention shifts to the confluence of the 100 and 200-day moving averages, horizontal support around 0.5825 and the uptrend dating back to the late-June low. That is the key downside support zone to watch. A break beneath it would open the door for a deeper retracement towards the 50-day moving average, 0.5762, 0.5747 and 0.5724.
If the price manages to push back into the former compression structure, 0.5900 is the level to watch overhead. A move above there that sticks may encourage bulls to look for a run towards 0.5920, which has previously acted as support, followed by 0.5992.
AUD/NZD Bulls Eye Breakout
Source: TradingView
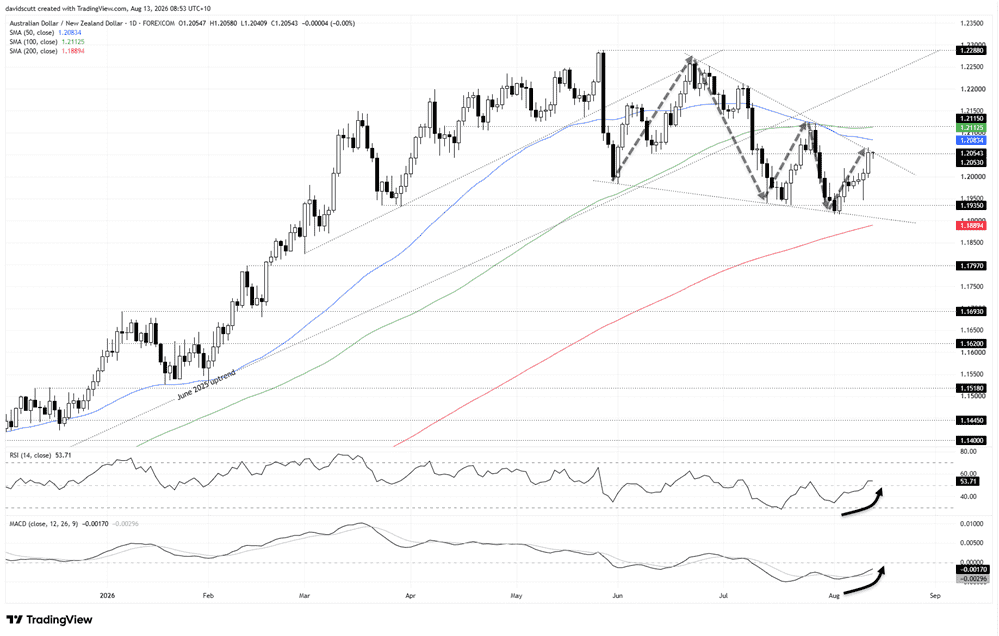
The price action in AUD/NZD is arguably more interesting, with a firming in RBA rate hike pricing seeing the cross rebound strongly from beneath support at 1.1935. You can’t help but notice the price is now testing the upper end of a structure that resembles a falling wedge, which is a bullish continuation pattern. Having come after a very strong rally over the past year, it suggests the pair may be on the cusp of breaking out and retesting the highs set earlier this year.
The upper boundary of the structure kicks in around 1.2053, which also coincides with horizontal resistance. A break of that level would put the 50-day and 100-day moving averages into play for bulls, with the latter marking an area where the pair stalled in late July after another rebound. A move back above the confluence of the 100-day moving average with 1.2115 resistance would improve the probability of a run towards the recent highs.
If the upper boundary of the structure holds, we may see a potential retracement back towards 1.2000, a level that capped gains previously earlier this month. Beyond that, 1.1935 and the lower boundary of the compression structure, found today around 1.1900, are the next downside levels to watch, along with the key 200-day moving average located just beneath.
Mirroring the rebound seen over the past two weeks, the oscillators have turned more constructive for the bulls. RSI (14) is setting higher highs and higher lows and now sits marginally above the neutral 50 level. MACD has also staged a bullish crossover but remains negative, although it is pushing back towards positive territory. It is still a mixed signal, more neutral in nature, but it does suggest the bears no longer have it their own way.
Latest market news










Web Trader platform
Our sophisticated web-based platform is packed with features.
Open an account today
Experience award-winning platforms with fast and secure execution.
Economic calendar
Related articles

Gold and S&P 500 analysis: What now after Warsh’s hawkish speech?
The dollar surged across the board after the Fed Chair Kevin Warsh surprised with a hawkish-leaning speech at the Jackson Hole summit. All the bearish dollar bets that had been accumulated since last Friday on the back of data weakness and bond market troubles had to be squared and that triggered a short squeeze rally for the dollar. Gold and silver dropped, as a result, as too did bitcoin, while US indices were giving back earlier gains.


EUR/USD forecast: All eyes on Warsh at Jackson Hole - Forex Friday
For much of this week, the EUR/USD has been edging lower with the US dollar regaining some ground after last week’s sell-off that was triggered, in part, by the bond market worries. Investors have been unwilling to bet further against the US dollar so far this week ahead of Kevin Warsh’s keynote speech at the Jackson Hole summit, due later today.

Bitcoin Forecast: BTC/USD Back to $80K Ahead of Warsh’s Jackson Hole Speech
After surging over $15,000 in the past 10 days alone, there is risk of a near-term pullback if Warsh says anything remotely hawkish at Jackson Hole - what are the levels to watch from here?
