

Q4 2026 Bitcoin Outlook: Did the August Rally Mark the Cycle Low?
The outlook for Bitcoin in Q4 is turning cautiously optimistic on the back of renewed ETF purchases, compelling valuations, and an improvement in buy-and-hold behavior among investors - see the full analysis!
Written by
Matt Weller
Head of Market Research
Bitcoin Key Points
- The historically-reliable 4-year halving cycle suggests that Bitcoin’s bear market may soon be coming to an end, if it hasn’t already.
- The outlook for Bitcoin in Q4 is turning cautiously optimistic on the back of renewed ETF purchases, compelling valuations, and an improvement in buy-and-hold behavior among investors.
- From a technical perspective, the balance of the risks for Bitcoin is gradually shifting to the topside, with the near-term bias outright bullish above the $80K round handle.
Bitcoin H1 2026 in Review
Our last Bitcoin outlook was titled “One More Quarter of Pain Before a Major Bottom?”, and based on the price action we’ve seen over the last three months, either answer to that question was almost exactly half right.
Bitcoin spent the first month and a half of Q3 languishing near 2-year lows in the $60,000 range before rallying sharply in mid-August to reach the current level in the mid-$80K range, catalyzed by fresh concerns about sovereign debt loads, a short squeeze, and the return of ETF inflows.
Below, we update our quarterly outlook for the king of cryptocurrencies and highlight relevant fundamental and technical trends that will drive Bitcoin in the coming months.
Bitcoin Q2 2026 Outlook
Starting from a top-down perspective, analysts have identified a reliable 4-year cycle centered around the Bitcoin Halving that has relatively reliably helped traders identify significant tops and bottoms over the years, though that’s no guarantee it will necessarily continue to do so moving forward.
For the uninitiated, the Bitcoin Halving is when the reward for mining new bitcoins is cut in half. This reduces the rate at which new Bitcoins are created and thus lowers the total supply of new Bitcoin coming into the market. The halving tends to increase scarcity and can make Bitcoin a more compelling investment for some traders. As any Bitcoin bull will tell you, the most recent halving in April 2024 took the “inflation rate” of Bitcoin’s supply to below 1% per year, less than half of gold’s annual inflation rate.
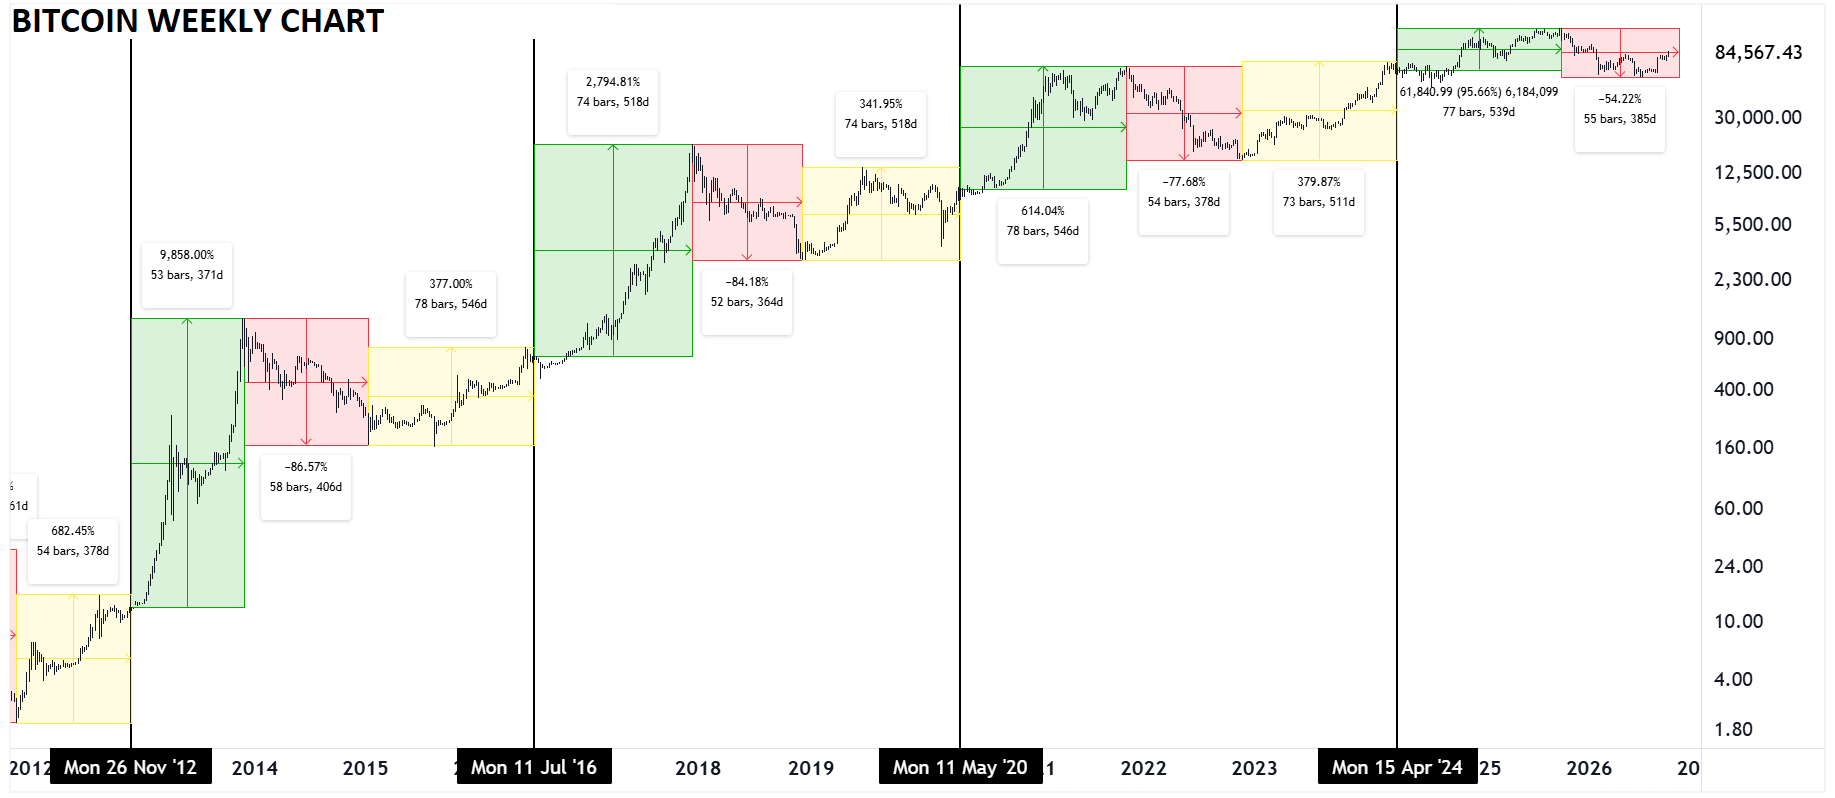
Looking at my favorite chart, which I colloquially call “The Only Bitcoin Chart You'll Ever Need™”, previous Bitcoin halvings have marked the transition from the (yellow) post-bottom recovery rally stage to the (green) full-blown bull market stage, followed by a (red) bear market stage as sentiment resets.
Projecting a similar time-based cycle forward from the last halving suggests that we reached the peak of the last cycle at the start of Q4 2025, and that we may now be nearing the transition from a bear market to a recovery:
Source: TradingView, StoneX. Past performance is no guarantee of future returns.
Beyond the 4-year cycle, the fundamental and technical outlook for Bitcoin remain mixed, although shifting to a more constructive backdrop as we discuss in more detail below.
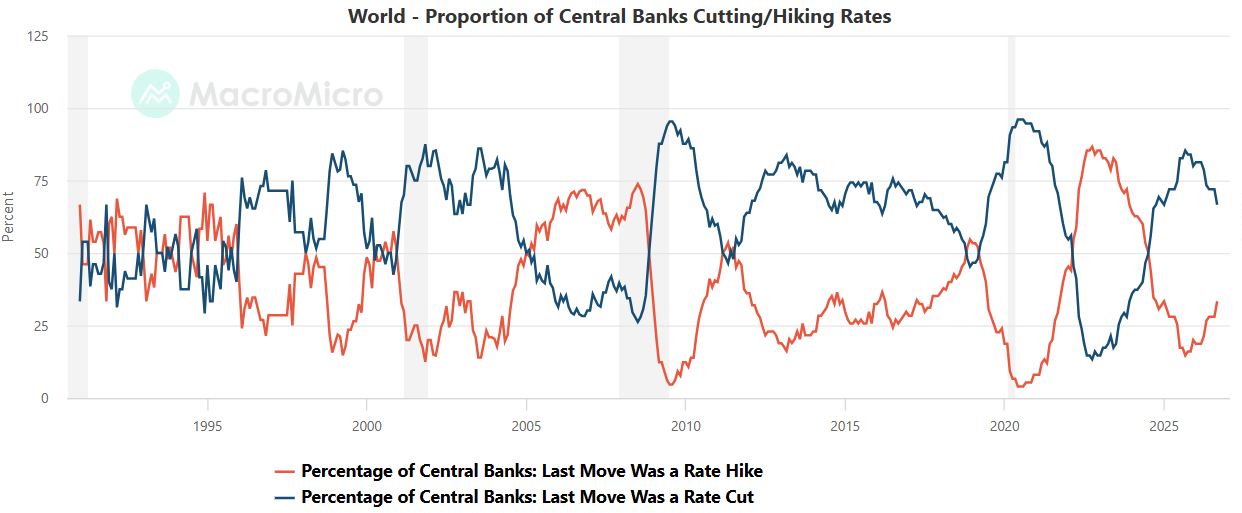
From a macroeconomic perspective, the monetary policy backdrop appears to be shifting, with more and more central banks tipping toward interest rate increases as they seek to offset a lingering energy shock stemming from the conflicts in Iran and Ukraine. As the chart below shows, most global central banks have still cut interest rates more recently, but with major central banks like the ECB, BOJ, and Federal Reserve delivering rate increases in recent months, the rest of the world may soon be forced to follow:
Source: MacroMicro
Looking ahead, the ongoing shift to a focus on the risks of re-accelerating inflation may develop into a potential headwind for Bitcoin as we move through Q4, though concerns about fiscal sustainability and inflation could partially offset that risk.
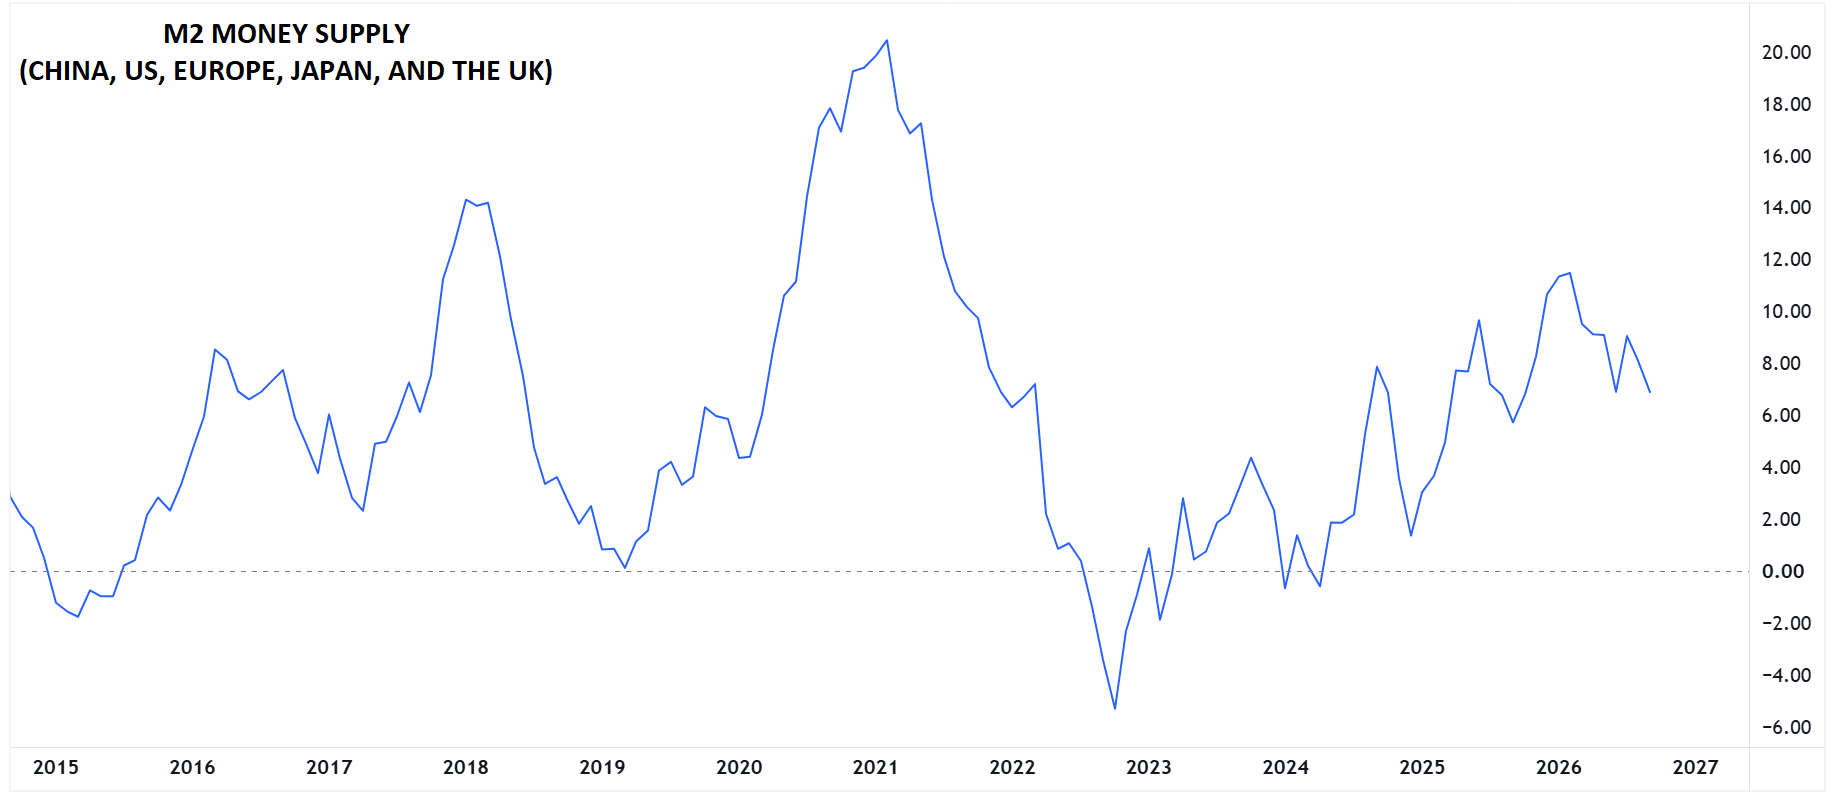
Meanwhile, the growth rate of fiat money in the financial system has slowed in recent months. So-called “M2” is central banks’ estimate of the total money supply, including all the cash people have on hand, plus all the money deposited in checking accounts, savings accounts, and other short-term saving vehicles such as certificates of deposit (CDs). While it is still growing, the year-over-year growth in M2 has dropped toward 6% from prior highs near 12% earlier this year:
Source: TradingView, StoneX.
One of the key narratives driving Bitcoin’s value is the idea of “hard money” or a hedge against fiat currency debasement, and as long as the global supply of money continues to increase, that theme could help support the cryptocurrency’s price.
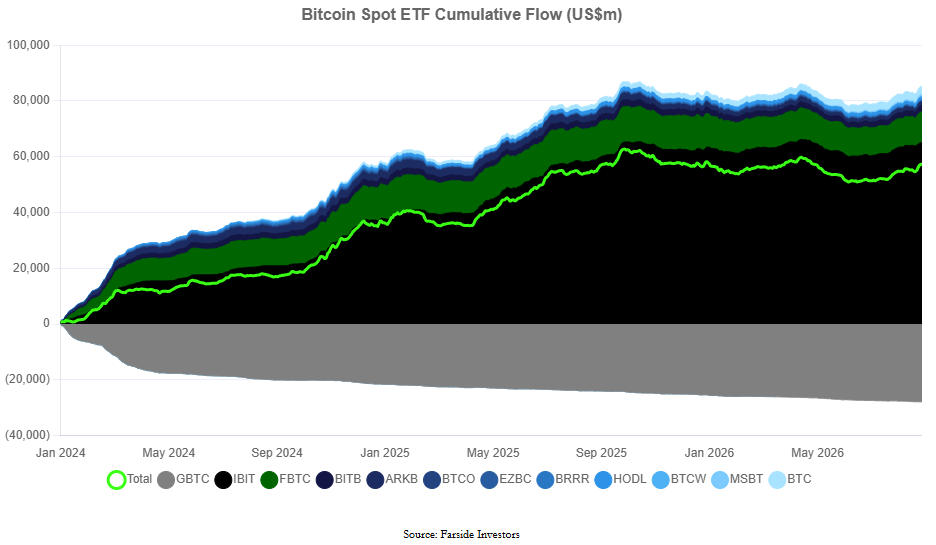
Beyond broad macroeconomic dynamics, a key theme supporting Bitcoin in recent years has been accumulation by large financial institutions and mom-and-pop investors. In addition to the growing popularity of firms accumulating the cryptocurrency as a treasury asset, we’ve also seen impressive inflows from “TradFi” institutional investors buying spot Bitcoin ETFs, with total inflows into Bitcoin ETFs near $57B, up nearly $4B over the last 3 months:
Source: Farside Investors
Broadly speaking, a renewed uptrend in Bitcoin ETF purchases should support the cryptocurrency, whereas a shift toward concerted selling could weigh on it.
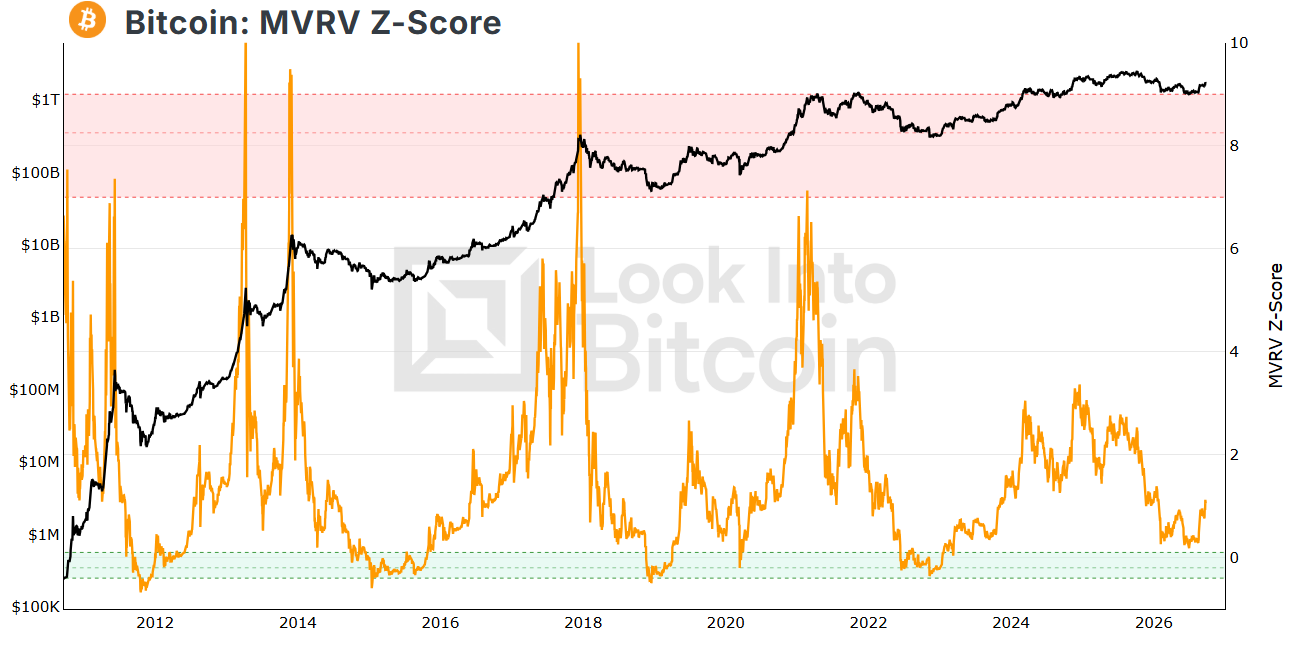
From a valuation perspective, the MVRV (Market Value to Realized Value) Z-score, which compares the current price to the price where each Bitcoin was last traded, has bounced to 0.8, closer to the typical bear market bottom zone at 0.0 than the late 2024 peak above 3.0:
Source: Look Into Bitcoin. Past performance is not indicative of future returns.
In a sign that Bitcoin is maturing as an investment and arguably, a new asset class, this valuation metric has become less volatile over time; for instance, the most recent peak never crossed 4, far from previous cycle peaks in the 7-10 range. Accordingly, there’s a reasonable case that it has already bottomed, despite not reaching the sub-0 levels that have historically marked bottoms. Time will tell whether this indicator remains a reliable measure moving forward.
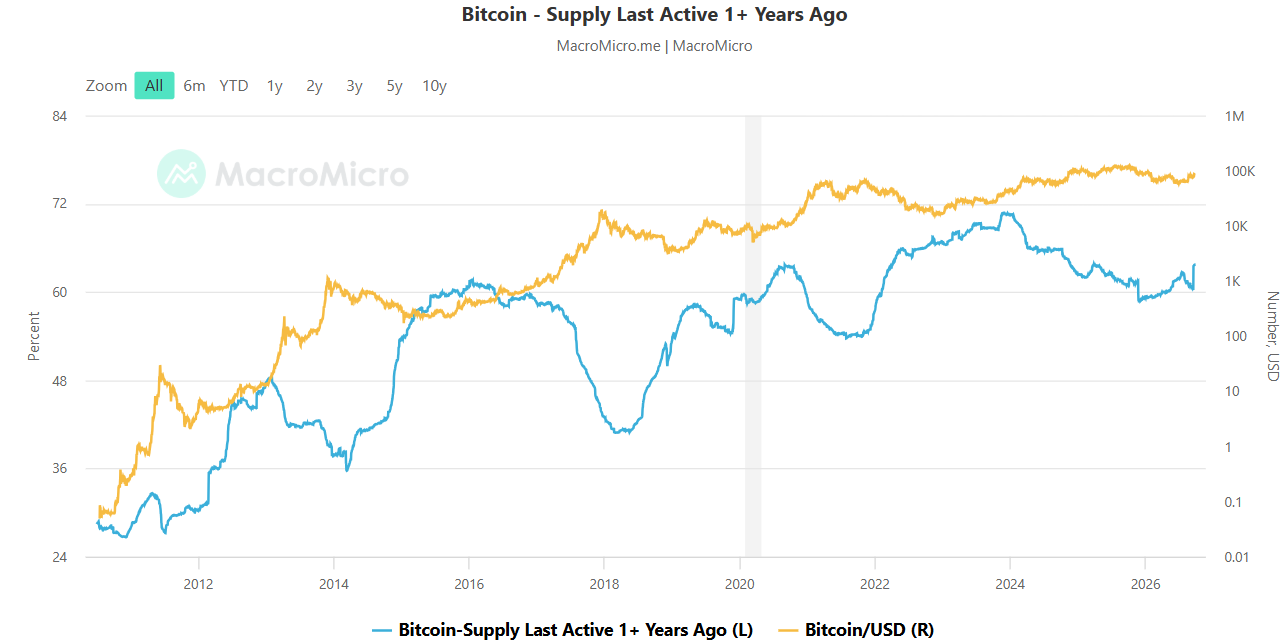
A final consideration is the behavior of long-term holders. As we’ve noted in previous outlooks, those who have held their Bitcoin for more than a year, almost tautologically, are not trying to make a “quick buck” off the cryptocurrency; rather they are more likely to be “true believers” or “HODLers” who are unlikely to sell unless they’re sitting on a truly massive gain.
As the chart below shows, the proportion of Bitcoin that has been held for at least a year has recovered off the late-2025 lows to rise back above 63% as of writing:
Source: MacroMicro.me
This measure, by definition, moves relatively slowly, but any renewed selling from longer-term “HODLers” may offset inflows into ETFs as we move through Q4.
Taking these diverse forms of analysis in totality, the outlook for Bitcoin in the fourth quarter is turning cautiously optimistic: Money supply growth remains in positive territory, albeit amidst a trend toward rising central bank interest rates, ETF purchases have revived along with long-term hodlers, and longer-term valuation measures remain compelling. These fundamental components combine with an improving technical picture (below) and a transition period in the 4-year halving cycle.
Of course, the catalysts we highlight in this report may not play out as expected – and to some extent, they may already be priced in, so readers should always exercise caution when trading Bitcoin and other cryptoassets. As ever, it will be critical to monitor a broad swath of macroeconomic and crypto-specific metrics as the year develops.
Bitcoin Technical Analysis – BTC/USD Weekly Chart
Source: TradingView, StoneX
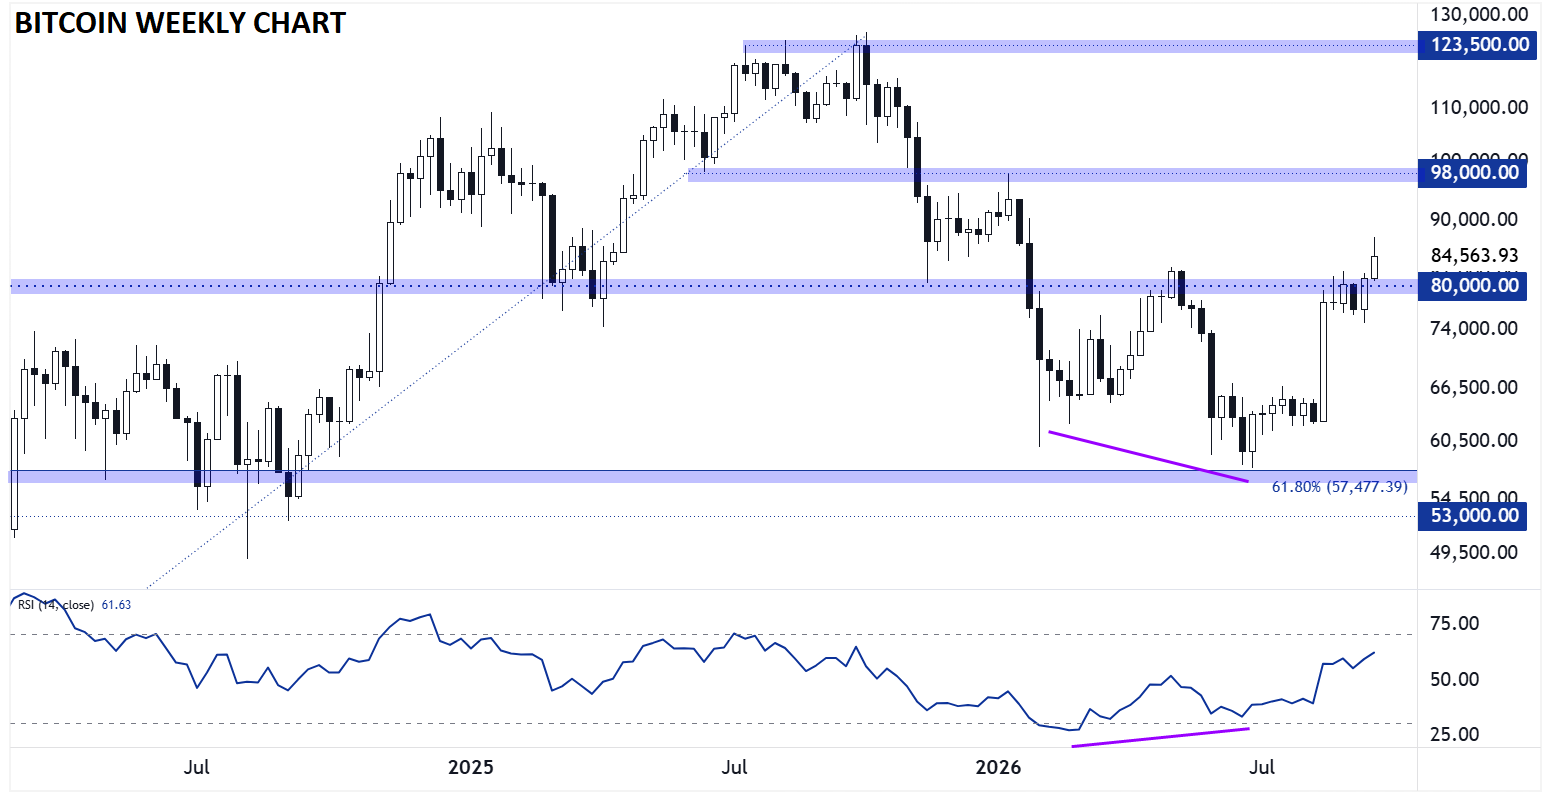
Looking at the longer-term chart, Bitcoin is trading near 8-month highs as of writing in late September. The cryptocurrency is also showing a large bullish divergence with its 14-week RSI; for the uninitiated, this setup forms when price makes a lower low, but the RSI makes a higher low, signaling waning selling pressure and a higher probability of a longer-term bottom forming.
While Bitcoin could absolutely make a new low under $60K, the balance of the risks is gradually shifting to the topside, with the near-term bias outright bullish above the $80K round handle for a potential extension toward previous-support-turned-resistance in the $98-100K range.
Meanwhile, a reversal back below $80K would flip the longer-term outlook back to neutral, with potential for a prolonged consolidation or retest of the $60K zone before a durable cycle bottom can ultimately form.
-- Written by Matt Weller, Global Head of Research
Follow Matt on Twitter: @MWellerFX
Latest market news










Web Trader platform
Our sophisticated web-based platform is packed with features.
Open an account today
Experience award-winning platforms with fast and secure execution.
Economic calendar
Related articles

Bitcoin Forecast: BTC/USD Back to $80K Ahead of Warsh’s Jackson Hole Speech
After surging over $15,000 in the past 10 days alone, there is risk of a near-term pullback if Warsh says anything remotely hawkish at Jackson Hole - what are the levels to watch from here?

Bitcoin, Gold Price Outlook: US CPI & Overbought Risks in Focus
Bitcoin, Gold Price Outlook Following a steep risk-on rally across US equity indices and precious metals, several major markets are approaching critical technical levels as momentum becomes increasingly stretched.


Bitcoin, Dow Jones Outlook: Dow Tests Major Resistance and Bitcoin Lags Below $67,000
Bitcoin, Dow Jones Outlook: Bitcoin remains below $67,000 while the Dow Jones tests major multi-year resistance. Key technical levels that could determine the next market move.