


US Dollar and Nasdaq Forecast: Fed, Microsoft, Meta, and Iran Talks in Focus
The US Dollar Index (DXY) continues to hold above the 101.00 mark, reinforcing its bullish structure, while the Nasdaq remains capped below the 29,000 resistance and its June-July consolidation range, reflecting cautious risk appetite ahead of the Federal Reserve's policy decision and major earnings releases on Wednesday.
Written by
Razan Hilal
Market Analyst
The US Dollar Index (DXY) continues to hold above the 101.00 mark, reinforcing its bullish structure, while the Nasdaq remains capped below the 29,000 resistance and its June-July consolidation range, reflecting cautious risk appetite ahead of the Federal Reserve's policy decision and major earnings releases on Wednesday.
Market participants remain focused on several key catalysts:
- US-Iran negotiations and developments surrounding the Strait of Hormuz
- Security guarantees for commercial shipping
- The FOMC policy decision on Wednesday
- Microsoft and Meta earnings reports following the US market close on Wednesday
These events could determine whether markets transition toward a risk-on or risk-off environment during the week. To quantify the uncertainties, key scenarios on the DXY and Nasdaq charts are mapped out.
DXY Price Outlook: Monthly Chart - Log Scale
Source: TradingView
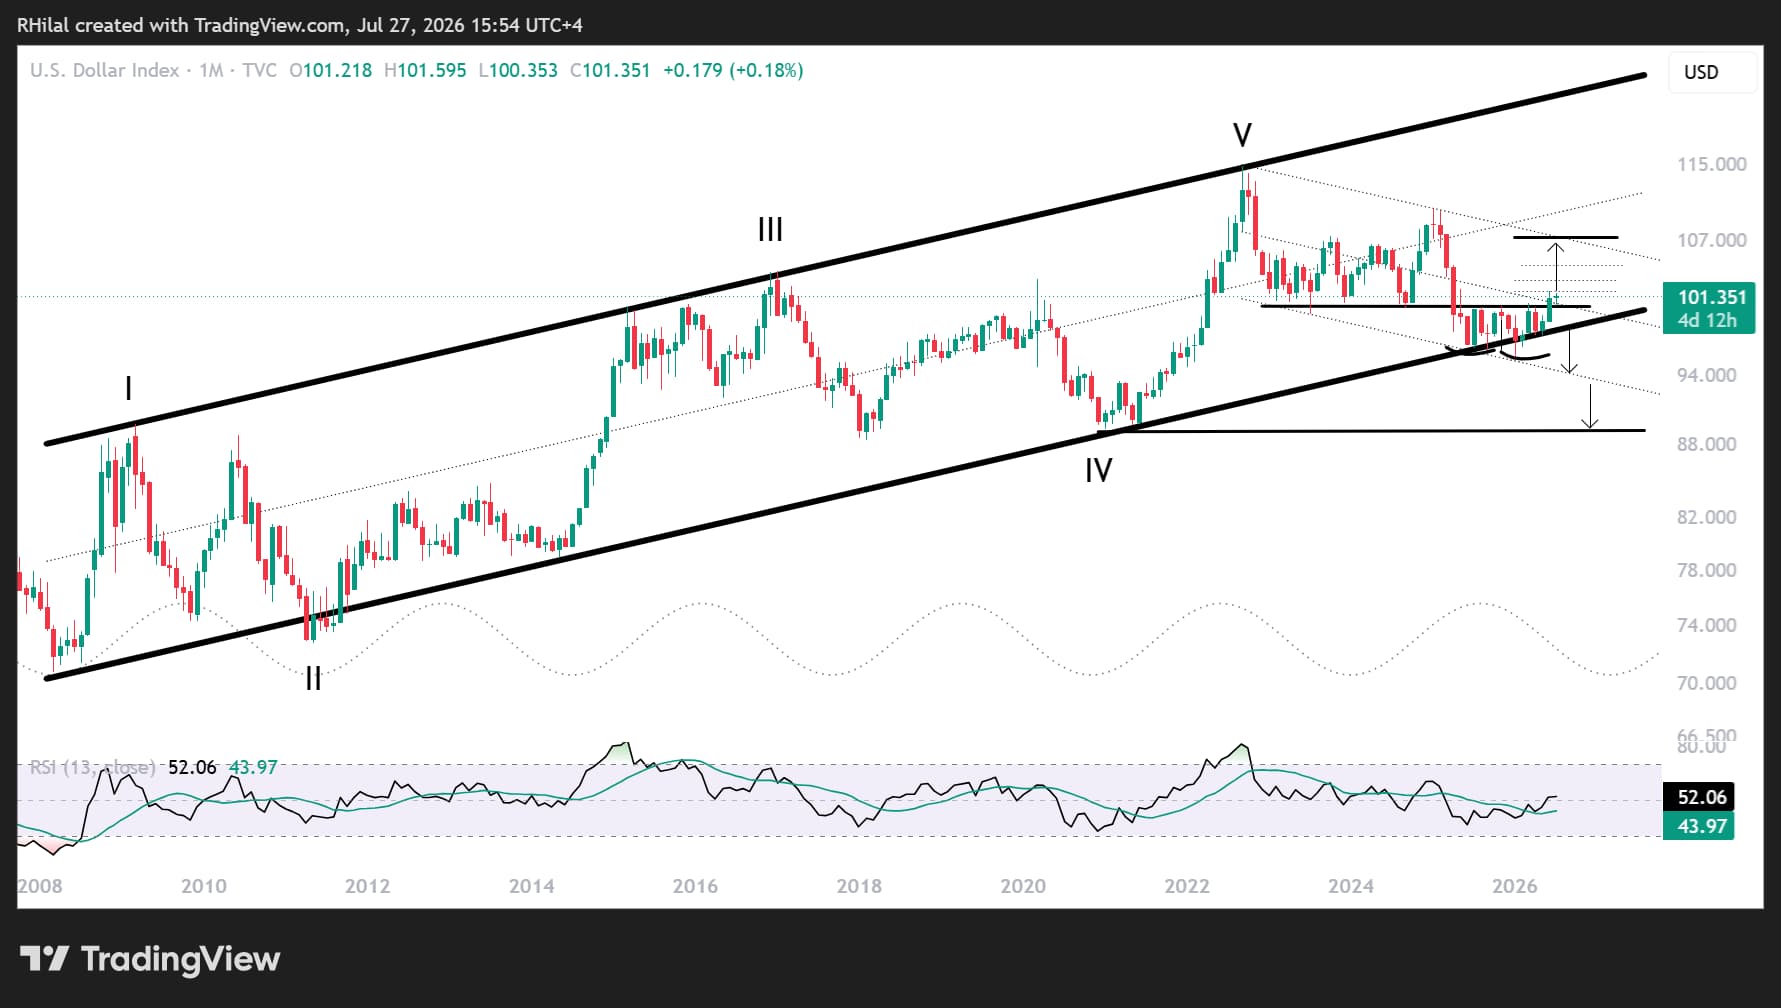
The monthly chart on the DXY shows that an ascending channel dating back to 2008 continues to support the Dollar Index's broader bullish trend. DXY is now testing a breakout above the neckline of a double-bottom pattern from the bounds of this channel, and a multi-year resistance zone that has alternated between support and resistance since 2023.
A monthly close above 102.00 would strengthen the bullish outlook, exposing resistance at 102.80, 104.50, and ultimately 107.00, which coincides with the upper boundary of the descending channel in place since 2022.
Such a move would likely coincide with renewed geopolitical tensions, stronger inflation pressures, or a more hawkish Federal Reserve outlook. It would also pressure currencies and metals to new yearly lows before a possible long term reversal.

On the downside, a break back below 100.30, followed by 99.30, levels defining an up trending support since January 2026, would invalidate the current bullish structure. Such a scenario would likely accompany easing geopolitical risks, improving risk sentiment, and renewed strength across major currencies and precious metals.
Nasdaq Price Outlook: Daily Chart - Log Scale
Source: TradingView
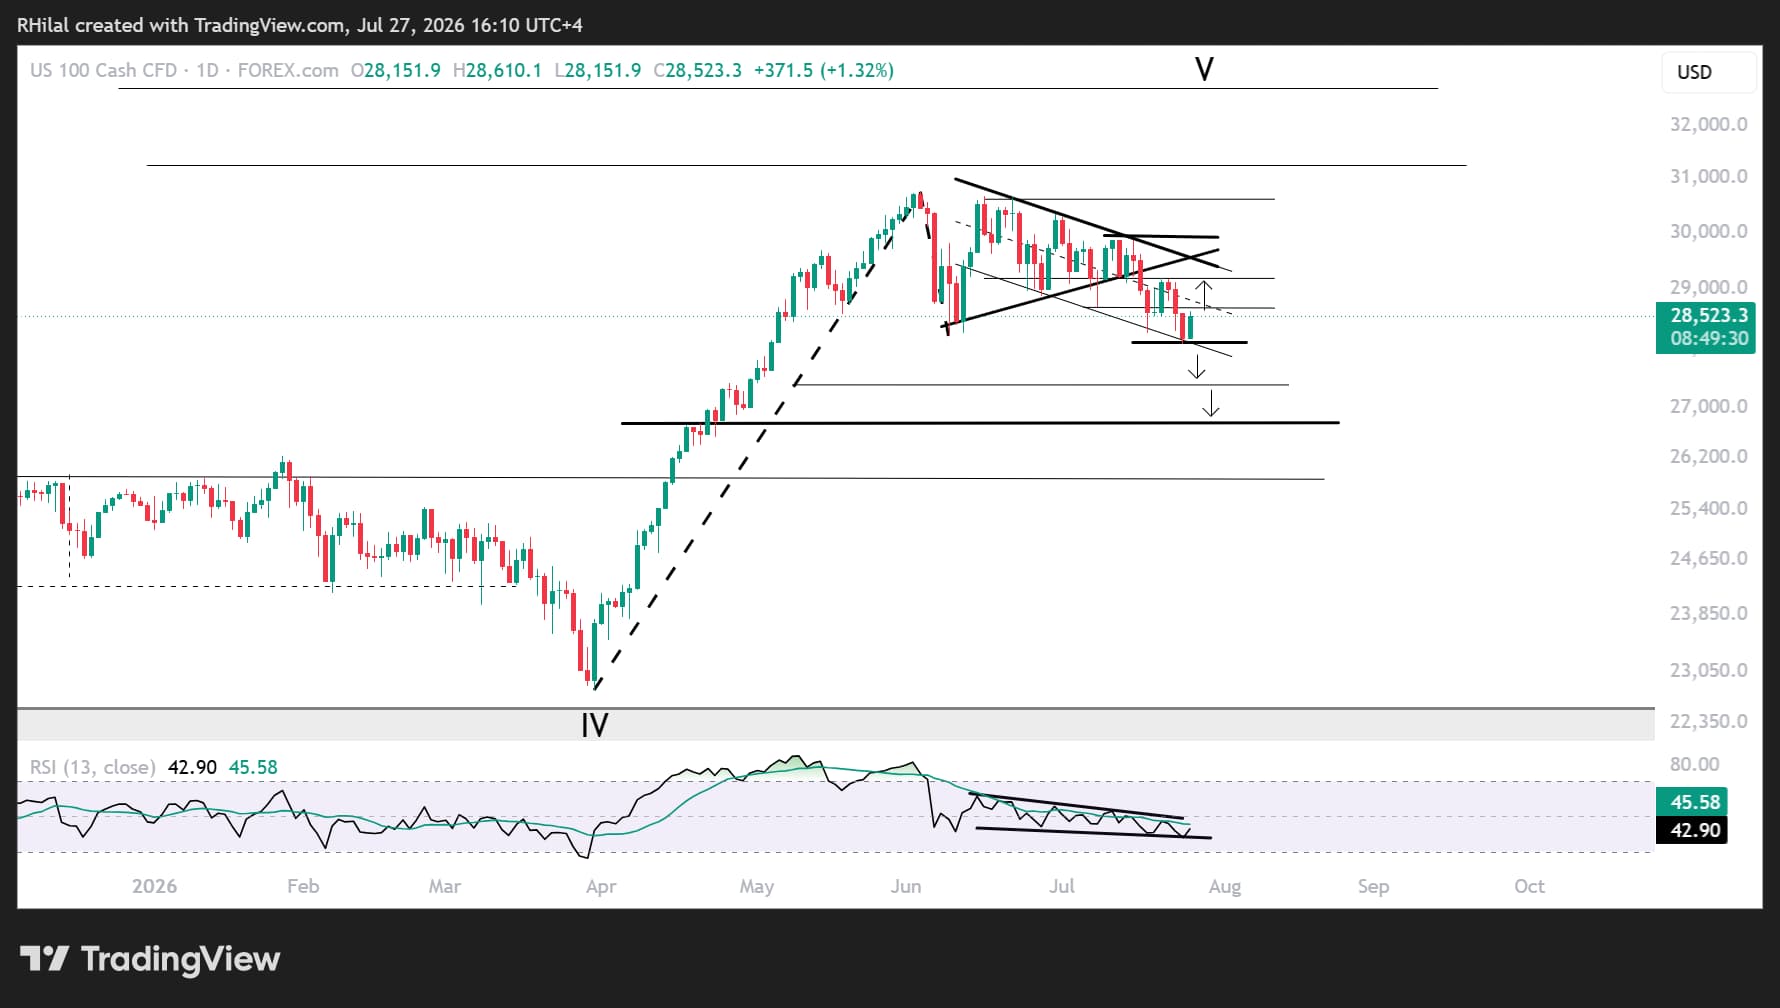
Nasdaq's daily time frame outlook remains cautiously bearish as price action continues to trade below both the June-July consolidation range and within the boundary of a descending channel extending from this year's highs. Momentum also remains subdued, suggesting that buyers have yet to regain control.
Bullish Scenario
To restore upside momentum, Nasdaq must first reclaim 28,600, followed by resistance near 29,100.
A sustained breakout above this zone would confirm renewed buying momentum and open the door for a retest of 29,800, before confirming fresh record highs near 31,100 and 31,700.
Bearish Scenario
Failure to hold 28,000, followed by a break below 27,700, would expose support at 27,300 and 26,700, representing the 38.2% and 50% Fibonacci retracement levels of the March-June rally.
These areas could present renewed buying opportunities, particularly if geopolitical tensions ease, crude oil prices stabilize, and the Federal Reserve delivers a less hawkish policy outlook.
Written by Razan Hilal, CMT
Follow on X: @Rh_waves
Related tags:







Web Trader platform
Our sophisticated web-based platform is packed with features.
Open an account today
Experience award-winning platforms with fast and secure execution.
Economic calendar
Related articles

Euro Short-term Outlook: EUR/USD Pullback Nears Pivotal Uptrend Support 8 28 2026
Warsh's comments accelerated the EUR/USD selloff, raising the stakes as buyers look to stabilize the broader recovery.


Nasdaq 100 Forecast: NDX slips ahead of Fed Chair Warsh’s speech
U.S. stocks are edging lower on Friday, giving back some of yesterday's gains after Nvidia's strong outlook revived the tech trade. The focus has now shifted firmly to Fed Chair Kevin Warsh's Jackson Hole speech, with investors looking for more clarity on the outlook for interest rates.


AUD/CAD breakout puts the Bradman barrier in sight
A bullish breakout has pushed AUD/CAD to its highest level since early 2021. Whether it can clear 0.9994 may determine if the move extends well above parity.
