


US Dollar Slips, but Gold Bulls Are Not Out of the Woods
The US dollar weakened after softer US CPI, but mixed futures positioning and fragile technicals suggest gold bulls still face significant hurdles.
Written by
Matt Simpson
Market Analyst
The US dollar retreated after softer-than-expected US inflation data sparked a risk-on move across financial markets, helping gold rebound from the key 4,000 support level. However, mixed futures positioning, rising short interest and a fragile technical backdrop suggest the precious metal's recovery may still face headwinds if the US dollar resumes its broader uptrend.
View related analysis:
US Dollar Weakens, but Gold Faces More Tests Ahead
Softer US inflation sparks risk-on rebound
Markets were handed a dose of risk appetite following a softer-than-expected US inflation report. All key metrics came in below estimates, with headline CPI falling 0.4% m/m (vs 0.1% forecast) and core CPI flat at 0.0% m/m (vs 0.2% expected). Annual inflation also eased, with headline CPI slowing to 3.5% y/y and core inflation to 2.6%.
US dollar weakens as traders reassess Fed outlook
Separately, President Trump scrapped his proposed 20% toll on shipping through the Strait of Hormuz, although the waterway remains closed by Iran for now. Together, these developments sent the US dollar sharply lower, making it the weakest major currency. NZD/USD and AUD/USD outperformed as they tracked Wall Street indices higher.
New Fed Chair Kevin Warsh also pledged to "do his job" on monetary policy despite pressure from President Trump during testimony before the House on Tuesday. That leaves incoming US economic data and geopolitical tensions in the Middle East as the primary drivers for the US dollar and, by extension, global markets in the near term.
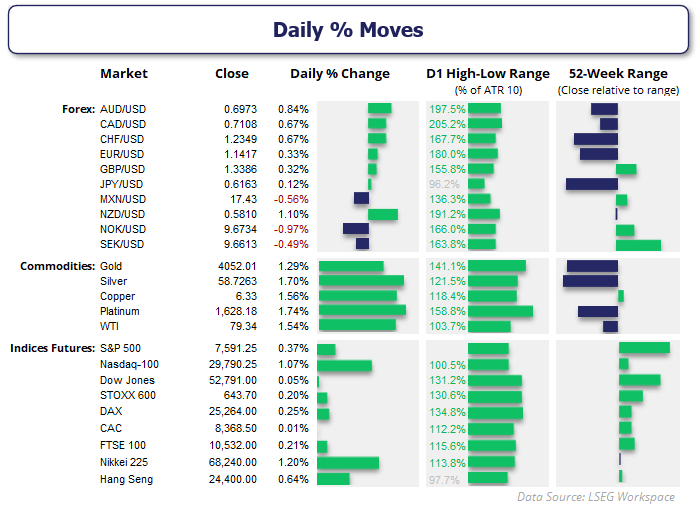
Source: LSEG
US Dollar Index (DXY) Outlook: Pullback Risk Grows Within Uptrend
I outlined a potential sentiment extreme for the US dollar in my weekly COT report, noting that futures traders were effectively short USD by nearly $40 billion—a 10-year high. While this weekly data does not necessarily mean a pullback is imminent, it is something to keep in mind as the rally matures. There are also other data points besides inflation to monitor, and while the soft CPI figures were welcome, they may not have been entirely unexpected given the recent decline in crude oil prices.
The daily chart shows a bearish engulfing candle (an outside day) on the US Dollar Index. Yet support emerged around the monthly pivot point before prices closed back above the 20-day EMA. Note that the 50-day EMA sits just below, which I suspect could provide decent support should prices pull back. And while the US Dollar Index remains in an uptrend, a move towards 102 could still be on the cards before a larger pullback materialises.
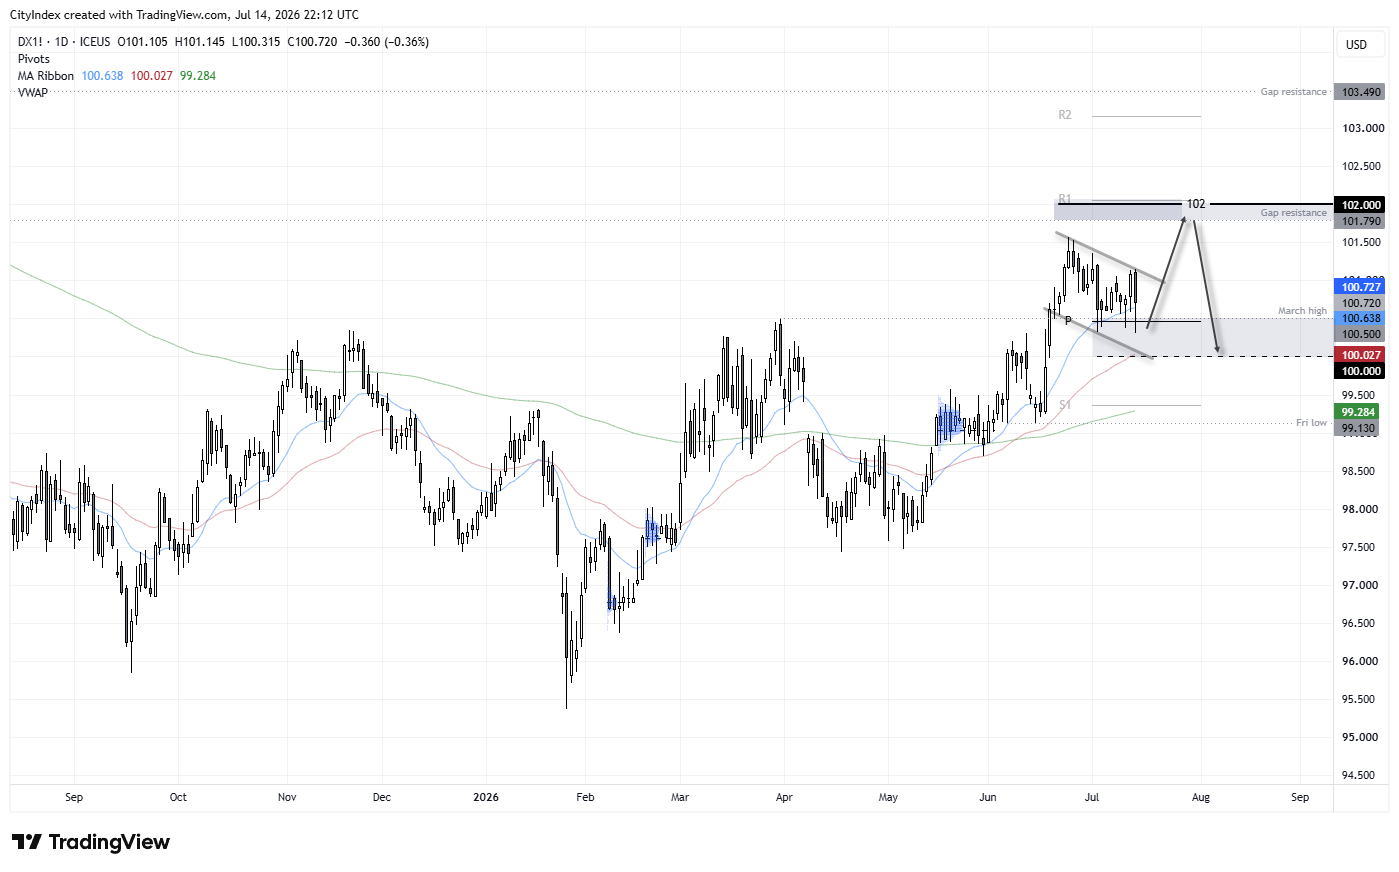
Source: ICE, TradingView

Gold Futures (GC) Market Positioning | COT Report
Net-long exposure has been rising in recent weeks in gold futures, although it no longer appears as bullish as it did two weeks ago. Large speculators increased net longs to a 23-week high of 194.5k contracts last week, primarily driven by an increase in long positions. Yet short positions are also picking up, reminding us that bears still lurk beneath the surface. That could keep a lid on gains without a fresh bullish catalyst specific to gold.
While gross shorts rose to a six-week high of 39.5k contracts, large speculators added 33k long contracts over the past six weeks, compared with an increase of 9.4k short contracts over the past five weeks. So it's not an all-out slam dunk for the bulls – who may want to tread with caution despite Tuesday’s post-CPI bounce.
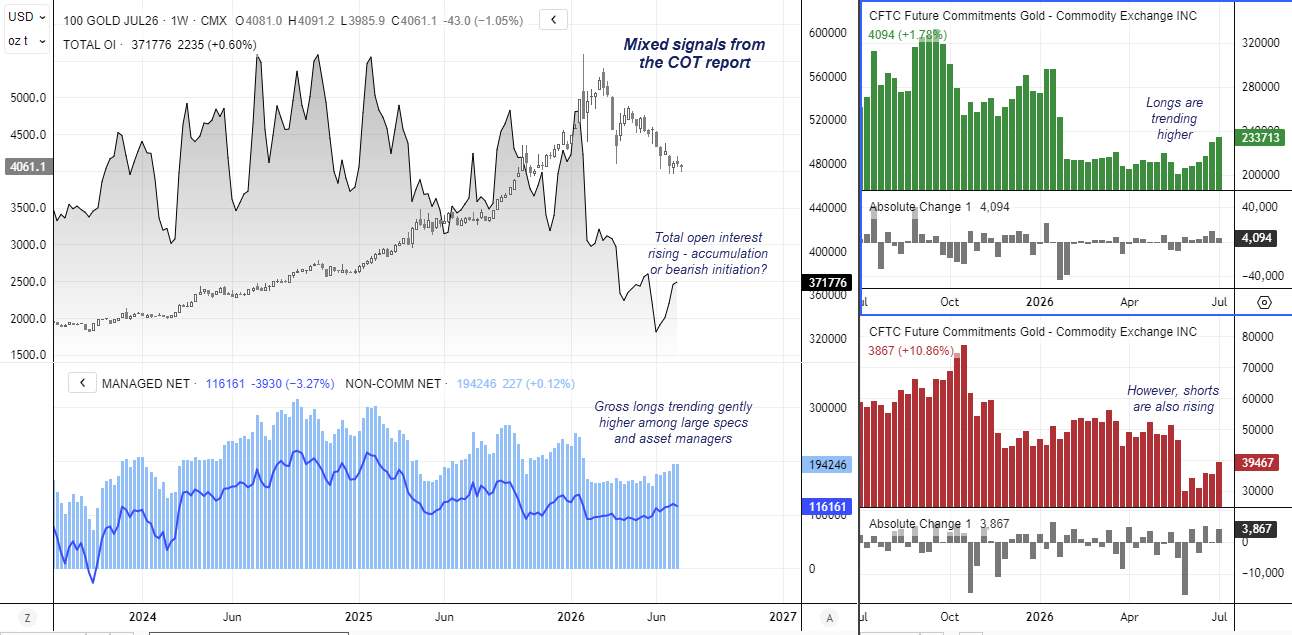
Source: COMEX, CFTC (COT), LSEG
For traders wanting a deeper understanding of futures positioning, I’ve also published a guide on how to read and interpret weekly COT data in forex markets.
Gold Futures (GC) Technical Analysis
I have twice called for a bounce from 4,000, and it looks as though gold is trying to rebound from this key level once again. A bullish piercing line pattern had formed by Tuesday's close after only a marginal intraday break below 4,000. Daily trading volume was above average and slightly higher than Monday's bearish session, suggesting bulls are still willing to defend support despite a weak US session.
Yet that last point is key. If I am correct in assuming that traders will continue buying dips in the US dollar index, with a move towards 102 before a more meaningful retracement unfolds, then upside potential for gold could remain capped. In that scenario, another break below 4,000 becomes increasingly likely.
The daily chart remains in a clear downtrend, even if prices are attempting to carve out a double bottom. Note that the monthly pivot point sits just below 4,200, making it a potential level for bears to fade into in anticipation of another break beneath 4,000. If bears regain control, the October low near 3,900 comes into focus. A break below there would expose the monthly S1 pivot around 3,800, followed by the September VPOC at 3,680.
I do not have strong conviction in those lower support levels just yet, but gold's lacklustre attempt to rally from 4,000 leaves me on guard for another test of 3,900.
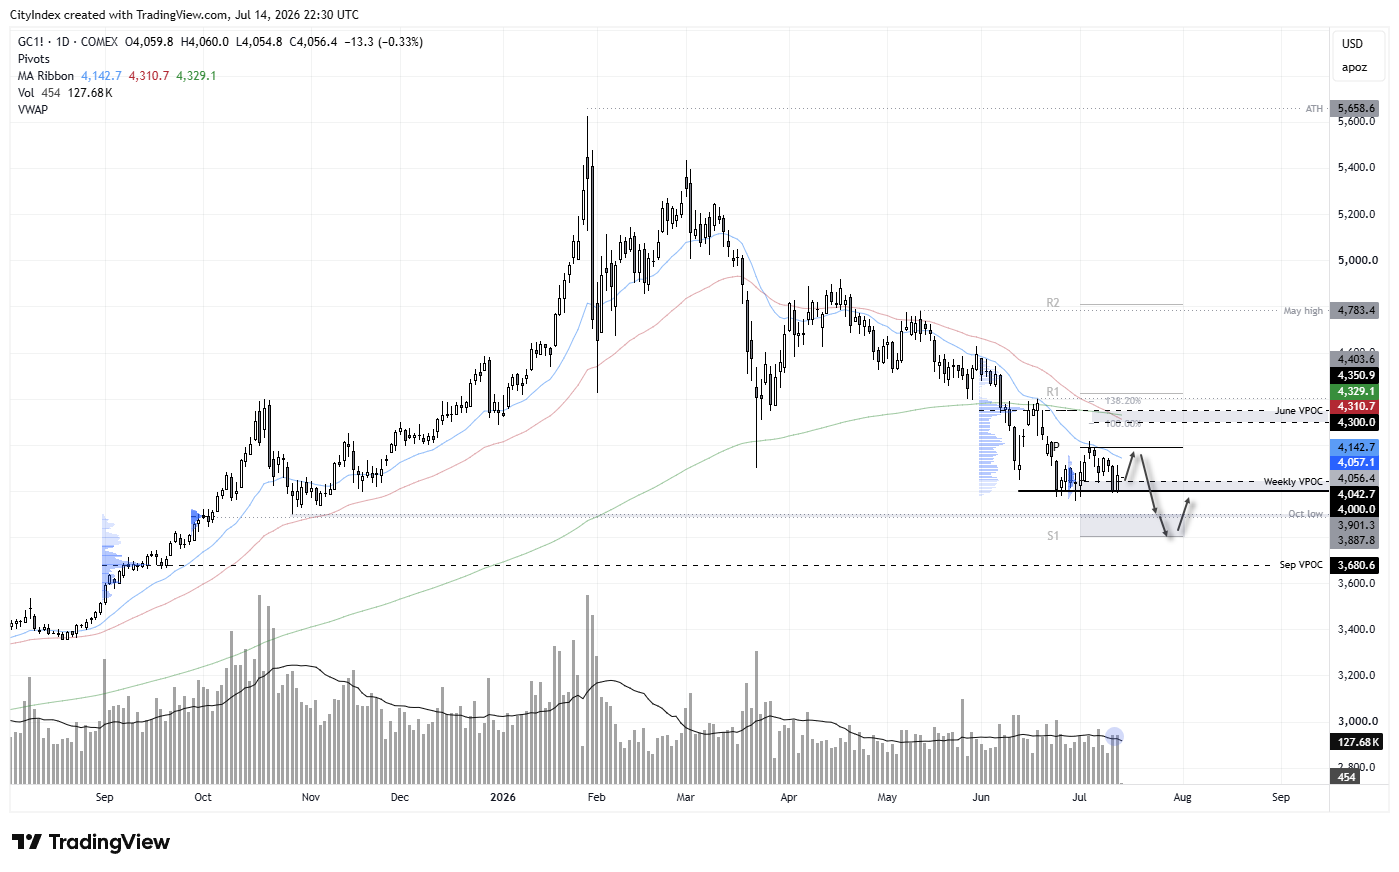
Source: COMEX, TradingView
View the full economic calendar
-- Written by Matt Simpson
Follow Matt on Twitter @cLeverEdge
How to trade with City Index
You can trade with City Index by following these four easy steps:
- Open an account, or log in if you’re already a customer
• Open an account in the UK
• Open an account in Australia
• Open an account in Singapore
- Search for the market you want to trade in our award-winning platform
- Choose your position and size, and your stop and limit levels
- Place the trade
Related tags:






Web Trader platform
Our sophisticated web-based platform is packed with features.
Open an account today
Experience award-winning platforms with fast and secure execution.
Economic calendar
Related articles

Euro Short-term Outlook: EUR/USD Pullback Nears Pivotal Uptrend Support 8 28 2026
Warsh's comments accelerated the EUR/USD selloff, raising the stakes as buyers look to stabilize the broader recovery.

Gold and S&P 500 analysis: What now after Warsh’s hawkish speech?
The dollar surged across the board after the Fed Chair Kevin Warsh surprised with a hawkish-leaning speech at the Jackson Hole summit. All the bearish dollar bets that had been accumulated since last Friday on the back of data weakness and bond market troubles had to be squared and that triggered a short squeeze rally for the dollar. Gold and silver dropped, as a result, as too did bitcoin, while US indices were giving back earlier gains.


EUR/USD forecast: All eyes on Warsh at Jackson Hole - Forex Friday
For much of this week, the EUR/USD has been edging lower with the US dollar regaining some ground after last week’s sell-off that was triggered, in part, by the bond market worries. Investors have been unwilling to bet further against the US dollar so far this week ahead of Kevin Warsh’s keynote speech at the Jackson Hole summit, due later today.