


Nasdaq 100 Bulls Seek Swing Low, Though COT Positioning Lacks Conviction
Nasdaq 100 futures are trying to establish a swing low, but COT positioning shows traders remain cautious despite improving technical signals.
Written by
Matt Simpson
Market Analyst
Nasdaq 100 futures are attempting to establish a swing low after a three-wave decline, with bullish technical signals emerging on the daily chart. However, the latest COT report reveals that both large speculators and asset managers have been reducing exposure rather than embracing the recent rebound, leaving the sustainability of any rally open to question.
View related analysis:
Nasdaq Futures (NQ) Market Positioning | COT Report
We’re seeing a mixed picture for the tech sector among Wall Street futures traders. Large speculators flipped to net-short exposure back in early May, although in recent weeks we’ve seen a notable decline in both long and short positions. This suggests large speculators are de-risking their Nasdaq futures exposure rather than simply betting aggressively against the index.
Meanwhile, net-long exposure among asset managers has fallen by around a third in just six weeks. However, the main driver has been the closing of gross long positions rather than a surge in short bets.
To me, this suggests traders remain cautious towards the Nasdaq around its record highs, but they are not outright bearish. The AI theme appears to be losing some of its sparkle, so it makes sense that some traders are questioning whether the index could see a pullback before attempting to break to fresh record highs.
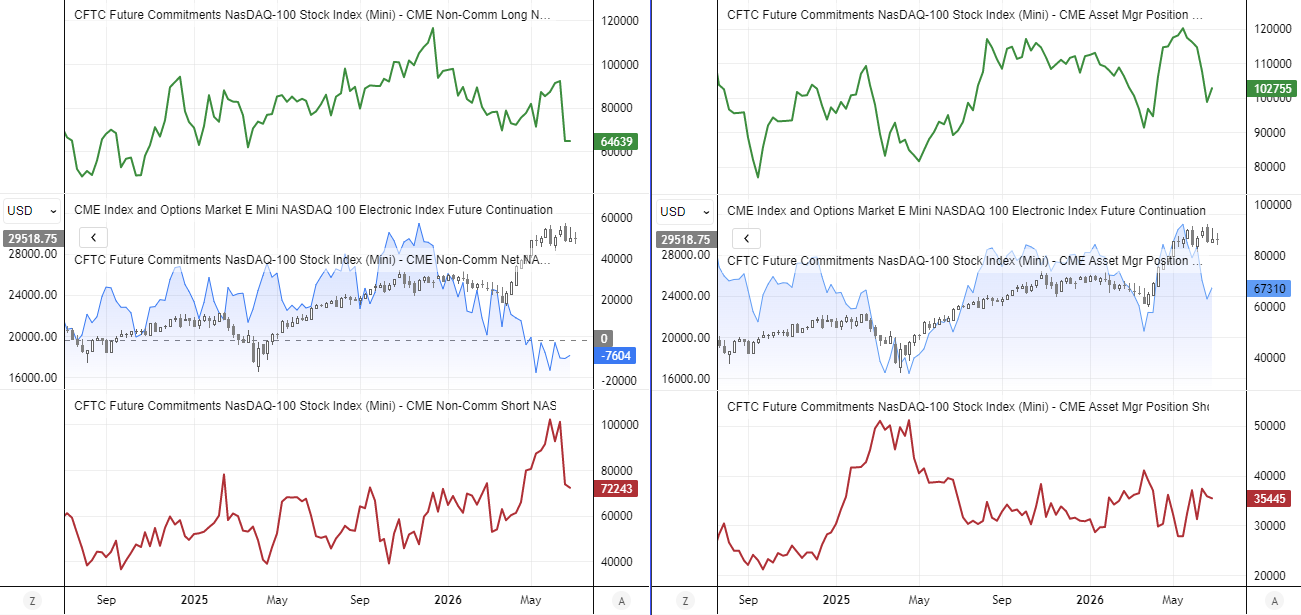
Source: CME, CFTC (COT), LSEG

Nasdaq 100 Futures Technical Analysis: Bullish Divergence Signals Potential Swing Low
Price action on the Nasdaq 100 futures chart has been choppy since it printed a double top just shy of the 31,000 record high. While bears have clearly had the upper hand, it appears we've now seen a three-wave move lower and the market is attempting to find support.
Note that a bullish pin bar formed on Wednesday, with its low holding above the monthly pivot point before closing above the 50-day EMA. The lower wick also pierced both the June 26 low and the 29,000 handle before prices closed back above them. Furthermore, the daily RSI (2) has formed a bullish divergence. This suggests a swing low may have formed, or that the Nasdaq 100 is close to establishing one.
The question now may be more about how high bulls can take the rebound, assuming they can at all. The monthly pivot point sits just below 30,000, making it a likely resistance zone over the near term. Beyond that, the swing high around 30,500 could also stymie an immediate retest of the record high without a genuine risk-on catalyst.
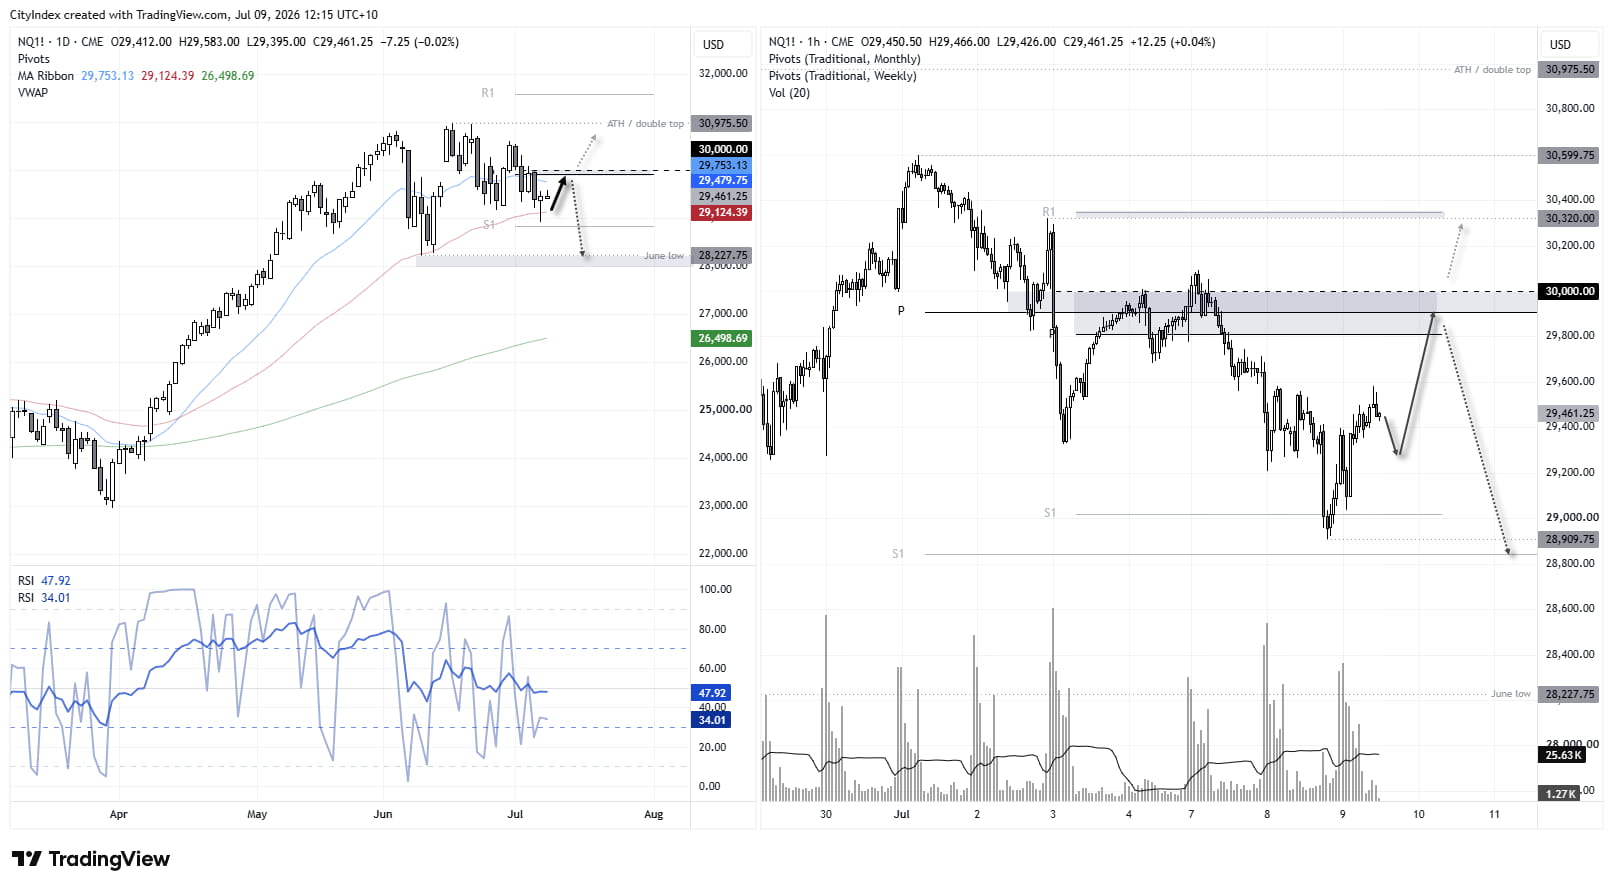
Source: CME, CFTC (COT), LSEG
Nasdaq 100 Futures (NQ): Low Volume Keeps Recovery in Check
The 1-hour chart shows that the recent volume spike occurred alongside a bearish candle, while volumes during the subsequent rally have remained subdued. This suggests the recent advance lacks strong conviction. Prices may retrace within yesterday's range, improving the risk-to-reward profile for bulls. The weekly pivot point at 29,800 and the 30,000 level appear to be viable upside targets, although traders should also be alert to the risk of bears fading any rally into those levels.
View the full economic calendar
-- Written by Matt Simpson
Follow Matt on Twitter @cLeverEdge
How to trade with City Index
You can trade with City Index by following these four easy steps:
- Open an account, or log in if you’re already a customer
• Open an account in the UK
• Open an account in Australia
• Open an account in Singapore
- Search for the market you want to trade in our award-winning platform
- Choose your position and size, and your stop and limit levels
- Place the trade
Related tags:







Web Trader platform
Our sophisticated web-based platform is packed with features.
Open an account today
Experience award-winning platforms with fast and secure execution.
Economic calendar
Related articles

Euro Short-term Outlook: EUR/USD Pullback Nears Pivotal Uptrend Support 8 28 2026
Warsh's comments accelerated the EUR/USD selloff, raising the stakes as buyers look to stabilize the broader recovery.


Gold and S&P 500 analysis: What now after Warsh’s hawkish speech?
The dollar surged across the board after the Fed Chair Kevin Warsh surprised with a hawkish-leaning speech at the Jackson Hole summit. All the bearish dollar bets that had been accumulated since last Friday on the back of data weakness and bond market troubles had to be squared and that triggered a short squeeze rally for the dollar. Gold and silver dropped, as a result, as too did bitcoin, while US indices were giving back earlier gains.


Nasdaq 100 Forecast: NDX slips ahead of Fed Chair Warsh’s speech
U.S. stocks are edging lower on Friday, giving back some of yesterday's gains after Nvidia's strong outlook revived the tech trade. The focus has now shifted firmly to Fed Chair Kevin Warsh's Jackson Hole speech, with investors looking for more clarity on the outlook for interest rates.
