

USD/CAD reversal risk builds ahead of tariff deadline
USD/CAD delivers bullish reversal signal just as a key US-Canada tariff deadline approaches. The outcome could determine whether the bearish trend extends or snaps back sharply.
Written by
David Scutt
Market Analyst
- USD/CAD reversal signal emerges near major support
- Tariff deadline creates clear binary risk
- Canadian data surprises have turned sharply higher
- Fed tightening expectations pared back; BoC hike fully priced
After a relentless unwind since early July, USD/CAD is showing signs that the bearish move may be losing momentum. A bullish reversal signal has emerged around a major support zone, just as a looming US-Canada tariff deadline presents a binary event capable of sparking renewed volatility in the pair.
Tariff Deadline Looms
US-Canada trade tensions are back in focus, with the two sides still trying to reach an agreement before the 19 August tariff deadline. The deadline dates back to 20 July, when the United States announced 50% tariffs on roughly US$20 billion of Canadian goods but delayed their introduction for 30 days, providing a window for negotiations. The immediate sticking points include autos, steel, dairy and other bilateral trade irritants, with talks still ongoing and renewed escalation remaining a clear near-term risk.
The outcome clearly matters for USD/CAD given the abrupt bearish move seen since the early parts of July. History suggests a negative outcome could spark some form of sizeable reversal higher. Of course, common sense suggests that binary risk should already be at least partly in the price, but as we all know, markets are not always efficient at pricing the future, especially when dealing with policy volatility generated by Donald Trump.
Canada’s Data Pulse Rebounds
Any reversal would be pushing against what has been a clear pattern of relative Canadian data outperformance compared with its neighbour to the south.
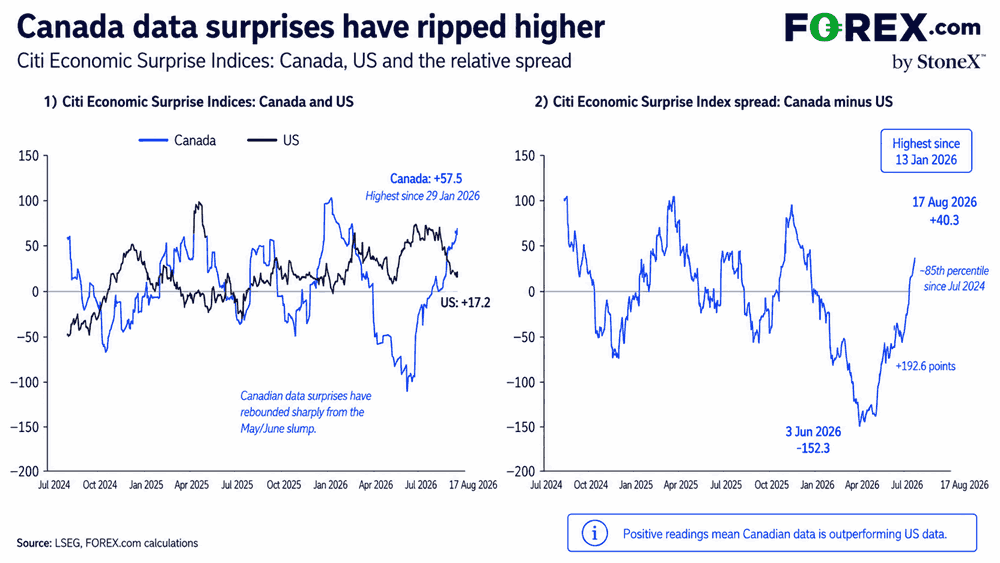
Source: LSEG, FOREX.com
You can see that in the graphic above which tracks Citi’s Economic Surprise Indices for the United States and Canada over the past two years. What stands out is that after a long period of outperformance, US data beats have dried up substantially over the past month. In contrast, Canadian surprises have moved from deeply negative to sharply positive over the past two months, pushing the relative spread between the two to levels not seen since the early parts of this year.
That improvement in the Canadian data flow has helped markets maintain expectations for a full Bank of Canada rate hike by year-end, even though underlying inflation remains relatively soft. In contrast, the recent run of US data undershoots has seen expectations for Fed tightening fall sharply, with the Fed funds futures curve implying just 21 basis points of tightening by the end of this year, down from more than 43 basis points at the end of July.
BoC Core Inflation Measures Stay Tame
Canada’s July inflation report delivered a string of upside surprises. Headline CPI rose 0.5% for the month, lifting the annual rate to 3.0%, two tenths higher than in June and one tenth above market expectations.
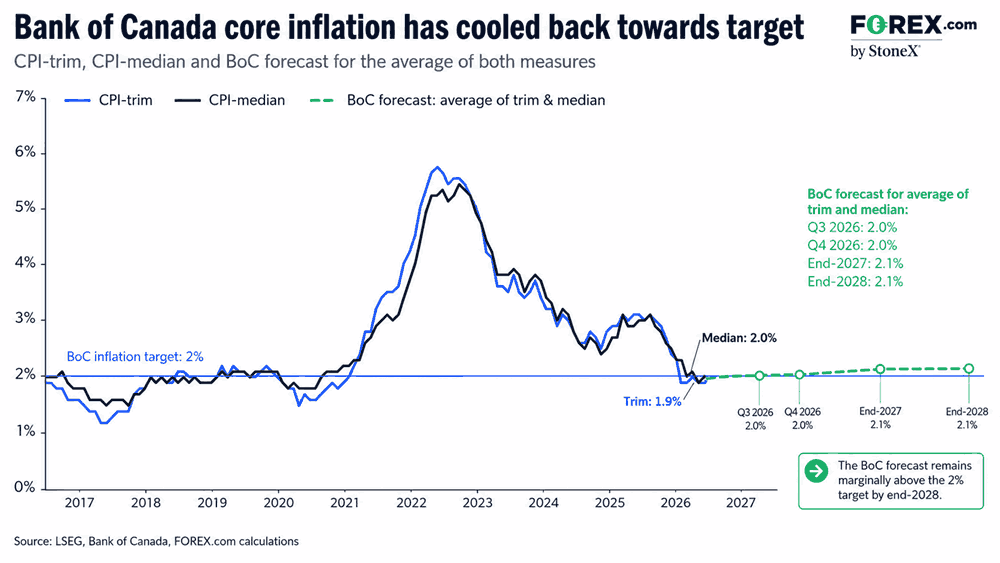
Source: LSEG, FOREX.com
More importantly, the average of the Bank of Canada’s median and trimmed mean measures edged up from 1.9% to 1.95%, broadly in line with the Bank’s 2% target. That was also marginally firmer than the 1.85% pace expected by markets.
Based on the Bank of Canada’s latest forecasts released in July, core inflation is expected to hold at or just above its 2% target through to the end of 2028.
Data Risks After Deadline
Looking ahead, Canadian upstream producer price inflation data will be released on Thursday, with retail sales data following on Friday, providing two notable releases for traders to consider after the tariff deadline.
In the United States, the focus will be the release of the FOMC’s July meeting minutes, with details on the breadth of hawkishness among the committee in focus after three regional Fed presidents voted in favour of a hike at the meeting.
The key question for Fed pricing, following the run of softer US data over the past week and a half, is whether the hawkish views of the dissenters were evident in a broader hawkish tilt across the FOMC.
USD/CAD Tests Major Support
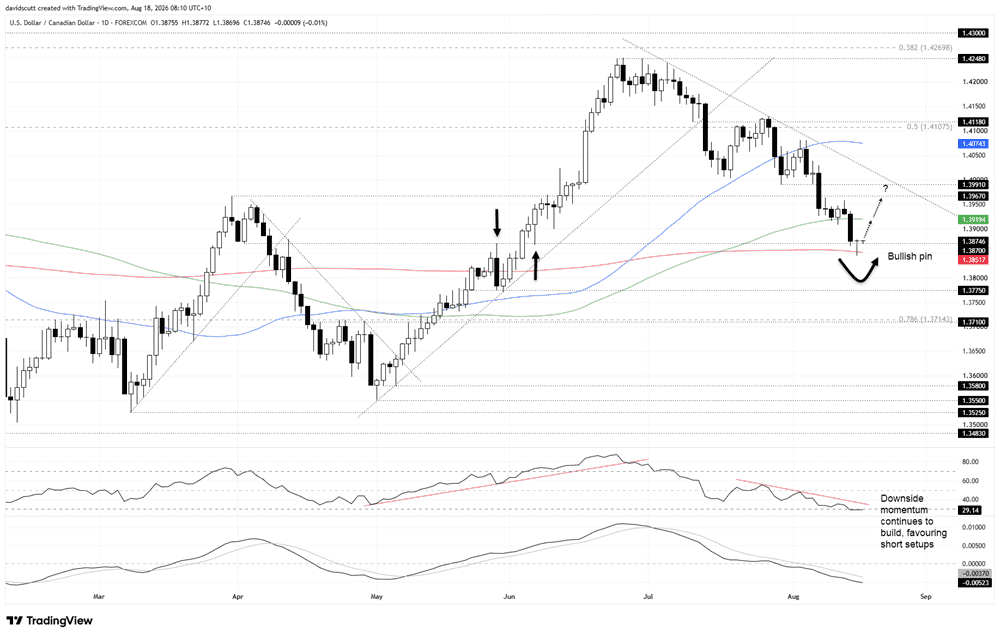
Source: TradingView
Looking at USD/CAD on the daily chart, it is clear the pair remains in a strong downtrend, setting a string of lower highs and lower lows since topping in late June, culminating in a retest of the 200-day moving average on Monday. After initially trading beneath the level, the move failed to stick, with the pair reversing back above both the average and 1.3870, a level that has acted as support and resistance at various points this year, ultimately delivering a bullish pin candle. Coming after such a pronounced bearish move, the reversal pattern warns that upside risk may be starting to materialise ahead of the tariff announcement.
Overhead, the 100-day simple moving average at 1.3919 is the first focal point, with the pair testing and bouncing from the level on multiple occasions in recent weeks before resuming its move lower. A break above would bring potential retests of 1.3967 and 1.3991 onto the table.
If the bullish reversal signal fails to deliver, the support zone between 1.3870 and the 200-day moving average looms as particularly important. A break beneath the 200-day would open the door for an extension of the bearish move towards minor support at 1.3775, followed by the 78.6% Fibonacci retracement of the September 2024 to February 2025 bull move, a level that acted as resistance for lengthy periods earlier this year.
The message from the oscillators is in direct contrast to the price signal. RSI (14) continues to set lower highs and lower lows and is now sitting marginally in oversold territory at 29, indicating downside momentum remains strong. MACD confirms the message, continuing to trade below its signal line in negative territory.
For now, the momentum picture favours selling into strength. The reversal signal warns of upside risk, making Tuesday’s price action important in determining which signal ultimately wins out.
Related tags:
Latest market news










Web Trader platform
Our sophisticated web-based platform is packed with features.
Open an account today
Experience award-winning platforms with fast and secure execution.
Economic calendar
Related articles

EUR/USD forecast: All eyes on Warsh at Jackson Hole - Forex Friday
For much of this week, the EUR/USD has been edging lower with the US dollar regaining some ground after last week’s sell-off that was triggered, in part, by the bond market worries. Investors have been unwilling to bet further against the US dollar so far this week ahead of Kevin Warsh’s keynote speech at the Jackson Hole summit, due later today.


Bitcoin Forecast: BTC/USD Back to $80K Ahead of Warsh’s Jackson Hole Speech
After surging over $15,000 in the past 10 days alone, there is risk of a near-term pullback if Warsh says anything remotely hawkish at Jackson Hole - what are the levels to watch from here?


DAX and EUR/USD forecast: Lower energy prices, yields offer support
But the question, of course, is how much further oil prices and bond yields can fall. For now, the combination is supportive of risk assets and is helping to sustain a relatively benign decline in the dollar. The focus today will be on US core PCE inflation, due for release shortly, while Nvidia’s second-quarter earnings will provide another test for risk appetite after the US markets close – not just for US indices but for global tech-heavy indices given the influence Nvidia has over the global tech and AI names.