


USD/JPY Bulls Continue to Push as Markets ‘Bet Against the House’
USD/JPY is now up by more than 500 pips from the low taken the day that Scott Bessent taunted markets, saying ‘you can bet against me if you want.’
Written by
James Stanley
Sr. Strategist
USD/JPY Talking Points:
- USD/JPY continues to rally and with another jump in Treasury yields today that short-term trend has continued.
- This is also driving the USD-higher against many other currencies as EUR/USD and GBP/USD have both moved into oversold conditions on the daily chart.
- The question now is whether we’ll get an entrance from policymakers in the form of a threat or perhaps even an actual intervention, although for the latter we would probably need to see the pair push closer to the 160 handle.
It was unusual to hear a sitting US Treasury Secretary openly taunt markets, and at this point, it hasn’t worked out too well for Scott Bessent. While the comment saying ‘you can bet against me if you want’ in relevance to the Japanese Yen landed when the USD/JPY pair was near lows, the day of the actual comment the pair held a higher-low and in the two week since, it’s rallied by more than 500 pips from that point.
One of the items that Bessent spoke of, saying that he knew what the Bank of Japan was going to do, didn’t seem to produce much. While Ueda did take time in providing explanation over last week’s rate hike, he failed to give any timelines. And with Japanese inflation already below the bank’s 2% target, even as US inflation continues to flare and the Fed has forecast another rate hike by the end of the year, and much like we saw for the month of August, following a sweeping sell-off, buyers have jumped back in at progressively higher-lows although this time, the angle of the trend is even more aggressive.
USD/JPY Four-Hour Price Chart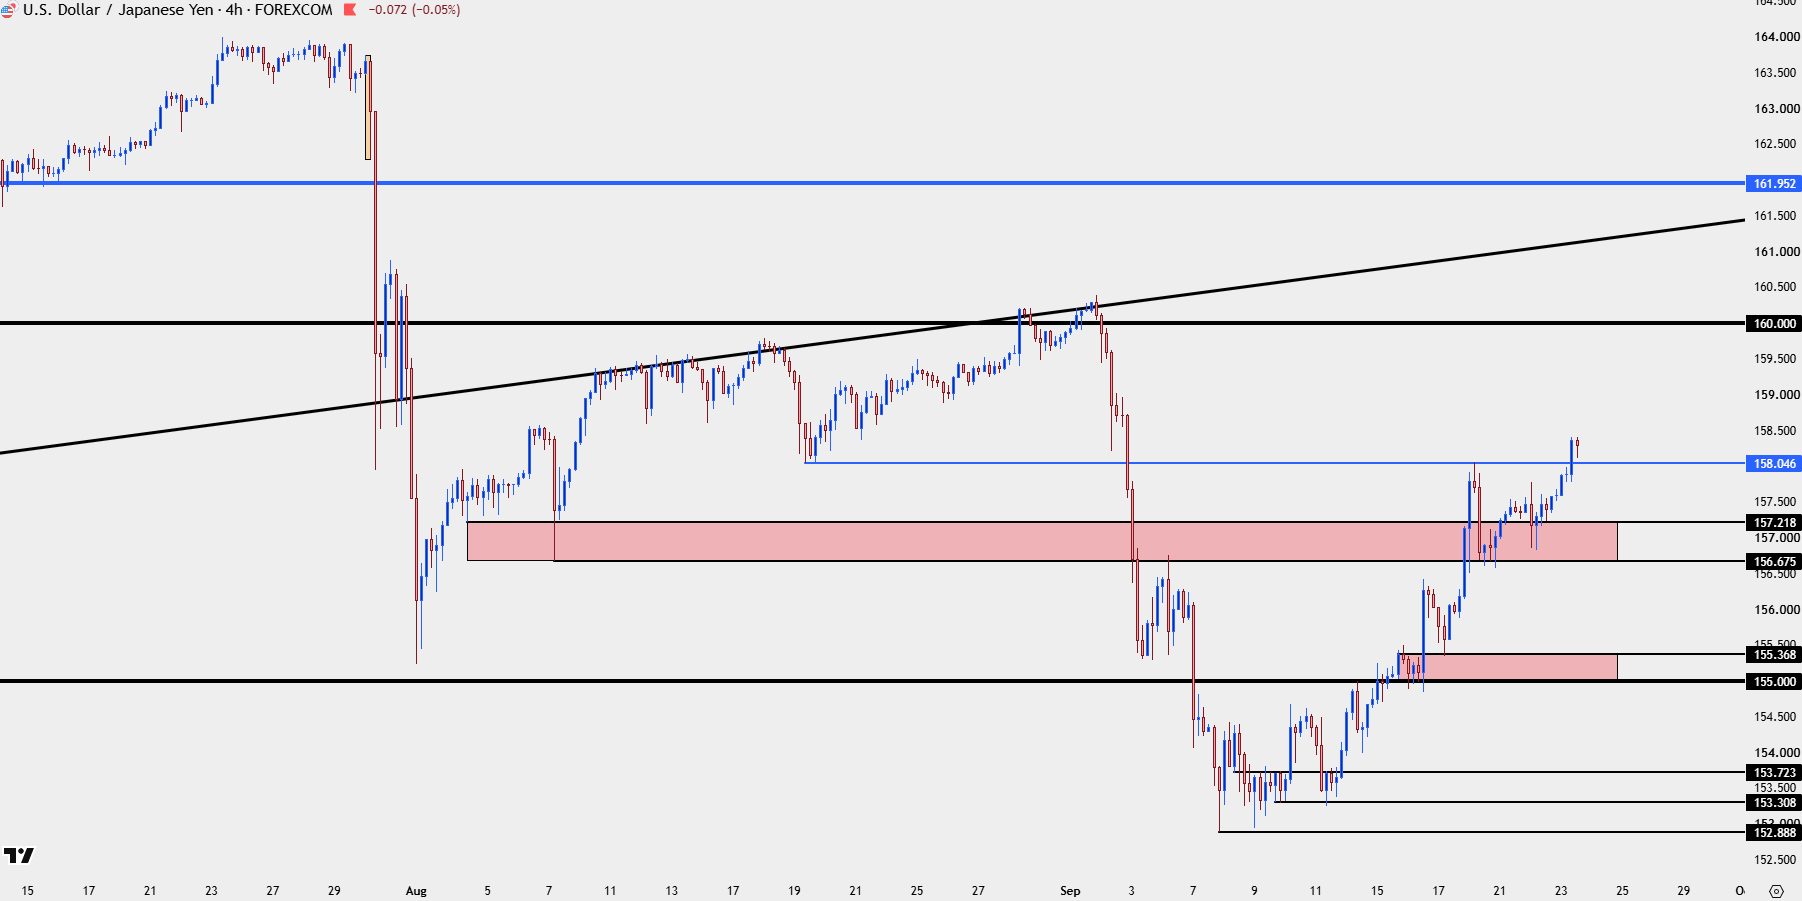
Chart prepared by James Stanley; data derived from Tradingview
USD/JPY Bulls Are Getting Bold
While the dual intervention in late-July brought a strong sell-off in the pair, given the rise in yields along with a Bank of Japan that didn’t really do much outside of the already expected rate hike, bulls have been getting increasingly bold.
Last week – the support at 155 was pounced on around the FOMC meeting, leading to a breakout up to resistance at prior support of 158.05. That pullback ran cleanly down to another prior swing, 156.68, which held as support into the end of last week and through this week’s open.
And then as looked at in yesterday’s webinar, another pullback had shown but that too has since led to a continuation move and fresh high. At this point, both 158.05 and 157.78 serve as higher low support potential, followed by 157.22.
USD/JPY Four-Hour Chart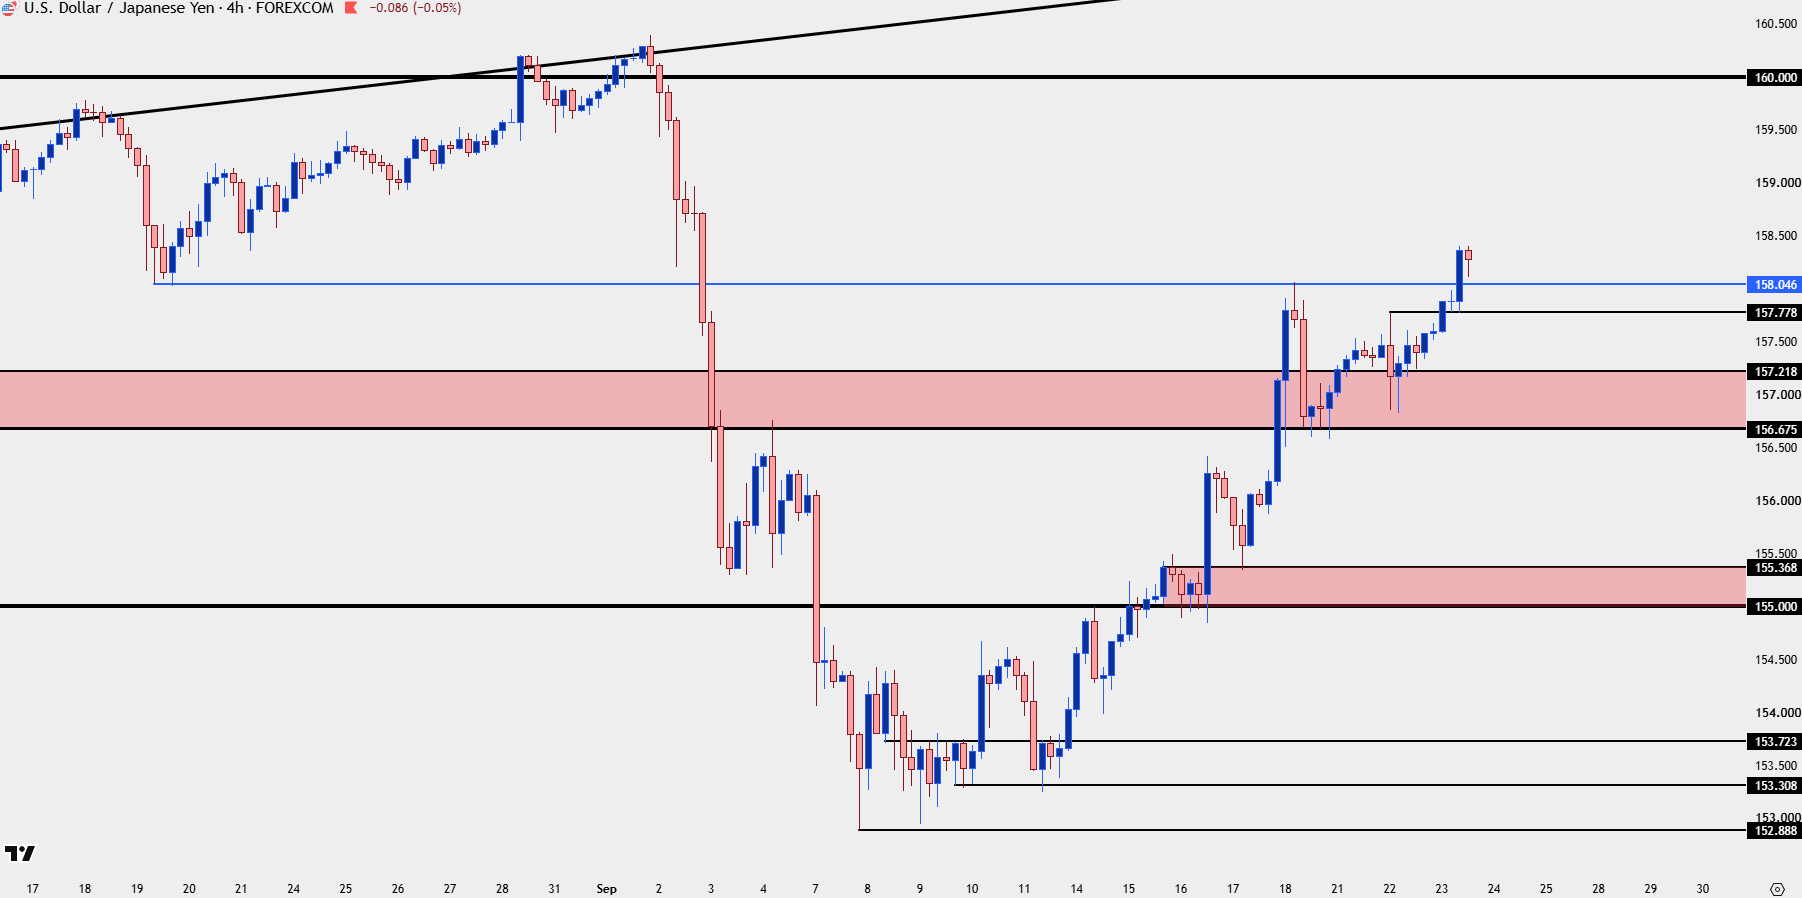
Chart prepared by James Stanley; data derived from Tradingview
Whether the enthusiasm continues unabated through the 160.00 handle remains to be seen, however, as we can see from the prior instance that played out through August and into September, that big figure is a spot with some historical importance. This was the price defended by the Bank of Japan back in April of 2024. That intervention failed miserably, as weakness held for about a week, with buyers jumping back in and then ultimately driving up to 160 again in July. The intervention in July of that year, however, worked out considerably better because it was paired with softer US inflation print, which finally gave markets the assurance that a US rate cut was on the way.
And this really highlights the bane of the problem – with fundamental forces in the shape that they’re in, longer-term bulls that have been holding from 120 or 130, whether it’s retail traders or hedges – don’t have that level of fear that’s driving them to throw in the towel.
And on that front, it was the five-year trendline that came into play two weeks ago, and then again last week, to hold support when USD/JPY was selling off. This simply highlights that while the past two months have been driven by sizable sell-offs, there’s still positive carry on the long side of the pair and until the prospect of that shifts, there’s a reason for bulls to jump in after pullbacks, much as we’ve seen.
USD/JPY Weekly Chart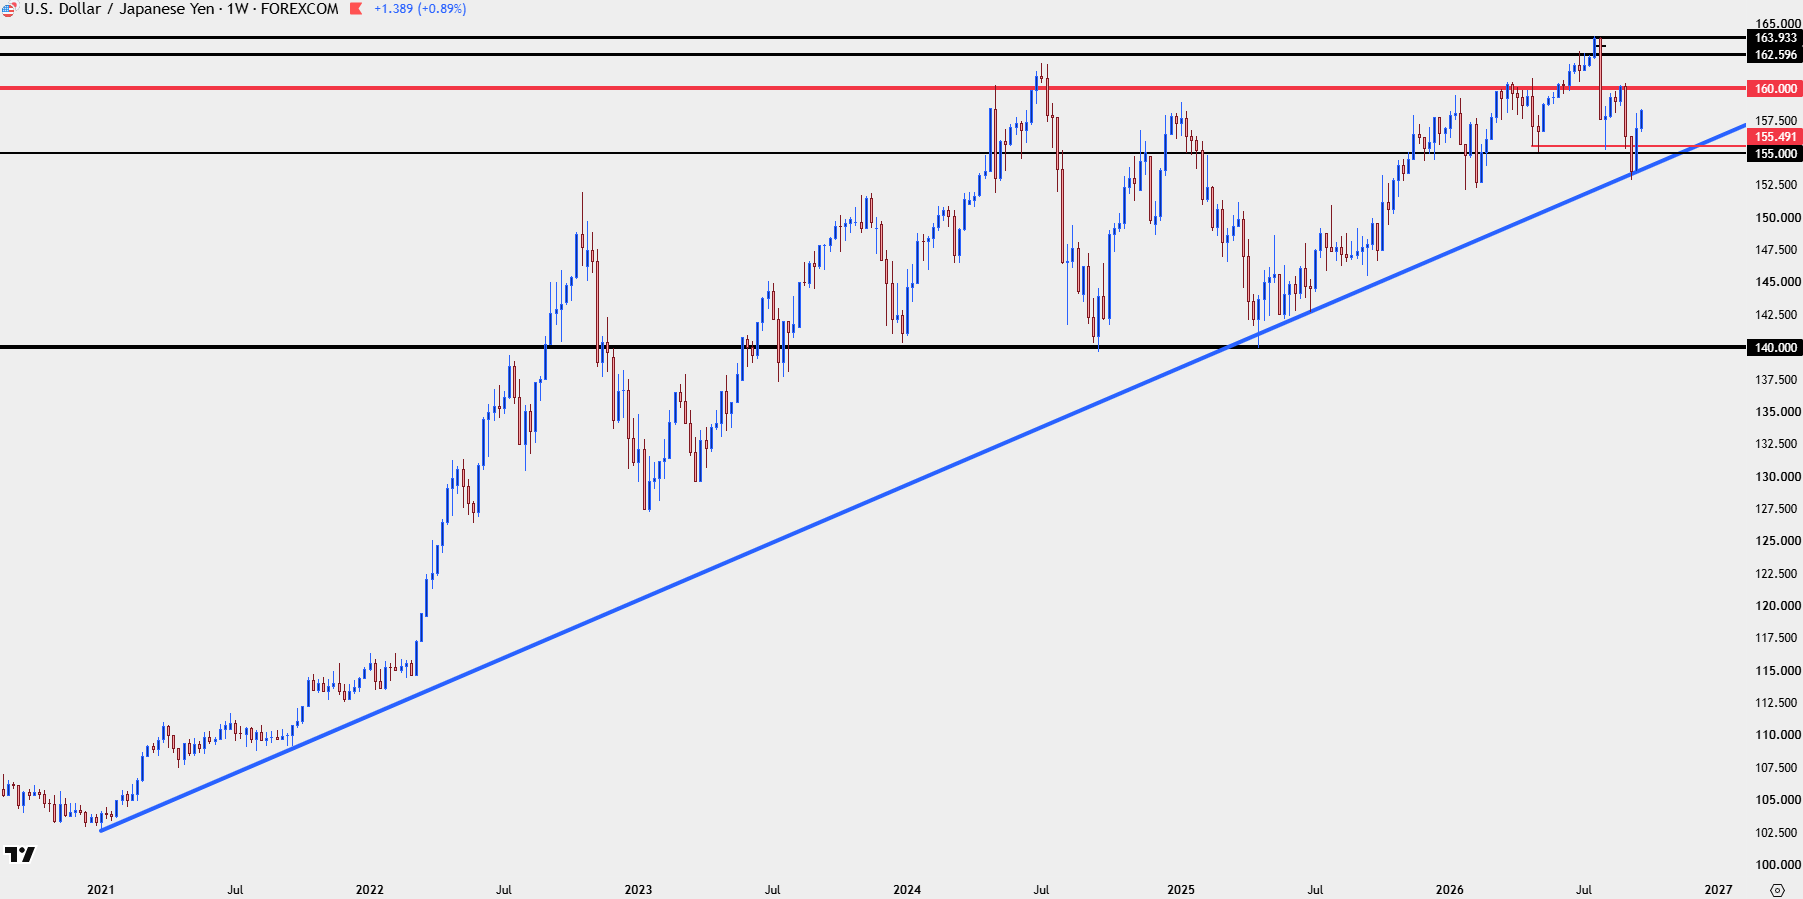
Chart prepared by James Stanley; data derived from Tradingview
--- written by James Stanley, Senior Market Analyst, Global Macro
Related tags:
Latest market news










Web Trader platform
Our sophisticated web-based platform is packed with features.
Open an account today
Experience award-winning platforms with fast and secure execution.
Economic calendar
Related articles

FX Futures Positioning: USD Falls, CAD Strengthens, JPY Shorts Return | COT Report
USD weakness, rising CAD demand and renewed JPY shorts shape this week’s COT report ahead of Jackson Hole.


USD/JPY weekly outlook: Bessent, Warsh and a very confused curve
Treasury is fighting market forces just as Warsh wants them to do more of the work. The battle over who sets long-term borrowing costs could be the defining driver for USD/JPY this week.

Japanese Yen Outlook: Firmer CPI Fails to Lift JPY
Japan CPI strengthened the case for a September BOJ hike, yet the yen remains weak as traders weigh intervention, yields and higher oil prices.