

USD/JPY weekly outlook: Bessent, Warsh and a very confused curve
Treasury is fighting market forces just as Warsh wants them to do more of the work. The battle over who sets long-term borrowing costs could be the defining driver for USD/JPY this week.
Written by
David Scutt
Market Analyst
- US yields remain the dominant driver for USD/JPY
- Bessent’s buybacks fail to calm the long end
- Warsh heads to Jackson Hole looking boxed in
- Payroll benchmark revision adds to Friday event risk
- 158 and 159.78 define immediate USD/JPY range
The Japanese yen notched up a rare win against the US dollar last week, aided by the very same forces that have contributed to its persistent weakness over recent years.
Attempts by the US Treasury to limit the rise in long-dated US bond yields weighed on the dollar initially. However, old habits die hard. With Treasury yields backing up again in the latter part of the week, widening yield differentials with Japan, the historic relationship between yield spreads and USD/JPY kicked back into gear.
Given how dominant that relationship remains, anything that materially moves US borrowing costs, particularly further out the curve, could be extremely influential this week.
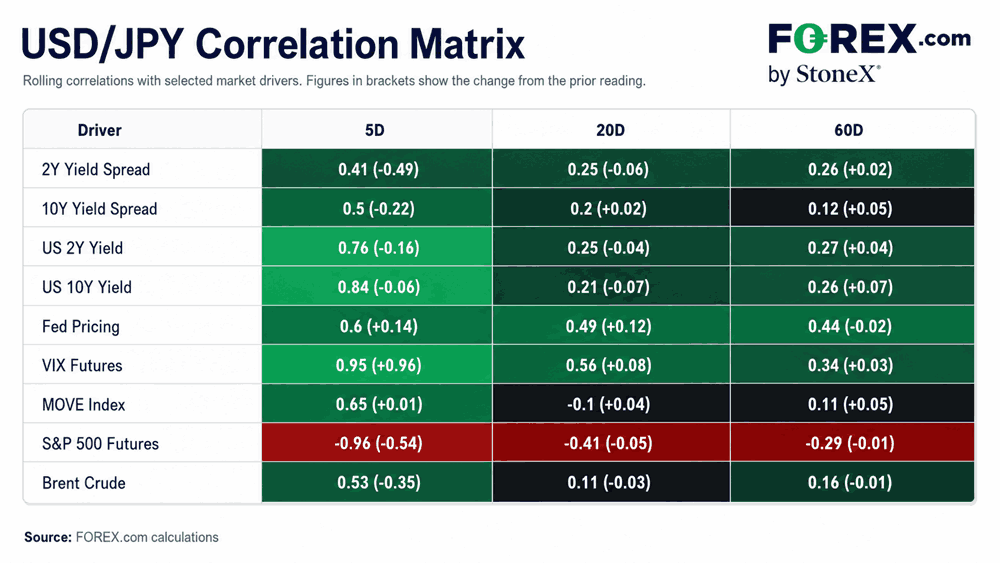
The matrix below underlines that point.
US curve calling the shots
Source: TradingView, FOREX.com
Over the past five days, USD/JPY has had a 0.76 correlation with the US two-year yield and an even stronger 0.84 relationship with the US 10-year yield. That compares with correlations of just 0.41 with the two-year US-Japan yield spread and 0.50 with the 10-year spread, suggesting the main show in town right now is what is happening in US borrowing costs.
Fed pricing still matters too, with correlations of 0.60 over five days, 0.49 over 20 days and 0.44 over 60 days. Expectations for further Fed tightening ticked higher on Friday, with around 24 basis points of hikes priced by year-end, the most in close to a fortnight. Higher energy prices remain one factor feeding that repricing at the front of the curve.
Some of the other short-term correlations look spectacular, but be careful reading too much into them. USD/JPY has a 0.95 five-day correlation with VIX futures, 0.65 with the MOVE Index and -0.96 with S&P 500 futures. Given the yen’s role as a funding currency for carry trades, those relationships are the polar opposite of what would normally be expected during periods of deteriorating risk appetite.
This looks like a textbook case of correlation not equalling causation, with other forces, including those linked to AI-related equity market moves, likely contributing to the unusually strong readings.
Treasury tries to tame long end
I covered US Treasury Secretary Scott Bessent’s decision to temporarily double buybacks of longer-dated securities in several reports last week, along with the initial rally in Treasuries, subsequent reversal and broader implications for the US dollar.
The bigger issue for the week ahead is what comes next. Bessent promised late last week that Treasury would release a fiscal consolidation plan sometime before Tuesday, in what looks like the latest in a lengthening list of measures designed to try to reverse the recent rise in long-dated Treasury yields.
But whether a credible plan can be cobbled together in the space of a few days is highly debatable. After years of extremely stimulative fiscal policy, US public debt topped $40 trillion for the first time last week, with large deficits remain firmly entrenched.
Source: LSEG, FOREX.com
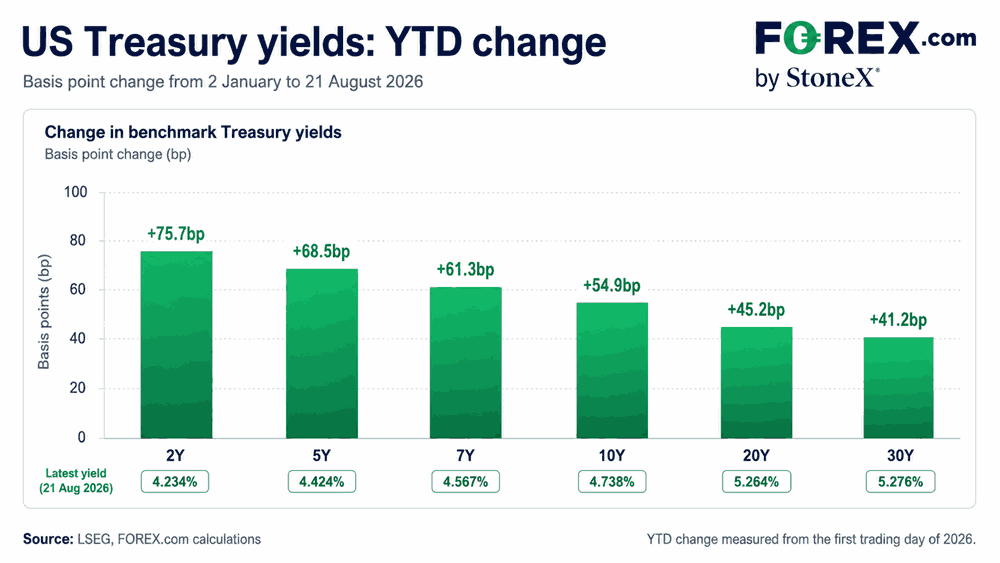
What we’ve seen across the US curve this year has been a bear flattening, with front-end yields lifting sharply higher in response to persistent above-target inflation, initially driven by tariff policy and more recently by higher energy prices and the ongoing AI capex build-out.
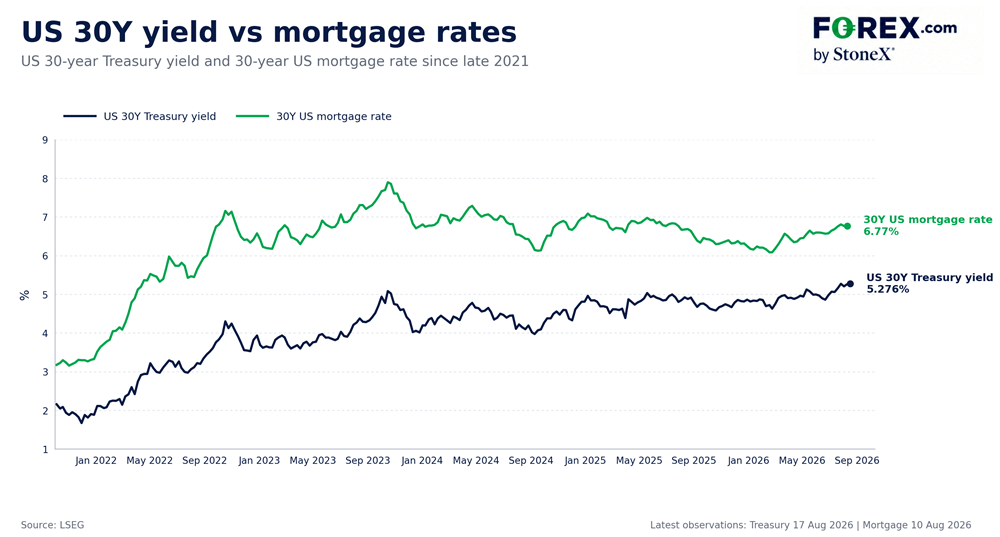
But for what the move further out the curve lacks in magnitude, it’s the level yields have reached that has really got the attention. 30-year Treasury yields pushed to their highest level since 2007 last week, with that pressure feeding directly into key private-sector borrowing costs.
As the next chart shows, average 30-year mortgage rates, using Mortgage Bankers Association data, continue to closely track movements in long-dated Treasury yields.
Source: LSEG, FOREX.com
With the revolt at the back end of the Treasury curve still very much alive, whatever Bessent unveils will provide another test of whether the administration can convince investors that the fiscal trajectory is going to change, rather than simply telling the market it's wrong.
This content was created by an affiliate of FOREX.com and represents the views and opinions of the author/speakers, not the views and opinions of FOREX.com, StoneX Group Inc., or its subsidiaries. The content has not been independently reviewed by FOREX.com.
A confused curve ahead of Jackson Hole
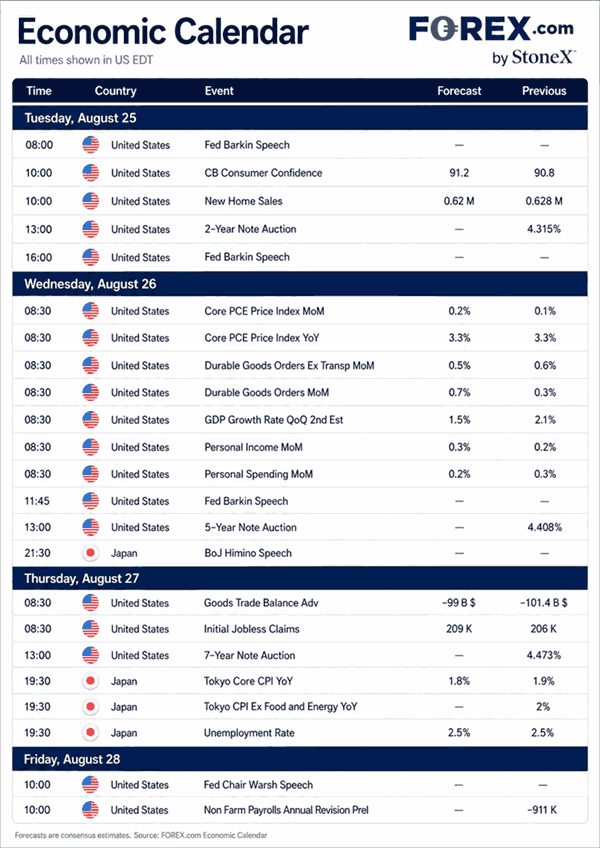
The US calendar is busy this week: Core PCE, second-estimate GDP, personal income and spending data and a run of Treasury auctions would normally dominate. But given what’s coming on Friday, they unusually screen as secondary this week.
Source: TradingView, FOREX.com
Fed Chairman Kevin Warsh will deliver the keynote address at Jackson Hole. Since taking the job, he’s adopted a strategy of saying less and allowing markets to do more of the work in determining where financial conditions should adjust as new information arrives.
That’s completely contrary to what we’re seeing across the other side of town, where Scott Bessent is now actively trying to stop market forces from driving long-dated Treasury yields higher.
That leaves Warsh looking snookered ahead of his address on Friday. If his preference is to let markets figure out where financial conditions should sit, how does he address the fact Treasury is now actively trying to influence the very market he wants to do more of the work?
Does he try to complement what Treasury is doing by sounding even more hawkish than he has in the past? To make that credible, he’d arguably have to stray into something bordering on forward guidance, something he's so far gone out of his way to avoid.
Or does he acknowledge the clear softening in recent US data? That would risk coming across as more dovish, which could conceivably steepen the curve further if markets responded by selling the back end on concerns about the Fed’s longer-term inflation-fighting credibility.
Neither option looks especially appealing. As such, he may choose to use his appearance to simply update markets on the Fed’s task forces, providing some clues as to what may determine future policy decisions without giving an explicit rates signal. But if that doesn’t directly address the Fed’s reaction function, it may add to existing frustrations, potentially giving bond vigilantes another reason to go to town further out the curve.
Benchmark revision may shake rates outlook
Adding to the importance of Friday, it will also bring the preliminary annual benchmark revision to nonfarm payrolls. These revisions have moved markets hard in the past when they’ve revealed employment growth was materially weaker than previously reported. With payroll growth already slowing sharply, the obvious question is whether another sizeable downward revision may do the same.
Japan takes a distant back seat
Even by usual standards, the Japanese calendar screens as a secondary consideration given how dominant moves in the US curve have been. However, there are still a couple of releases worth watching.
On Tuesday, the Bank of Japan publishes its own underlying inflation measures, including an index that strips out the impact of government subsidies, providing a cleaner read on underlying price pressures.
Tokyo CPI also arrives on Friday, three weeks before the national inflation report, and usually provides a strong steer on what to expect. Its ability to spark volatility has really declined recently, meaning it would likely take a major surprise to generate a meaningful market reaction.
USD/JPY returns to familiar territory
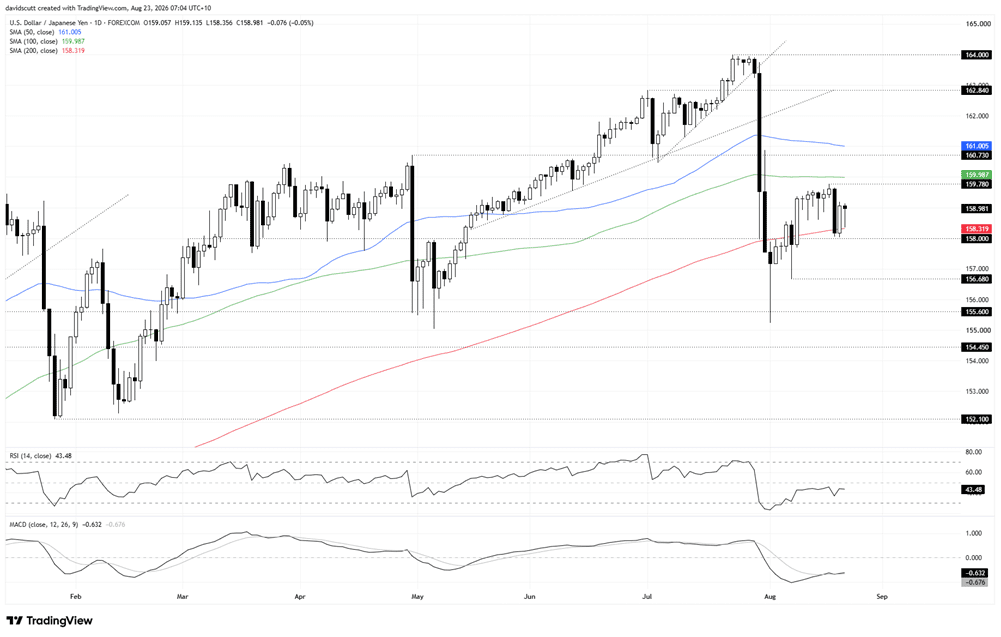
Source: TradingView
USD/JPY looks to be moving back into the sideways range it occupied before the Iran war triggered the sharp repricing at the front of the US Treasury curve.
The pair did a lot of work above 158 earlier this year and that area is again providing support, aided by the 200-day simple moving average. Dips towards 158 were bought last week, making that the immediate downside focal point. Below there, 156.68, the August 7 low, is the next level to watch, followed by 155.60, the start of a more pronounced support zone that absorbed a wave of offers during the intervention episodes earlier this year.
On the topside, the rebound stalled just shy of the psychologically important 160 level last week, putting 159.78 in focus immediately overhead. Above there, the 100-day simple moving average and 160.73 are the next levels to watch.
Beyond those levels, there really isn’t much of a directional signal coming from the chart. The oscillators have largely moved back towards neutral following the abrupt intervention-led decline in late July, while price action continues to be dictated by moves in Treasury yields.
For now, the chart looks more useful for defining the range than predicting which side breaks first. Watch what’s happening in Treasury yields to assess where directional risk may lie.
Latest market news










Web Trader platform
Our sophisticated web-based platform is packed with features.
Open an account today
Experience award-winning platforms with fast and secure execution.
Economic calendar
Related articles

EUR/USD forecast: All eyes on Warsh at Jackson Hole - Forex Friday
For much of this week, the EUR/USD has been edging lower with the US dollar regaining some ground after last week’s sell-off that was triggered, in part, by the bond market worries. Investors have been unwilling to bet further against the US dollar so far this week ahead of Kevin Warsh’s keynote speech at the Jackson Hole summit, due later today.


Bitcoin Forecast: BTC/USD Back to $80K Ahead of Warsh’s Jackson Hole Speech
After surging over $15,000 in the past 10 days alone, there is risk of a near-term pullback if Warsh says anything remotely hawkish at Jackson Hole - what are the levels to watch from here?


DAX and EUR/USD forecast: Lower energy prices, yields offer support
But the question, of course, is how much further oil prices and bond yields can fall. For now, the combination is supportive of risk assets and is helping to sustain a relatively benign decline in the dollar. The focus today will be on US core PCE inflation, due for release shortly, while Nvidia’s second-quarter earnings will provide another test for risk appetite after the US markets close – not just for US indices but for global tech-heavy indices given the influence Nvidia has over the global tech and AI names.