


Bitcoin Takes Shine from Gold Even as Pullback Begins
Bitcoin put in a massive rally over the past month and even as gold has remained in pullback, BTC/USD has continued to jump to fresh multi-month highs.
Written by
James Stanley
Sr. Strategist
Bitcoin, BTC/USD Talking Points:
- The rally had become overbought on the daily chart and as of this writing a pullback has started to form.
- Between anti-fiats, BTC/USD has outperformed gold of recent which illustrates a shift from earlier in the year, and this highlights something that may be usable for the weeks and perhaps even months ahead as BTC has held up well even with surging rates and a strong USD.
Earlier this year it seemed many had started to write off Bitcoin, as gold prices flew higher and BTC/USD continued to sell-off. After the 125k high last year, profit taking in Bitcoin led to a deeper slide that continued through most of the first half of this year, and despite the backdrop, whether stocks were flying or gold was rallying, BTC was selling off.
But ever since the larger Treasury buyback announcement on August 19th, that script has been flipped. While both gold and Bitcoin rallied on the back of that news, gold soon topped and Bitcoin just continued to run, breaking out of a falling wedge that had formed over a five-month period on the way back up to the 80k handle.
Bitcoin (BTC/USD) Weekly Chart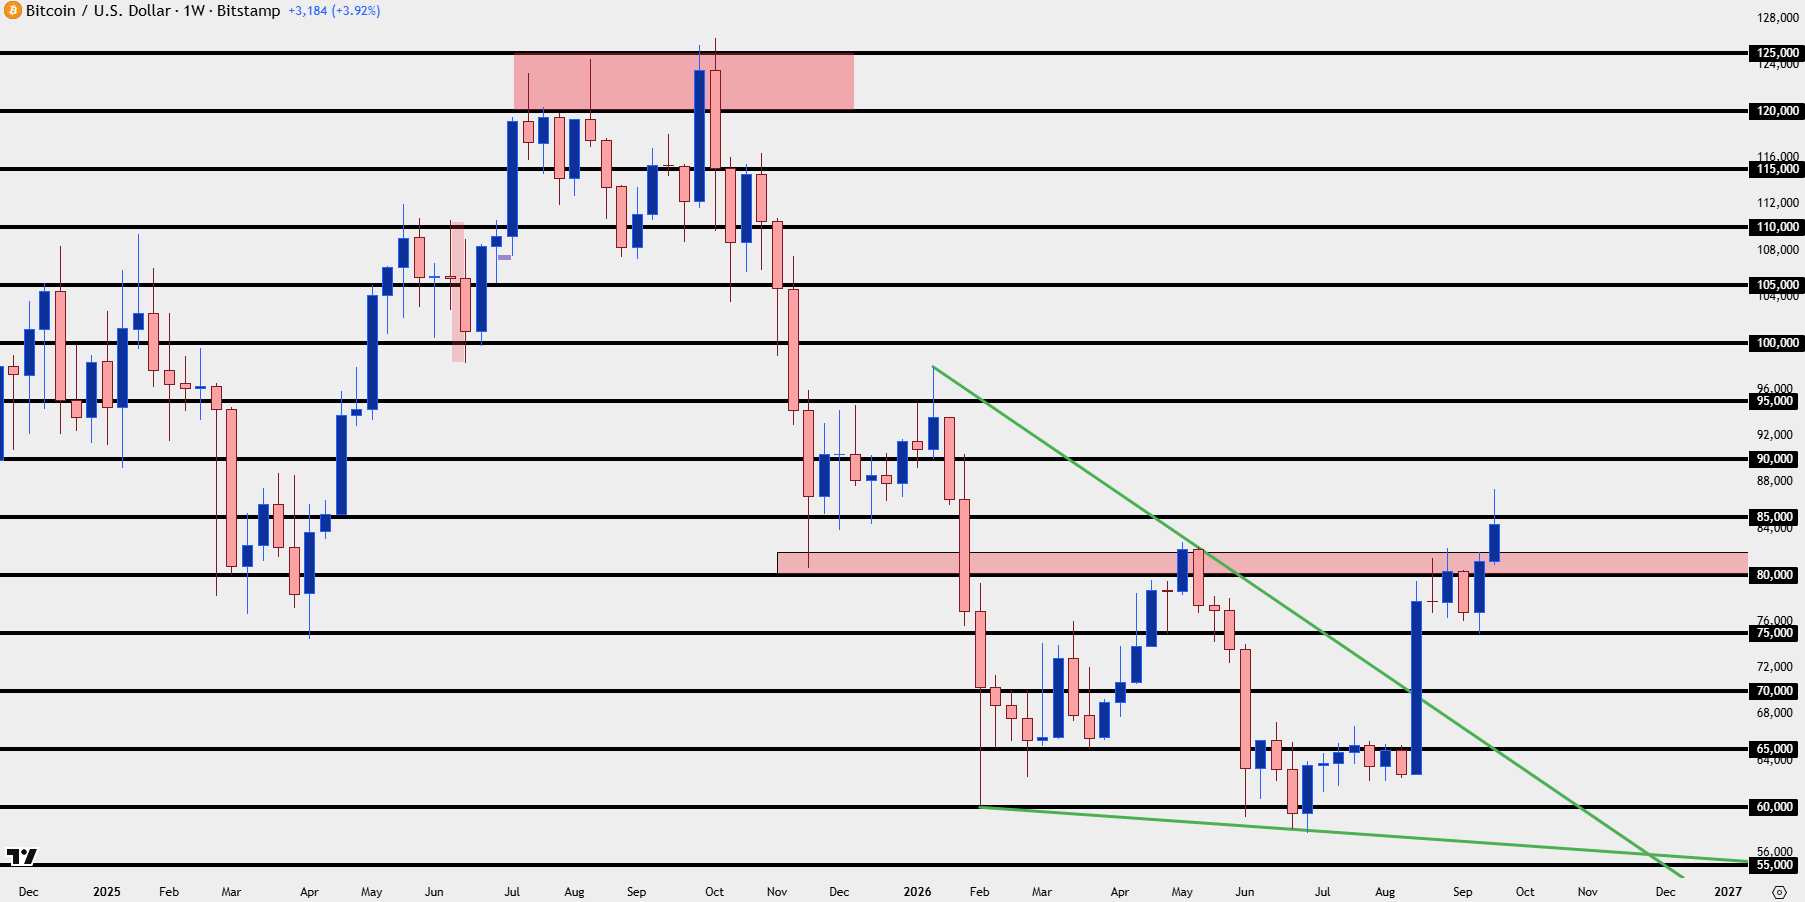
Chart prepared by James Stanley; data derived from Tradingview
Bitcoin v/s Gold
The relationship between the two markets has long been tracked as both are, in essence, a measure against fiat currencies. With a diluting fiat base, then ideally, both would increase in value as neither gold nor Bitcoin are held to the same forces of monetary expansion. But that measure isn’t consistent, and the chart below charts the value of one bitcoin divided by the value of gold, and since early-2025 gold was very much in control.
But that has shifted over the past six months with a strong push more recently, and this resembles dynamics back in 2020 or 2023.
Bitcoin v/s Gold, Weekly Chart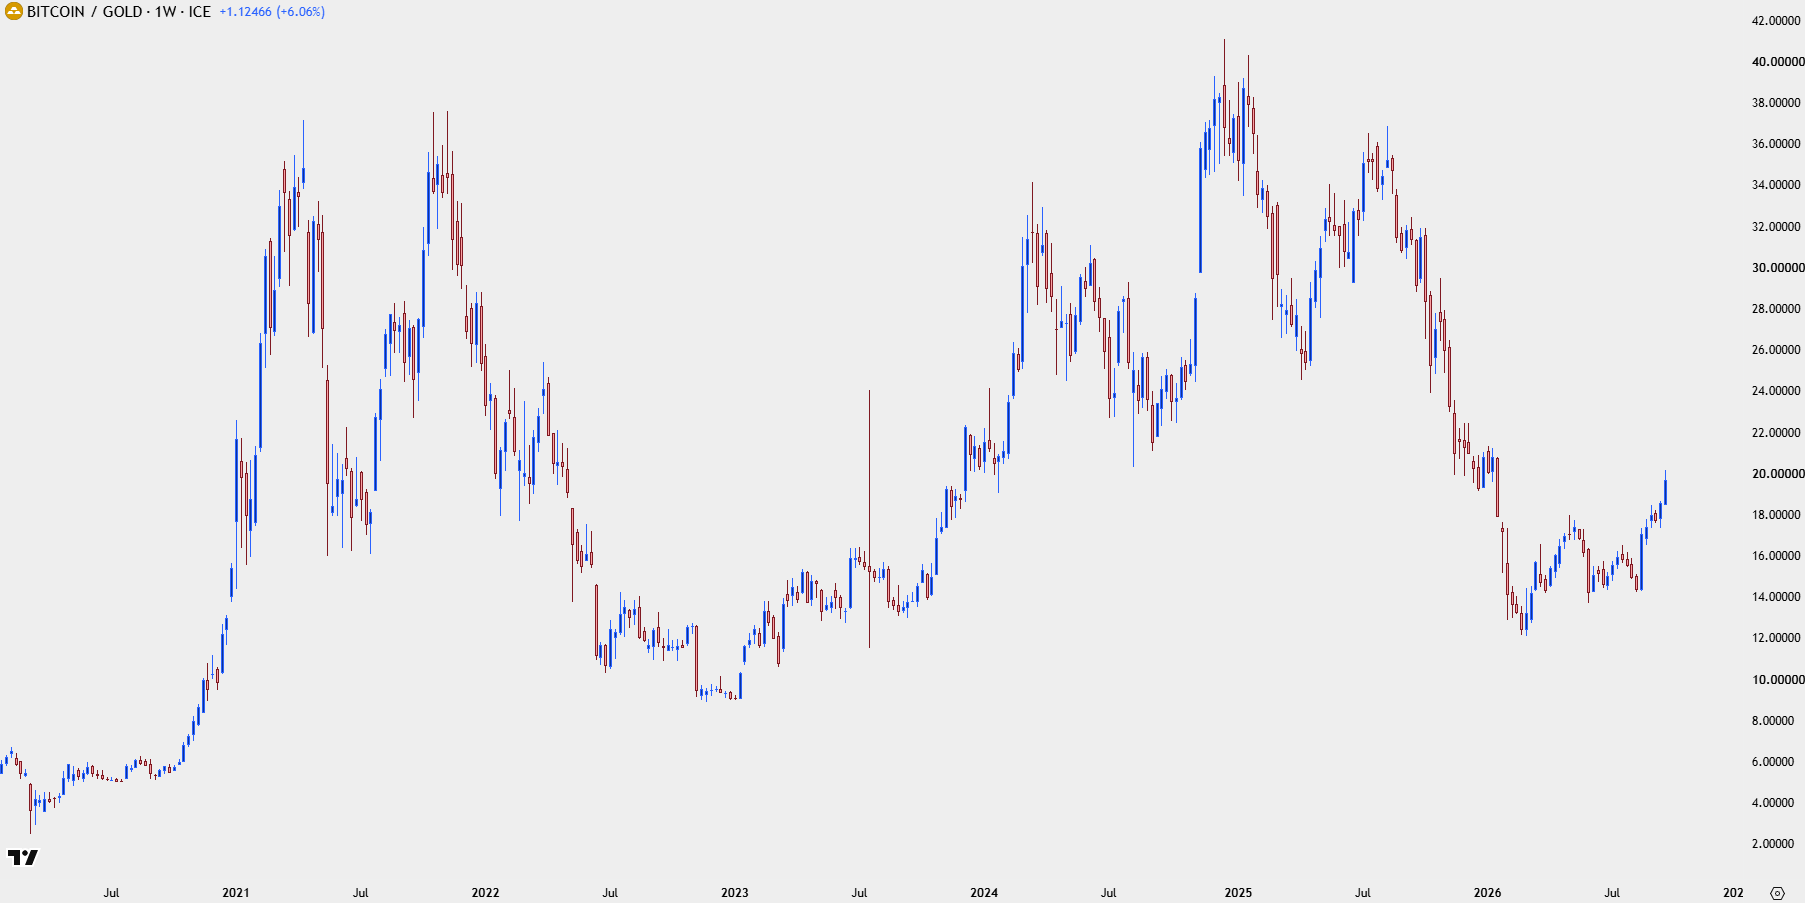
Chart prepared by James Stanley; data derived from Tradingview
What might be behind such a push? Given the current administrations embrace of cryptocurrency combined with a tighter monetary environment, this could be either a proactive move from investors or some pricing-in of an unknown variable.
Last week, for instance, really should have been bearish for Bitcoin from a fundamental perspective. Not only did we have a rate hike and a pledge of another hike from the Fed, but the Clarity act failed to pass in Congress. Yet, Bitcoin put in a bullish engulf on the weekly and, so far, has continued to rally.
With a pullback forming today, this now sets up for a possible support test at a key zone of resistance. The area around 80k has been a big spot, as there was a swing low last November and then it was just above that price where the bounce died in May (82,833, specifically).
More to the point, this was resistance for the past four weeks that was finally cleared in early trade this week, so ideally that will be the area that buyers will defend should this pullback continue.
BTC/USD Weekly Chart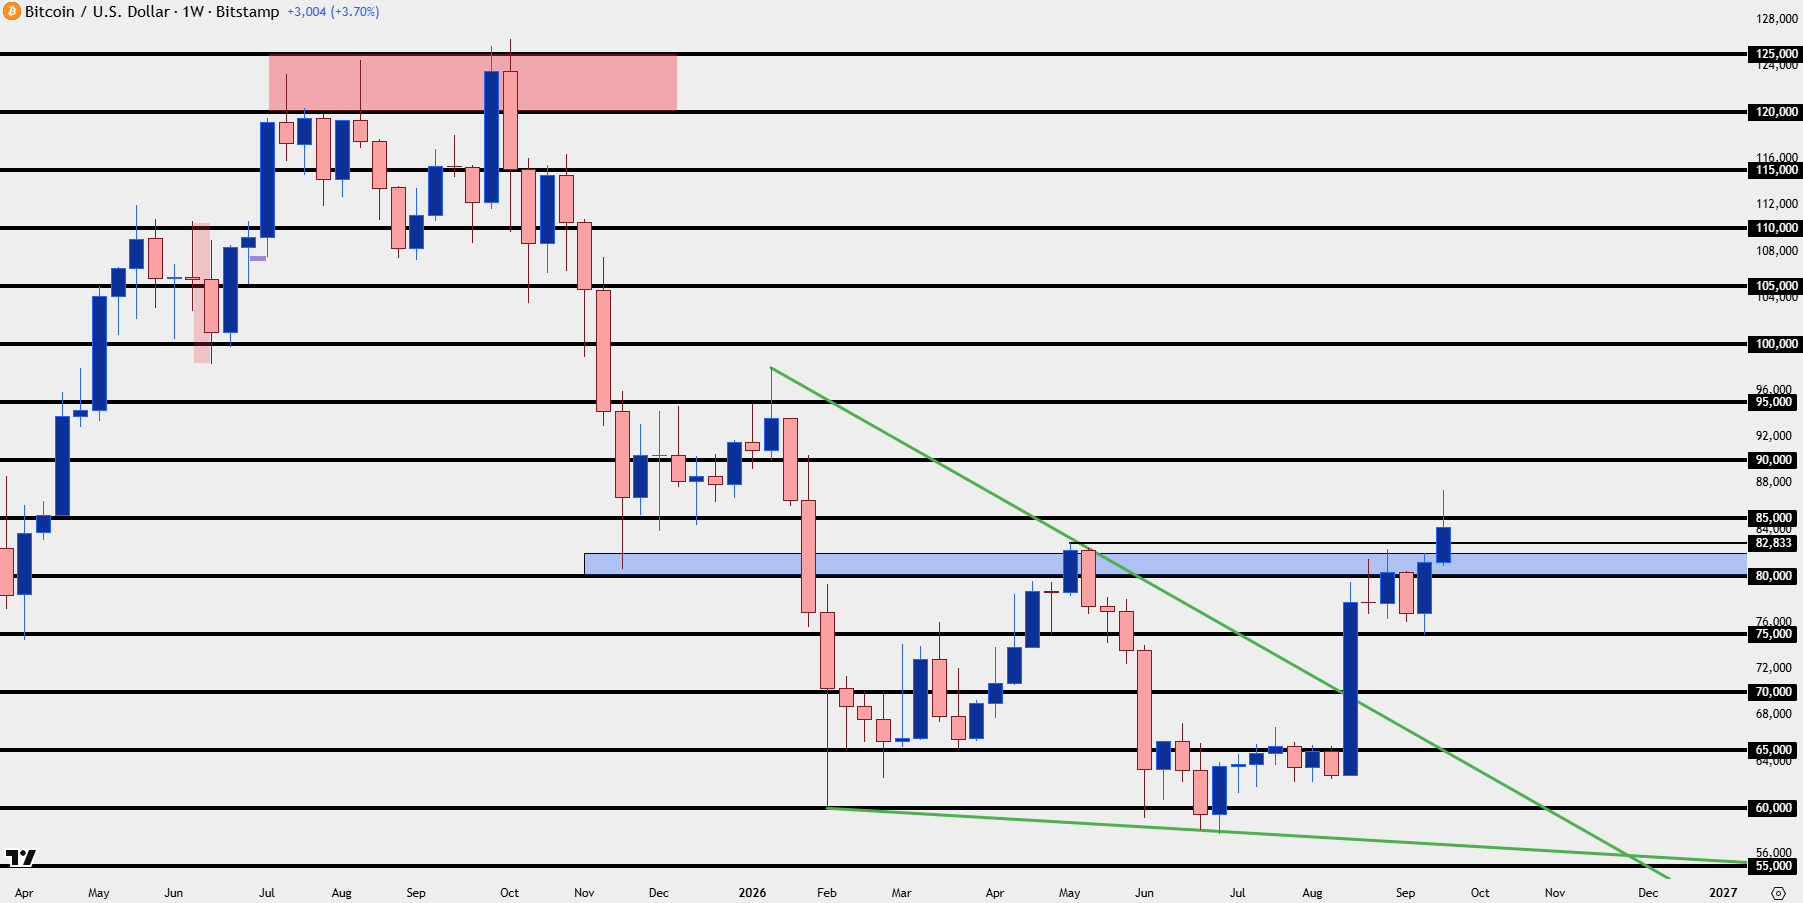
Chart prepared by James Stanley; data derived from Tradingview
Bitcoin: The Test
The major test for trends is where buyers show up during pullbacks, and that’s what we now have in Bitcoin after three consecutive days of resistance around the 87k level.
Yesterday showed a response from buyers at 85k but that obviously wasn’t enough to draw a fresh high. Now, that 82,833 level is on the radar, and that would be the next key spot given the impact it had back in May. Below that is another, at 82,047, which was a lower-high back in May and it’s what held resistance during the breakout two weeks ago.
And then below that, the 80k level is what set the low last after the Sunday open and that’s the level that would signal a loss of control from buyers if it gets taken out.
Bitcoin (BTC/USD) Daily Chart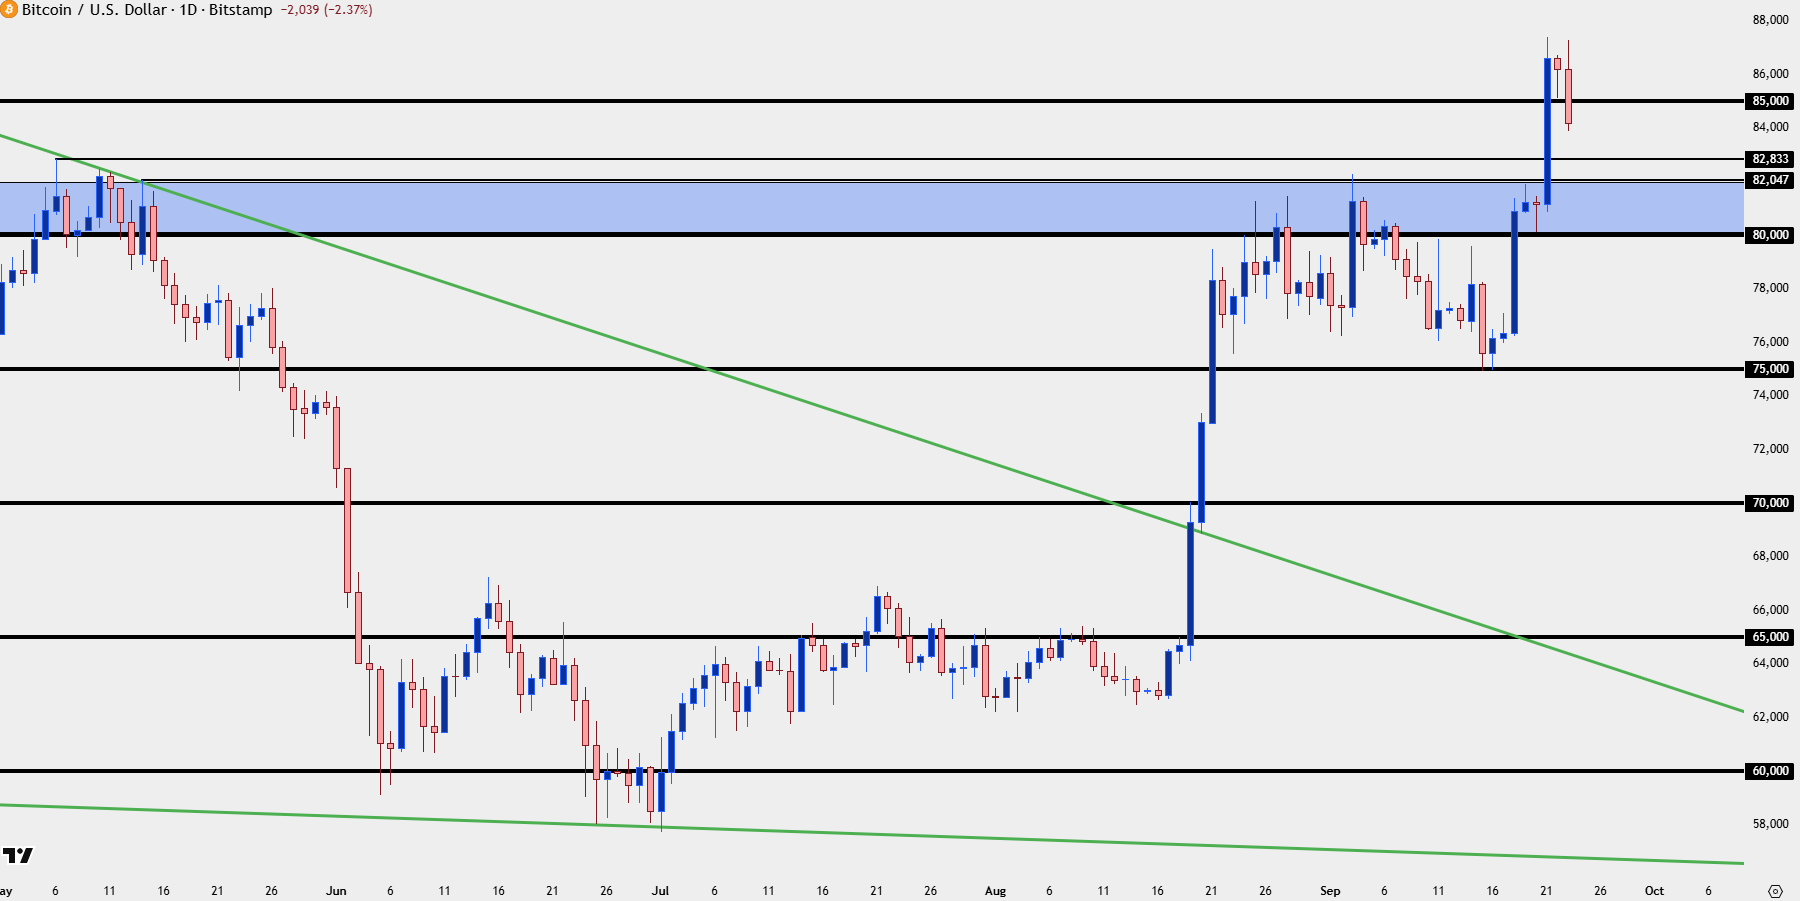
Chart prepared by James Stanley; data derived from Tradingview
--- written by James Stanley, Senior Market Analyst, Global Macro
Related tags:
Latest market news











Web Trader platform
Our sophisticated web-based platform is packed with features.
Open an account today
Experience award-winning platforms with fast and secure execution.
Economic calendar
Related articles

Bitcoin Forecast: BTC/USD Back to $80K Ahead of Warsh’s Jackson Hole Speech
After surging over $15,000 in the past 10 days alone, there is risk of a near-term pullback if Warsh says anything remotely hawkish at Jackson Hole - what are the levels to watch from here?


S&P 500 Forecast for the Week Ahead: Fresh SPX ATHs Despite Growing Bubble Fears
Is it a bubble or just a mania? While AI holds a lot of promise the valuations are becoming untethered from historical norms but that doesn’t necessarily mean that prices need to come down.

Bitcoin, Gold Price Outlook: US CPI & Overbought Risks in Focus
Bitcoin, Gold Price Outlook Following a steep risk-on rally across US equity indices and precious metals, several major markets are approaching critical technical levels as momentum becomes increasingly stretched.
