

USD, USD/JPY To Drive FX Markets in US CPI Week
It was a shock move of dual intervention two weeks ago but since then, both USD and USD/JPY have clawed back, putting even more emphasis on this week’s US CPI print.
Written by
James Stanley
Sr. Strategist
US Dollar, USD/JPY Talking Points:
- Markets are still showing a near 50/50 chance of a rate hike in September, with a near 80% probability of one by the end of the year.
- US CPI is expected to soften at Wednesday’s release and this will likely have a large toll on both rate expectations and USD trends.
The Friday NFP report was not good as the US showed a contraction in jobs, and initially, this jolted a move of weakness in USD/JPY. But, like I had said in the prior week, on the heels of the intervention-fueled sell-off in both USD and USD/JPY, support around 155.00 could be a more attractive concept as it was unlikely that intervention would hit there.
Since then, it’s been a steady clawing back from bulls even after the NFP-fueled dip. The carry remains positive on the long side of the pair and while there’s now theoretically-capped upside, given that dual intervention, pullbacks to support can still offer attractive risk-reward opportunities. And that will likely remain as the case until something compels longer-term bulls to close positions.
The math can change at the prior 164 high, and perhaps even at 160, but this week will be telling as we finally get a piece of pertinent US data that could compel long-term bulls to pare positions.
I looked into this last week and this bears resemblance to a situation that showed back in 2022. At the time, the Fed was in a hawkish stance following a slew of rate hikes that year. The Bank of Japan tried intervening at 145, and that failed as buyers simply loaded up and pushed up to the 150.00 handle. But it was at 151.95 when the BoJ intervened again and put bulls on their back foot, and in that instance, a slowing in US CPI helped to prod bulls to close positions and that led to a decisive two-month string of weakness.
At this point, the BoJ has placed their line in the sand, with an assist from the US Treasury Department. Pullbacks have so far brought out buyers, similar to how 145 did back in October and November of 2022. But in that prior episode it was below-expected US CPI that ultimately provoked the reversal, and that’s what is possible at this Wednesday’s release.
USD/JPY Daily Chart 2022-2023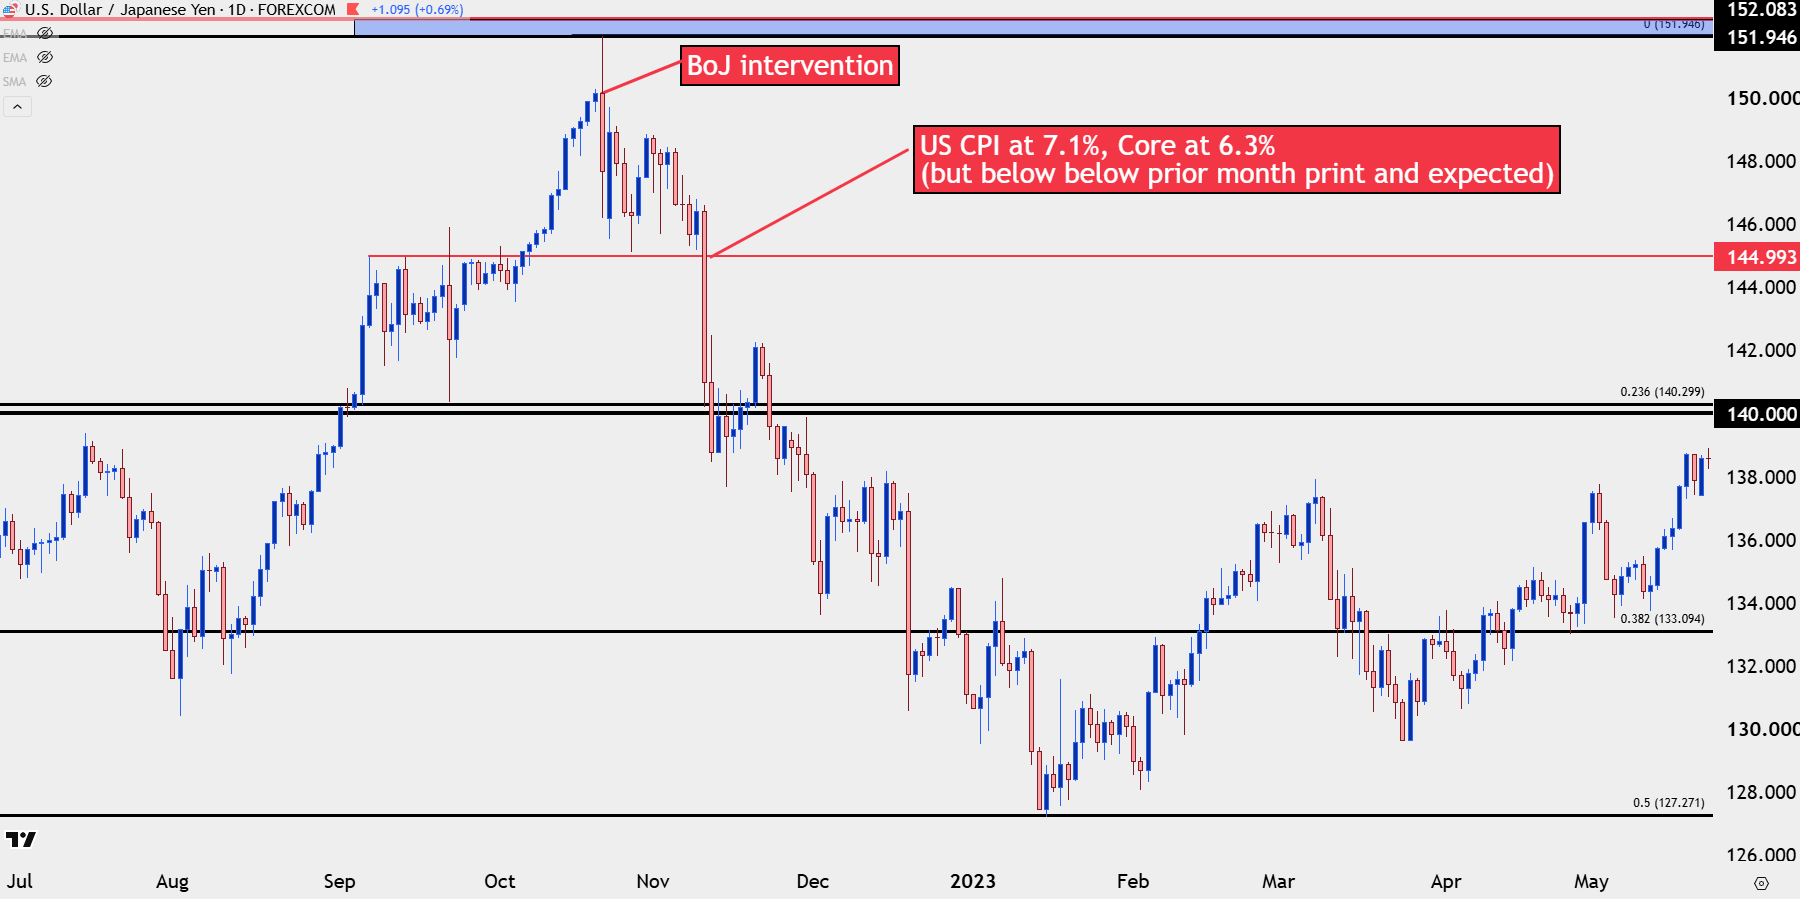
Chart prepared by James Stanley; data derived from Tradingview
USD/JPY into CPI
At this point we’ve seen sellers take their shot after last week’s below-expected NFP release but there’s still harboring probabilities for US rate hikes, which shows that the larger focus is on inflation. And given comments from Fed officials that makes sense. As we go into the Wednesday release bulls have control of short-term trends, but it’s that 160 area that looms large and, above that, the 164 level that has so far been defended.
At this point, it really seems as though larger USD flows and, in-turn, flows in other major currency pairs will drive on the basis of the long-term carry trade in USD/JPY.
USD/JPY Daily Chart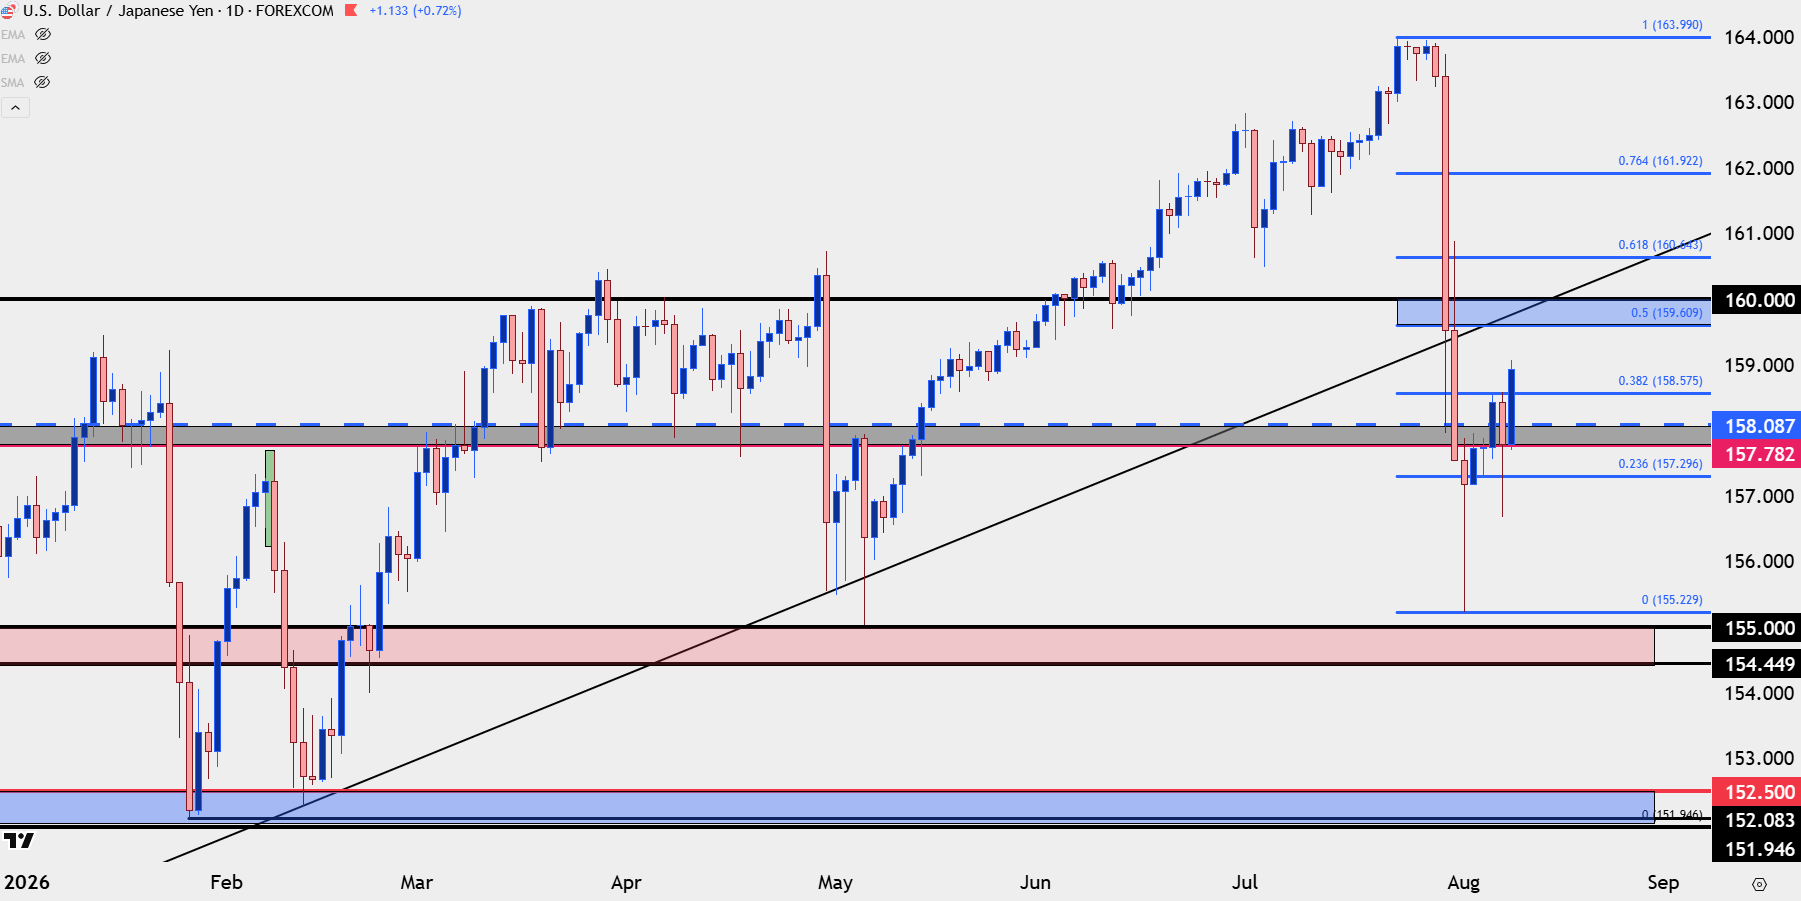
Chart prepared by James Stanley; data derived from Tradingview
US Dollar
The DXY basket put in a strong break of the 100-level following the intervention after the FOMC meeting, and at this point, it has a similar short-term bullish but longer-term bearish backdrop, with that prior support of 100.21-100.40 as a spot for lower-high resistance potential.
US Dollar Daily Chart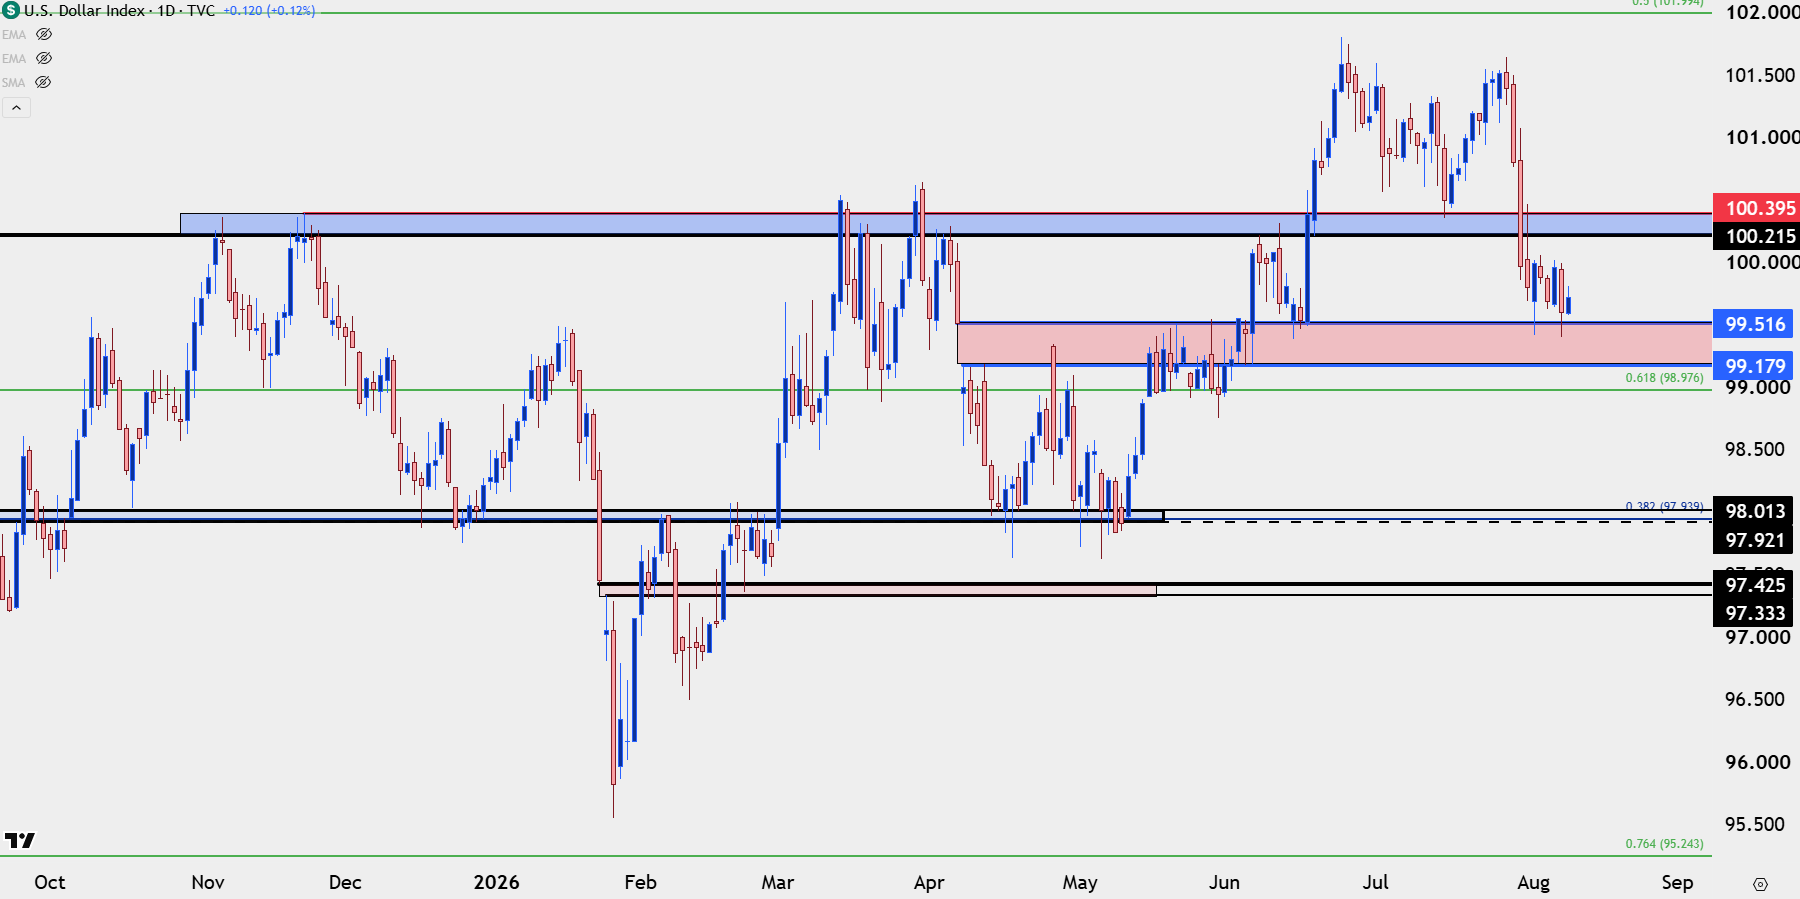
Chart prepared by James Stanley; data derived from Tradingview
EUR/USD
In last week’s webinar I looked at EUR/USD with focus on 1.1500 as support and then 1.1576-1.1613 as resistance. Both areas have played a role as buyers have defended the big figure and the larger zone of prior resistance-turned-support has so far held the highs.
It does feel as though EUR/USD is still along for the ride, but at the least, there’s some important waypoints to track for directional plays in the pair.
EUR/USD Daily Chart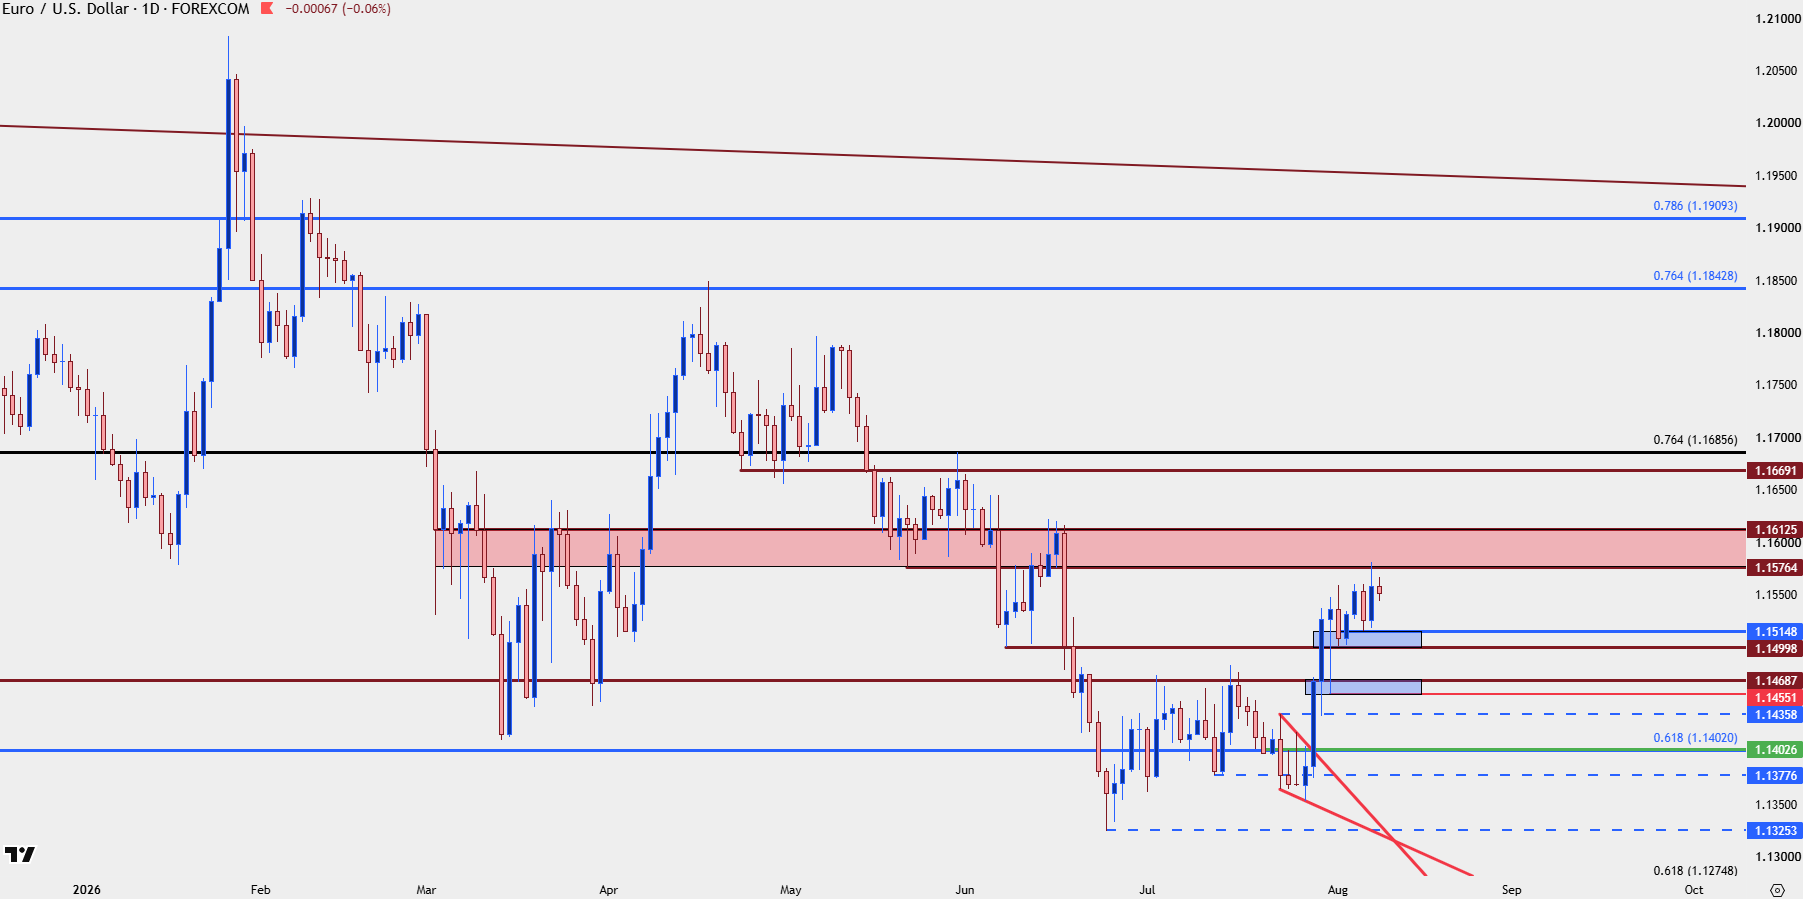
Chart prepared by James Stanley; data derived from Tradingview
GBP/USD
For USD-weakness, there could be perhaps a brighter argument in GBP/USD which similarly broke out of a falling wedge around the FOMC meeting. The challenge here, however, is the 1.3500 psychological level that is back in to hold the highs. Shorter-term, that horizontal resistance coupled with the higher-lows in the pair make for an ascending triangle, which gives bulls some degree of hope for topside continuation scenarios.
Since the webinar in the attached video, the pair has ventured above that price so this now becomes a spot for shorter-term higher-low support for bullish continuation setups.
GBP/USD Four-Hour Chart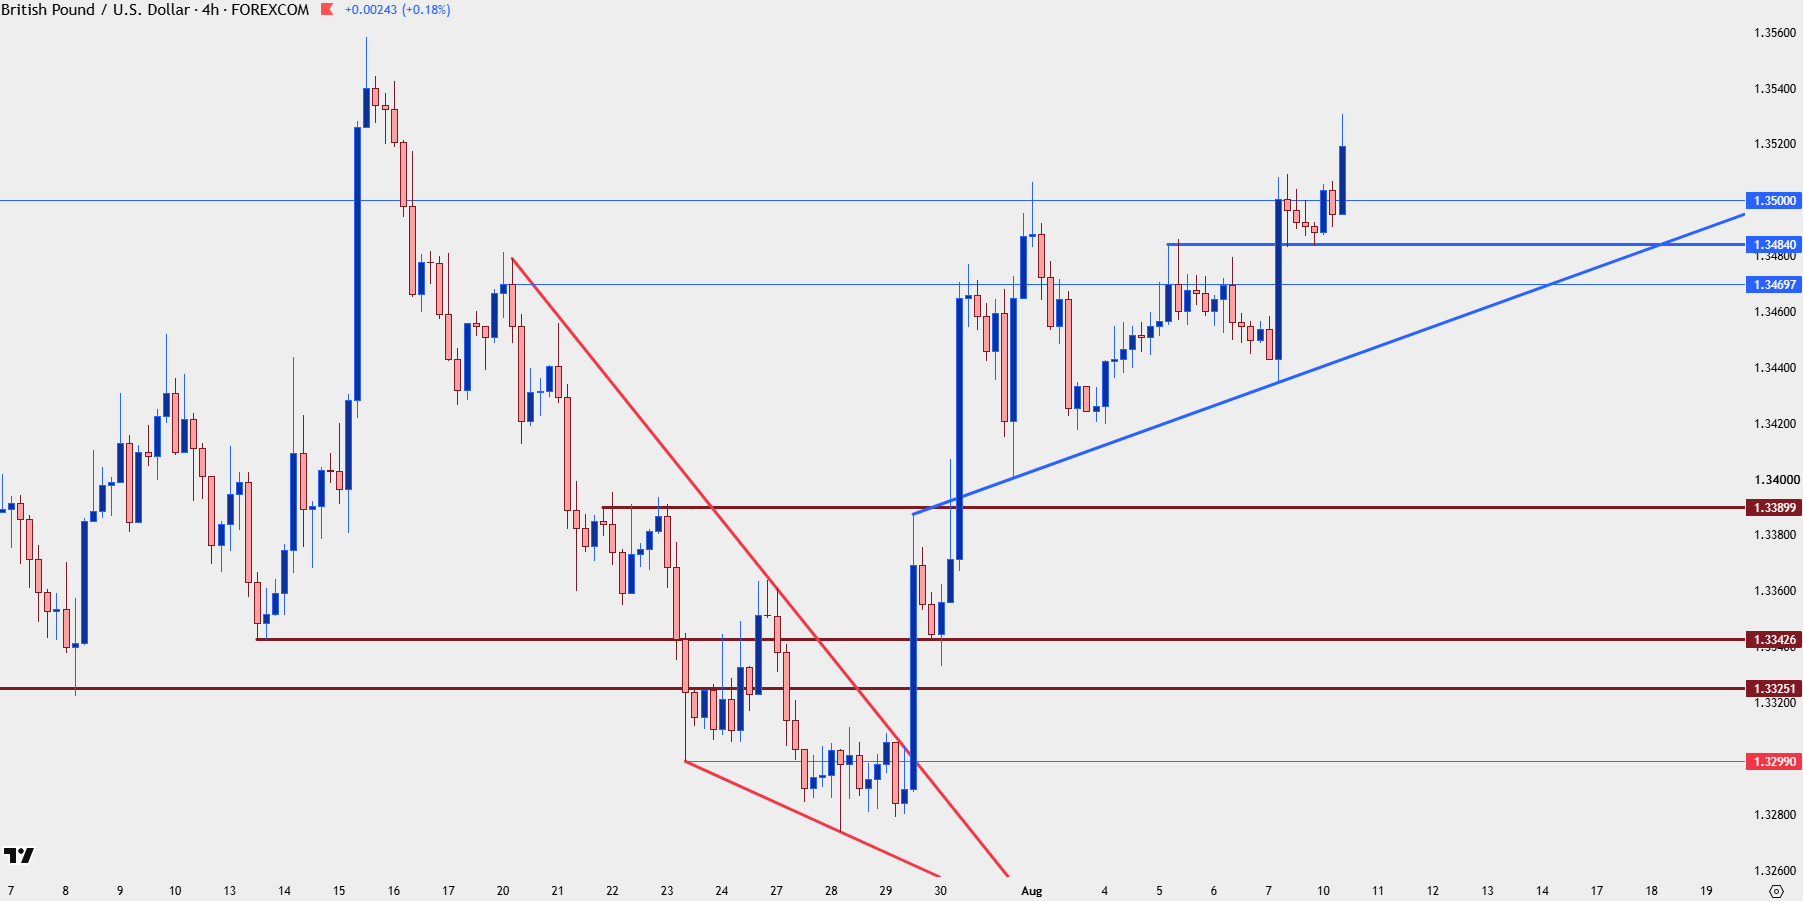
Chart prepared by James Stanley; data derived from Tradingview
AUD/USD
After a decisive sell-off to finish Q2 AUD/USD has been recovering quickly and this sets the stage for the RBA meeting later tonight, with the wide-expectation that the bank will pose a hawkish hold.
This gives some context and if there is pullback, the .7000 handle remains a prime spot to look for pullbacks to work towards.
AUD/USD Daily Price Chart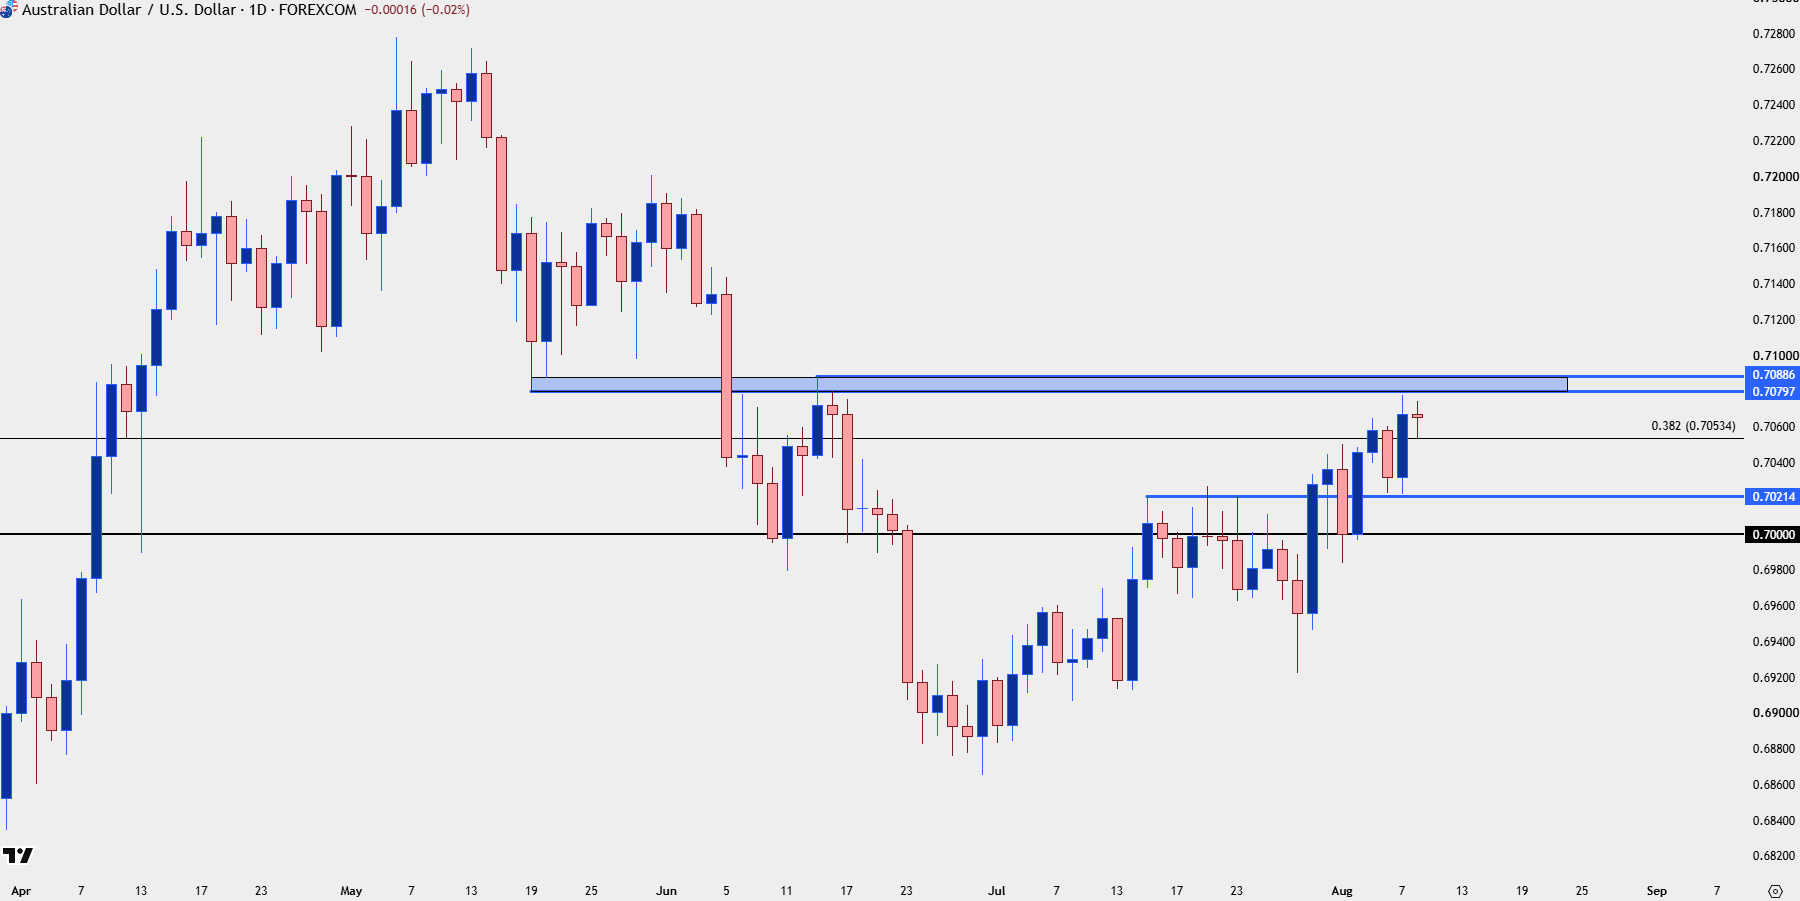
Chart prepared by James Stanley; data derived from Tradingview
--- written by James Stanley, Senior Market Analyst, Global Macro







Web Trader platform
Our sophisticated web-based platform is packed with features.
Open an account today
Experience award-winning platforms with fast and secure execution.
Economic calendar
Related articles

Canadian Dollar Forecast: USD/CAD Weekly Reversal Puts Yearly Uptrend Back in Focus 8 29 2026
USD/CAD has staged its strongest weekly advance since June, shifting the focus to whether a more durable low is finally taking shape.


USD/JPY weekly outlook: Payrolls may challenge the Fed’s hawkish reset
USD/JPY has finally woken from its slumber. Payrolls now loom as the key test of whether the latest hawkish repricing sticks or sinks.


Euro Short-term Outlook: EUR/USD Pullback Nears Pivotal Uptrend Support 8 28 2026
Warsh's comments accelerated the EUR/USD selloff, raising the stakes as buyers look to stabilize the broader recovery.