


How to use the Gold USD correlation to trade fx
Since the start of the year, the correlation between Gold and the US Dollar has been negative a majority of the time
Written by
Global Author
Financial Analyst
When the value of the US Dollar moves higher, many assume that the value of Gold should move lower. And most of the time, that is often the case. However, the correlations aren’t always a perfect 1-for-1. Therefore, traders should look at the relationship of gold to the US Dollar over time, and not on a short-term basis.
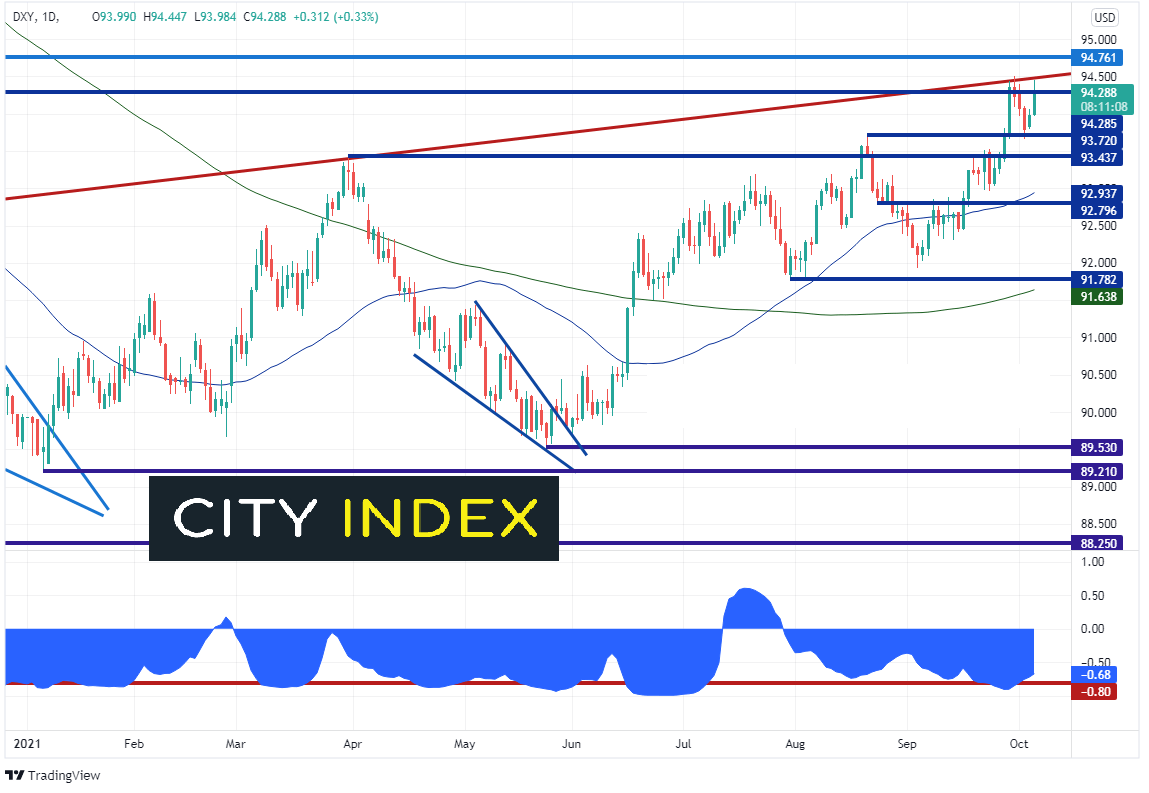
In the chart of the US Dollar Index (DXY) below, price is making new local highs and testing a long-term trendline dating back to 2011 (red). Notice the correlation coefficient at the bottom of the chart. Since the start of the year, there has been a negative correlation most of the time, however there was a brief period in February and during July where the relationship was positive. Also notice that the relationship isn’t always at extremes. Traders typically look for correlation coefficients above +0.80 or below -0.80 for a strong correlation. This will help to make better trading decisions. The correlation was -0.90 at the end of September, however it is currently at -0.68. It is still inversely related but not at an extreme.
Source: Tradingview, Stone X
Everything you need to know about the US Dollar Index
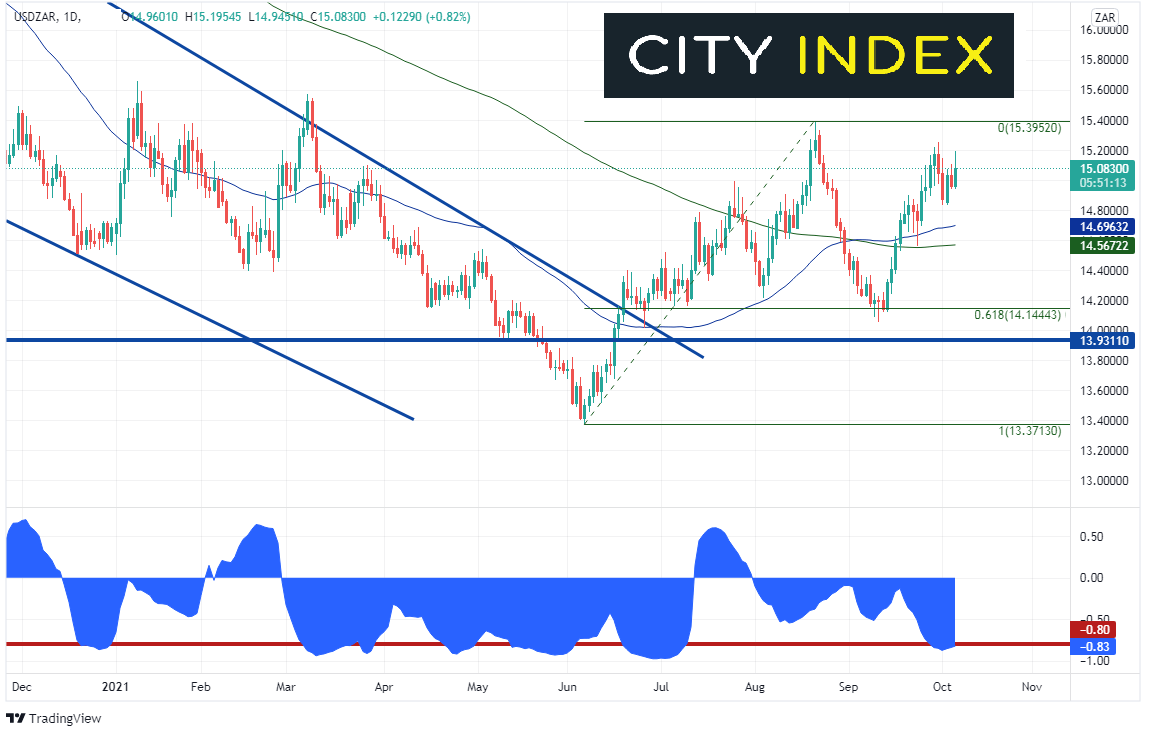
However, just because Gold’s correlation isn’t always at an extreme vs the DXY doesn’t mean there aren’t correlations to other US Dollar pairs traders can look for. The South African Rand is often correlated with Gold (or inversely correlated to USD/ZAR) , as South Africa is a large exporter of Gold. The current correlation coefficient between Gold and USD/ZAR is -0.83 on the daily timeframe. Therefore, traders can use the price of Gold to help make trading decisions regarding USD/ZAR.
Source: Tradingview, Stone X
Trade USD/ZAR now: Login or open a new account!
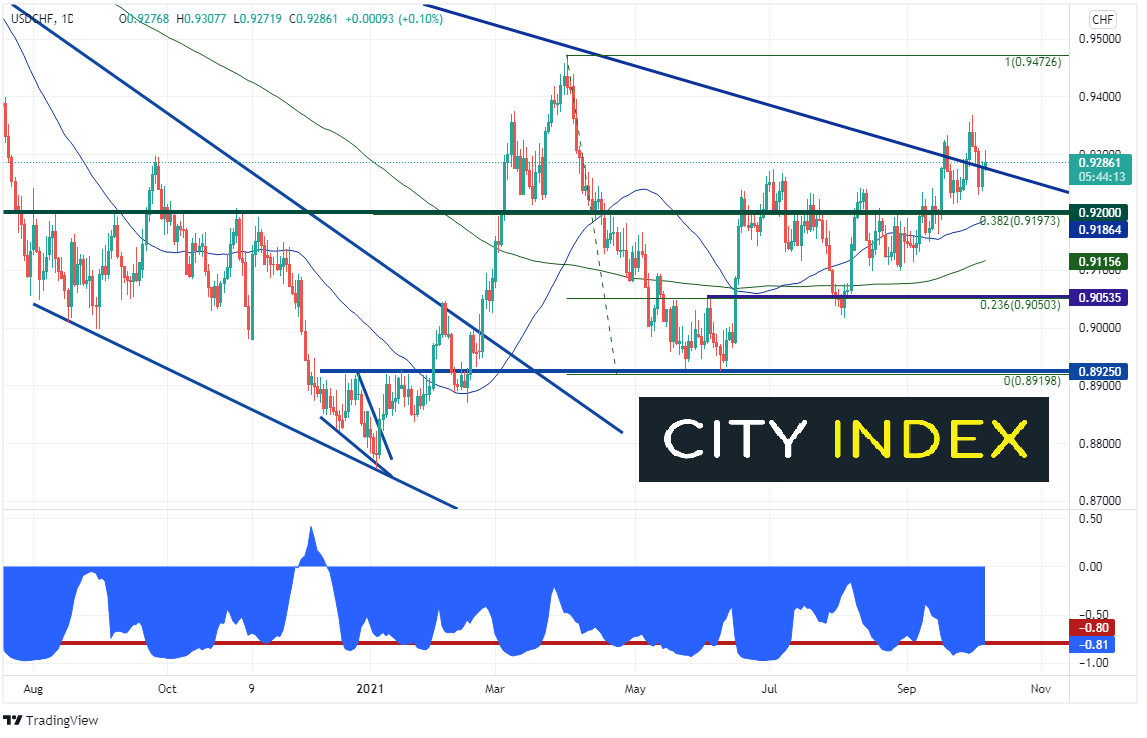
USD/CHF is often used a as proxy for currency traders who don’t have access to trade the DXY. Notice at the bottom of the screen that the correlation coefficient is -0.81. The correlation has been negative since the beginning of the year and is currently at an extreme (below -0.80). Therefore, traders can look to use Gold to help determine the direction of USD/CHF.
Source: Tradingview, Stone X
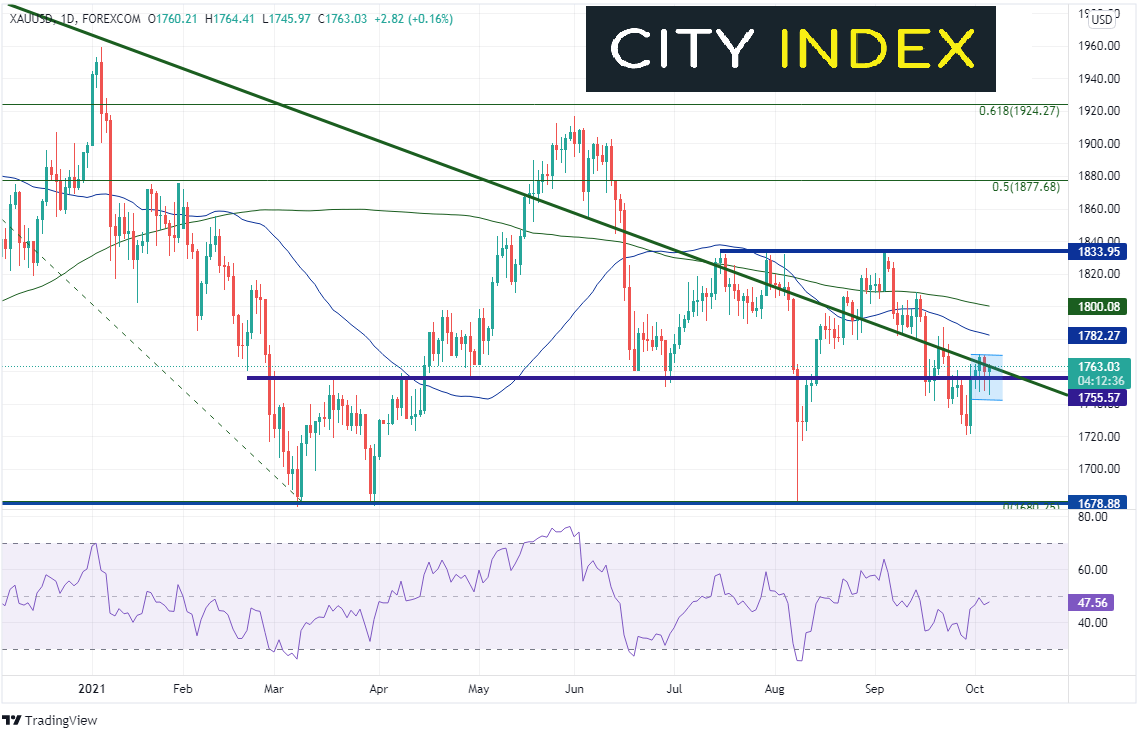
On a daily timeframe, Gold (XAU/USD) has been putting in lower highs since making all-time highs in August 2020. Since mid-May, Gold has been oscillating around the downward sloping trendline (green) from those highs at 2075.11. Notice that the last 4 daily candlesticks have long lower wicks. This implies that sellers come in early in the day and buyers scoop Gold off the lows to push it higher into the close. If buyers can push price above the 50- and 200- Day Moving Averages, at 1782.25 and 1800.08 respectively, there is room for Gold to move up to horizontal resistance at 1834. If this happens, watch for USD/CHF to make it’s was back to 0.9200 and USD/ZAR to test recent lows near 14.10.
Source: Tradingview, Stone X
However, if Gold fails to move higher and bears gain control, price can head towards the lows of August 9th at 1679.13. This could push USD/CHF towards April 1st highs at 0.9473 and USD/ZAR towards 15.3950.
The US Dollar Index (DXY) and Gold (XAU/USD) are usually inversely correlated, that is, the two assets move in opposite directions. However, most of the time, the correlation isn’t strong enough to be meaningful. But if traders look for correlations between Gold and other US Dollar pairs which are above +0.80 or below -0.80, they’ll have a better chance of using the precious metal to help trade the US Dollar.
Learn more about gold and silver trading.
Related tags:







Web Trader platform
Our sophisticated web-based platform is packed with features.
Open an account today
Experience award-winning platforms with fast and secure execution.
Economic calendar
Related articles

Euro Short-term Outlook: EUR/USD Pullback Nears Pivotal Uptrend Support 8 28 2026
Warsh's comments accelerated the EUR/USD selloff, raising the stakes as buyers look to stabilize the broader recovery.


Gold and S&P 500 analysis: What now after Warsh’s hawkish speech?
The dollar surged across the board after the Fed Chair Kevin Warsh surprised with a hawkish-leaning speech at the Jackson Hole summit. All the bearish dollar bets that had been accumulated since last Friday on the back of data weakness and bond market troubles had to be squared and that triggered a short squeeze rally for the dollar. Gold and silver dropped, as a result, as too did bitcoin, while US indices were giving back earlier gains.


EUR/USD forecast: All eyes on Warsh at Jackson Hole - Forex Friday
For much of this week, the EUR/USD has been edging lower with the US dollar regaining some ground after last week’s sell-off that was triggered, in part, by the bond market worries. Investors have been unwilling to bet further against the US dollar so far this week ahead of Kevin Warsh’s keynote speech at the Jackson Hole summit, due later today.