


Weekly Equities Outlook: Nvidia, Salesforce, Strategy
Earnings from Nvidia and Salesforce are in focus, as well as crypto stocks such as Strategy after Bitcoin's 20% jump last week.
Written by
Fiona Cincotta
Senior Market Analyst
Nvidia Q2 Earnings Preview
Nvidia is due to report earnings after the close on Wednesday, August 26.
Another strong quarter is expected, with Q2 revenue forecast at around $91 billion, give or take 2%, representing a 96% increase from the same quarter last year. EPS is expected to come in at $2.08, up around 98% year-on-year.
This is the first quarter where China data-centre sales won't be included. That gives investors a clearer picture of underlying demand across the wider business, although any meaningful recovery in China sales later in the year could provide additional upside.
The focus will quickly shift to the third-quarter outlook, which is expected to be Nvidia's first $100 billion-plus revenue quarter.
Gross margins will also be important, with expectations around 75%. Any meaningful deterioration could raise questions over the profitability of the AI build-out, even if revenue continues to grow strongly.
Nvidia shares are up around 18% this year, outperforming the S&P 500, which is up around 11%.
With the share price around $225, the bar is high. The market isn't simply looking for another earnings beat. Investors want evidence that AI demand is still accelerating quickly enough to justify Nvidia's valuation.
How to trade Nvidia earnings
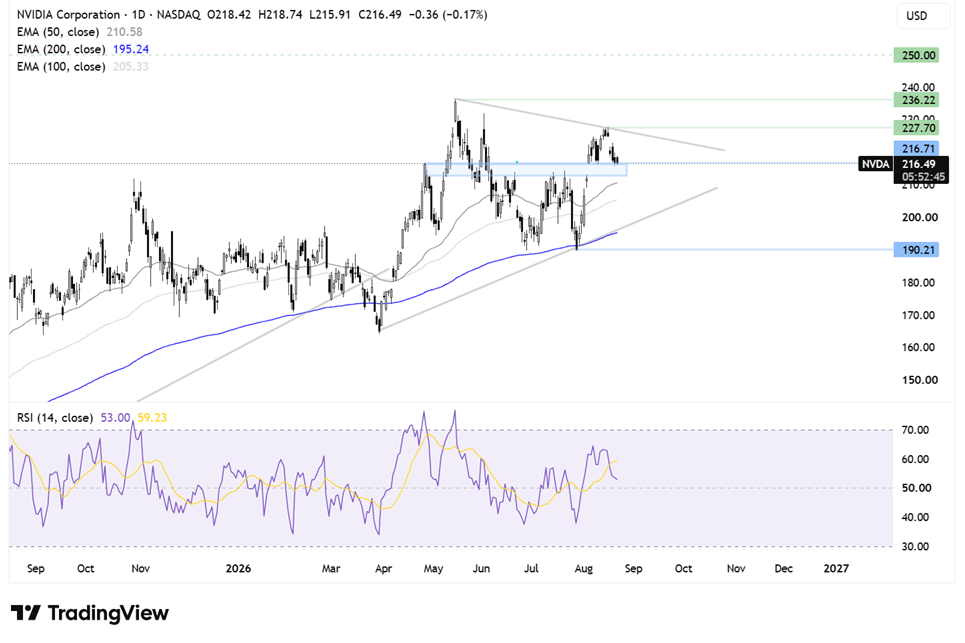
Nvidia trades within a symmetrical triangle pattern. The price recently ran into resistance around $227, the falling trend line, before pulling back towards the $212-$216 support zone.
If support holds, buyers will look to recover towards $226-$227. A break above the falling trend line and the August high could open the door to $236 and fresh record levels.
A break below the support zone would expose the 50 EMA at $210, followed by the 100 EMA at $205 and then the 200 EMA and rising trend line support around $200.
Salesforce Q2 Earnings Preview
Salesforce will report Q2 earnings on August 26 after the market close.
Expectations are for revenue of $11.33 billion, an 11% year-on-year increase, with EPS forecast at $3.27.
This follows a strong first quarter, when Salesforce generated $11.13 billion in revenue, up 13% from the previous year, while EPS came in at $3.88. The results led management to raise full-year sales guidance to $46 billion.
AI is increasingly becoming an important part of the Salesforce growth story.
The company's Agentforce platform, which automates tasks for large businesses, has crossed $1 billion in annual sales. Combined with its Data 360 business, total annual AI and data software sales have reached $3.4 billion.
That gives Salesforce another potential growth engine as corporate customers commit to multi-year AI and data deals.
At the same time, the company's core cloud software business continues to generate relatively stable recurring revenue.
The key question is whether AI demand is starting to feed through into the wider business and translate into stronger future revenue growth.
Agentforce usage and recurring revenue are growing quickly, but some indicators, including bookings, have so far shown fewer signs of a meaningful acceleration.
That makes the forward outlook particularly important. The market will want evidence that AI is not simply becoming another product line, but is actually changing Salesforce's overall growth trajectory.
How to trade CRM earnings
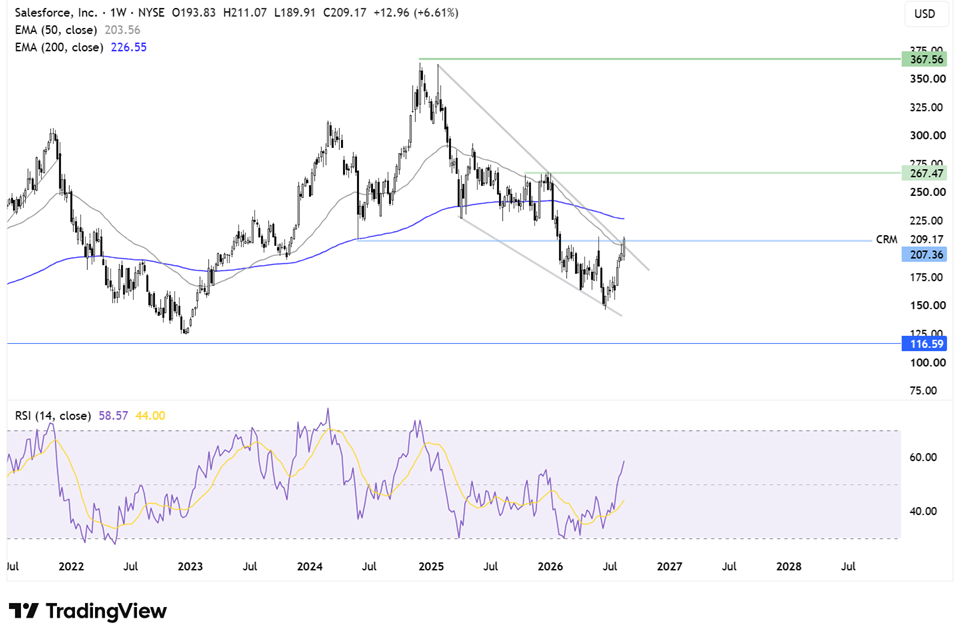
Salesforce is trading within a falling wedge pattern on the weekly chart.
The shares recovered from the 2026 low of $146 before moving back towards the 50 EMA, the falling trend line resistance and horizontal resistance around $210.
A break above $210 would confirm a breakout from the falling wedge and expose the 200 EMA around $226.
Above here, attention turns to $266, the 2026 high.
Failure to break above $210 could see the shares fall back towards $164, the April low, before $146, the 2026 low, comes into focus.
Strategy after BTC's 20% surge last week
After a huge week for crypto, investors will be watching to see whether Bitcoin can extend its gains and continue to lift crypto-related stocks.
Bitcoin gained more than 20% last week, its strongest weekly performance in more than two and a half years.
Several factors drove the move. One of the biggest catalysts was the Treasury Department's decision to increase buybacks of longer-dated government bonds.
The move helped ease pressure on long-term Treasury yields and created a more supportive liquidity backdrop, helping Bitcoin break above its 200 EMA.
At the same time, U.S. national debt crossing $40 trillion has increased concerns over the fiscal outlook and brought the debasement trade back into focus, supporting demand for alternative assets such as Bitcoin and gold.
Crypto sentiment has also benefited from the White House meeting between President Trump and major digital asset executives, while Trump has called on Congress to pass a fair version of the Clarity Act.
The Senate is expected to vote on the legislation in mid-September.
Greater regulatory clarity could ultimately support institutional demand by reducing some of the uncertainty surrounding digital assets.
Bitcoin ETF flows are also improving, with funds recording their strongest weekly inflows since late 2025.
The strength in Bitcoin helped Strategy gain around 30% last week.
The question now is whether the rally can continue once the initial liquidity boost and short covering have faded.
Attention will therefore turn to next week's Jackson Hole Symposium. Any indication from Federal Reserve Chair Kevin Warsh that policymakers remain concerned about inflation and are not ready to ease could quickly limit the upside in Bitcoin and crypto-related stocks.
On the other hand, a less hawkish message could support another leg higher, potentially taking Bitcoin above $80K and giving Strategy further room to extend its gains.
How to trade MSTR
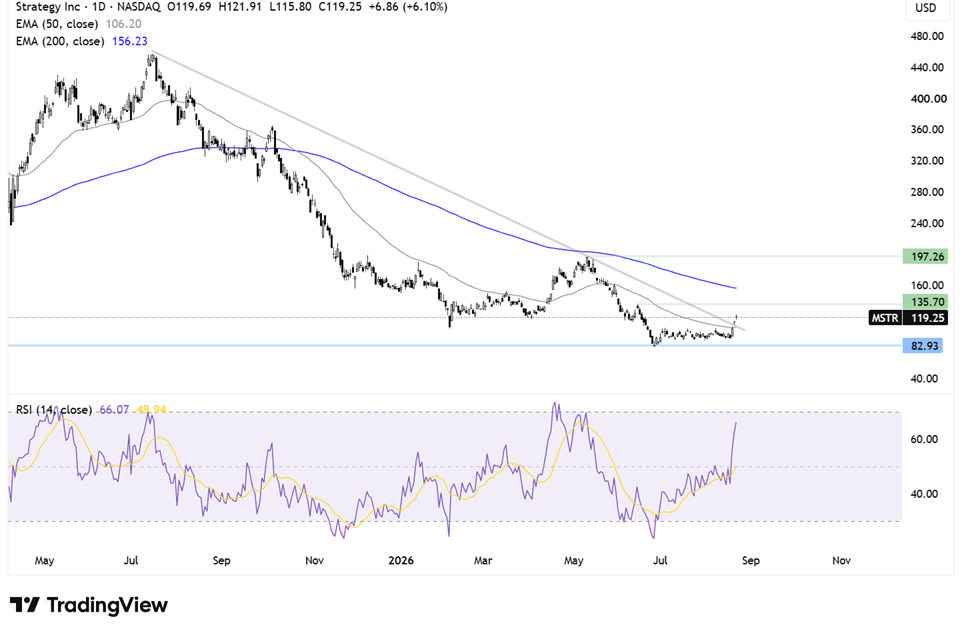
Strategy had been trending lower since July last year, falling from around $450 before reaching a low of $81 in June.
The shares then consolidated below $100 before breaking above the multi-month falling trend line and the 50 EMA. They are trading around $120 at the time of writing.
Buyers, supported by improving momentum, will look to extend gains towards $135, the mid-June high.
A break above $135 would expose the 200 EMA around $158, followed by $200.
On the downside, immediate support can be seen around $107, where the 50 EMA and falling trend line converge.
A break below $107 would weaken the near-term outlook, while a move below $81 would create a lower low and change the broader structure.
Related tags:
Latest market news











Web Trader platform
Our sophisticated web-based platform is packed with features.
Open an account today
Experience award-winning platforms with fast and secure execution.
Economic calendar
Related articles

Weekly Equities Outlook: Broadcom, Palo Alto Networks, Dell
Earnings this week from Broadcom, Palo Alto Networks and Dell week keep AI in focus.
Weekly Equities Outlook: Nvidia, Salesforce, Strategy
Earnings from Nvidia and Salesforce are in focus, as well as crypto stocks such as Strategy after Bitcoin's 20% jump last week.

Equities Weekly Outlook: Walmart, Home Depot and Target
Three major U.S. retailers report earnings this week, with Walmart, Home Depot and Target offering different views on the strength of the U.S. consumer.