



WTI Crude Oil Forecast: Can Prices Rebound or Is Another Leg Lower Ahead?
Crude oil prices reversed sharply after a 47% rally. Can WTI crude oil bounce from key support or is another drop looming?
Written by
Matt Simpson
Market Analyst
WTI crude oil saw a sharp 47% rally from the May low to the June high — but the fact that half of that move was unwound in just two sessions shouldn't be ignored. This rapid reversal raises the risk of another dip lower for crude oil prices, especially given the magnitude of the decline relative to the prior rally.
That said, short-term momentum has turned higher from a key support zone, favouring an initial bounce — something crude oil bears may want to monitor for signs of a swing high next week.
View related analysis:
Independence Day and OPEC Meeting Incoming
Please note that trading hours will be reduced due to the US Independence Day holiday. While exact times may vary by platform, US futures markets are expected to close at 12:00 PM EST on Friday and reopen at their usual time on Sunday night (Monday morning in Asia).
Also of note is the upcoming OPEC+ meeting on Sunday, which could trigger price gaps for WTI crude oil at Monday’s open. The market currently expects the oil cartel to announce an additional production increase of 411k barrels per day — a move that could limit upside potential for crude oil prices. However, any deviation from this guidance could surprise markets and fuel additional volatility.
WTI Crude Oil Technical Analysis: Support Levels in Play
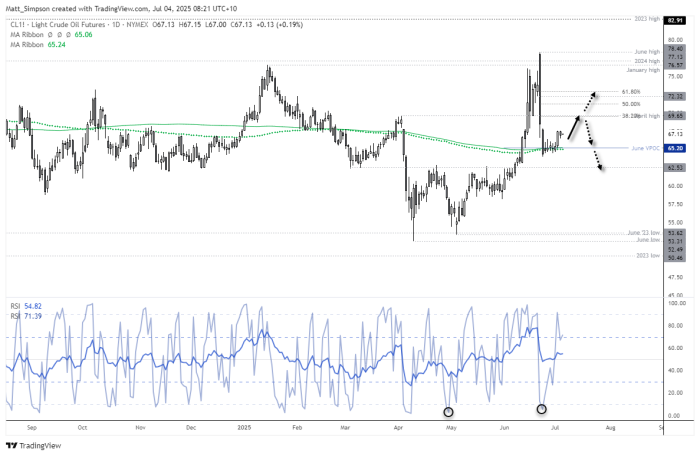
Chart analysis by Matt Simpson, Source: TradingView, ICE Futures, WTI Crude Oil
WTI crude oil has consolidated above the post-Israel–Iran ceasefire low, with price action holding near the $65 handle — a zone that also captures the 200-day EMA, 200-day SMA, and June’s volume point of control (VPOC).
The RSI (2) also reached its most oversold level since late April on June 24, suggesting that an interim swing low could be in place for crude oil.
WTI Crude Oil Trade Setup: Key Levels to Watch
• Bullish Scenario: Traders may seek dips above recent cycle lows or around $65 for tighter risk, targeting the April high near $69.65 in the short term.
• Bearish Scenario: A swing high around the 50–78.6% Fibonacci retracement levels (up to $72.50) could offer selling opportunities, with potential for crude oil prices to eventually break below the 200-day averages and revisit the $60 zone.
View the full economic calendar
-- Written by Matt Simpson
Follow Matt on Twitter @cLeverEdge
How to trade with City Index
You can trade with City Index by following these four easy steps:
- Open an account, or log in if you’re already a customer
• Open an account in the UK
• Open an account in Australia
• Open an account in Singapore
- Search for the market you want to trade in our award-winning platform
- Choose your position and size, and your stop and limit levels
- Place the trade
Related tags:







Web Trader platform
Our sophisticated web-based platform is packed with features.
Open an account today
Experience award-winning platforms with fast and secure execution.
Economic calendar
Related articles

AUD/CAD breakout puts the Bradman barrier in sight
A bullish breakout has pushed AUD/CAD to its highest level since early 2021. Whether it can clear 0.9994 may determine if the move extends well above parity.


Gold Falters at Resistance, Grappling With PCE, Month-End Flows and Jackson Hole
Gold has pulled back from resistance after sticky PCE data, with month-end flows and Jackson Hole now shaping the near-term outlook.

AUD/USD Nears 72c as AU and US CPI, Jackson Hole Loom
AUD/USD is closing in on 72c as Australian and US inflation reports collide with Jackson Hole, setting the stage for a potentially volatile end to the week.