


ASX 200 Market Outlook: Record High Rejected as Gold Sector Breaks Out
ASX 200 stalls beneath record highs as gold stocks surge, with XGD breaking higher while 9,125 caps the broader index.
Written by
Matt Simpson
Market Analyst
The ASX 200 has pulled back from record territory after printing a bearish reversal pattern just beneath the highs, while strength in spot gold has fuelled a breakout across the ASX gold sector. With the index trading below the 9,100–9,125 gamma resistance zone, attention now turns to whether gold stocks can continue to outperform even as broader market momentum softens.
View related analysis:
ASX 200 Record High Rejected as Gold Stocks Outperform
ASX 200 Market Snapshot
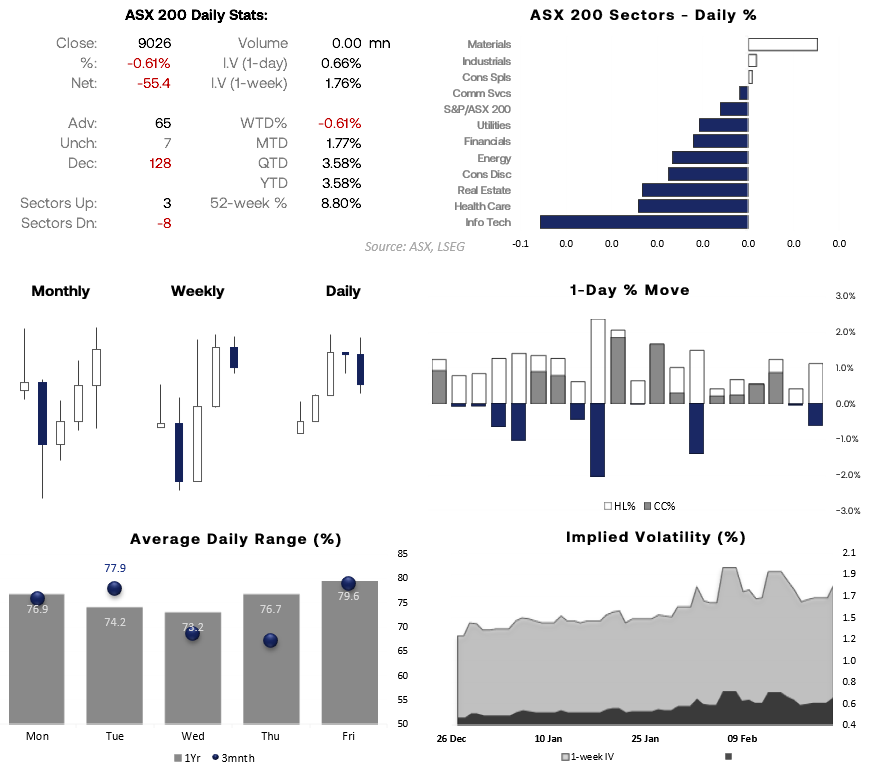
- Renewed tariff concerns saw the ASX 200 turn lower just beneath its record high on Monday, leaving a 3-bar bearish reversal pattern (Dark Cloud Cover) on the daily chart.
- Eight of the 11 ASX sectors declined, led by technology (XIJ), healthcare (XHJ) and real estate (XRE).
- Materials (XMJ) led the three sectors higher, although industrials (XNJ) and consumer staples (XSJ) posted only marginal gains.
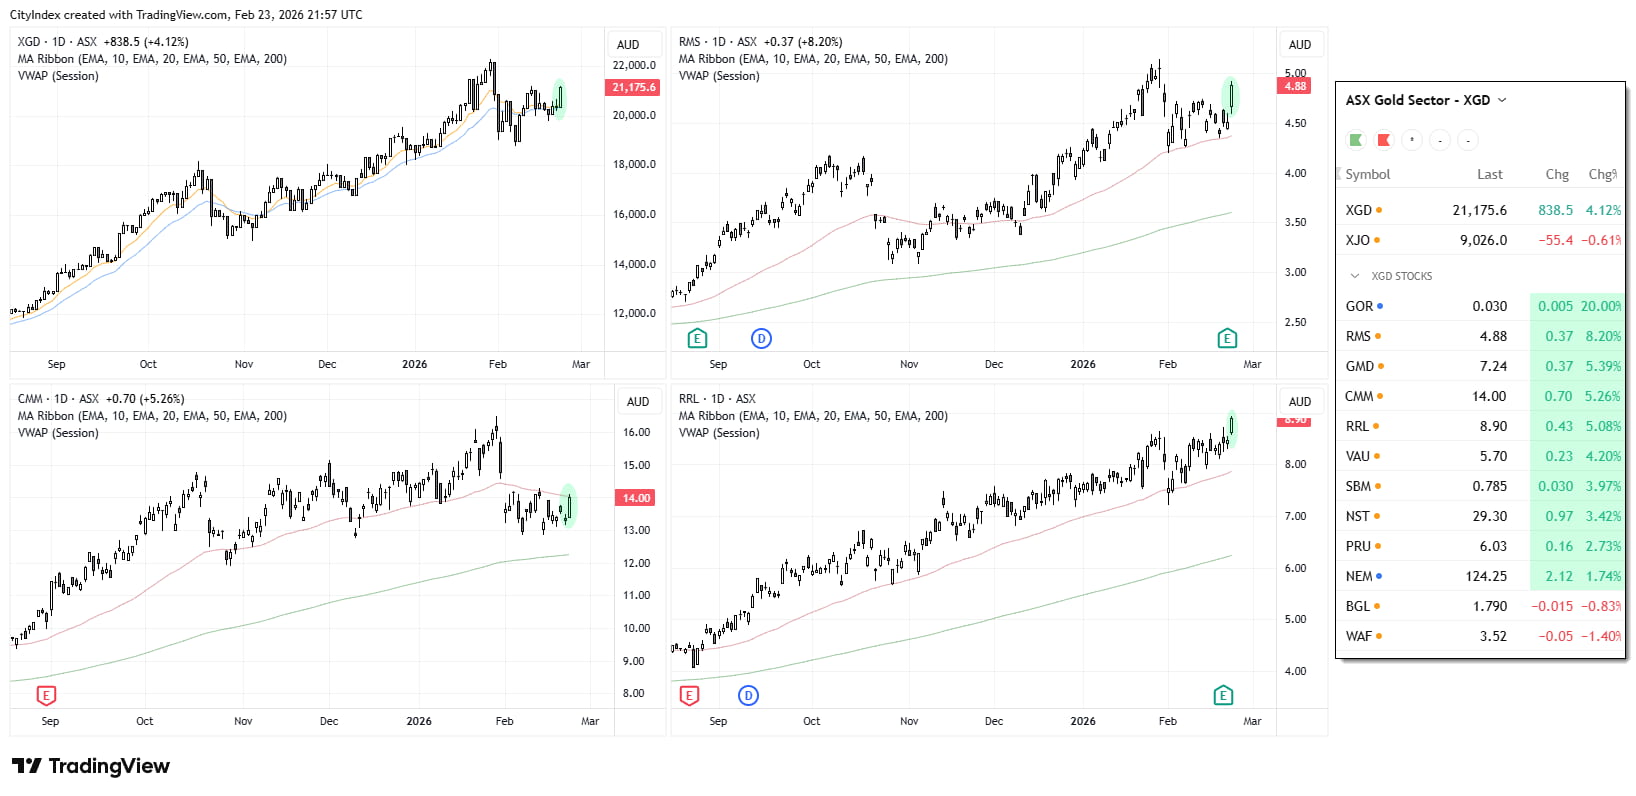
- Higher spot gold prices saw the ASX 300 Gold Index (XGD) rise 4.1%, with Ramelius Resources (RMS) up 8.2%, Capricorn Metals (CMM) +5.2%, and Regis Resources (RRL) reaching a record high.
- CSL closed below 150, its lowest level since April 2018.
- SPI 200 futures rose overnight despite a sell-off on Wall Street, suggesting the ASX cash market may open higher today.
Source: ASX, LSEG

ASX Gold Stocks Extend Rally as XGD Pushes Higher
The ASX Gold Index (XGD) continues to trend higher, supported by strength across key constituents such as Ramelius Resources (RMS), Capricorn Metals (CMM) and Regis Resources (RRL). Several charts are holding above their medium-term moving averages, reflecting sustained upside momentum following the lift in spot gold prices. While pullbacks remain possible after strong advances, the broader structure across the ASX gold sector remains constructive for now, with price action suggesting buyers continue to step in on dips.
Source: ASX, TradingView
ASX 200 Sector Correlations Highlight Cyclical Drivers
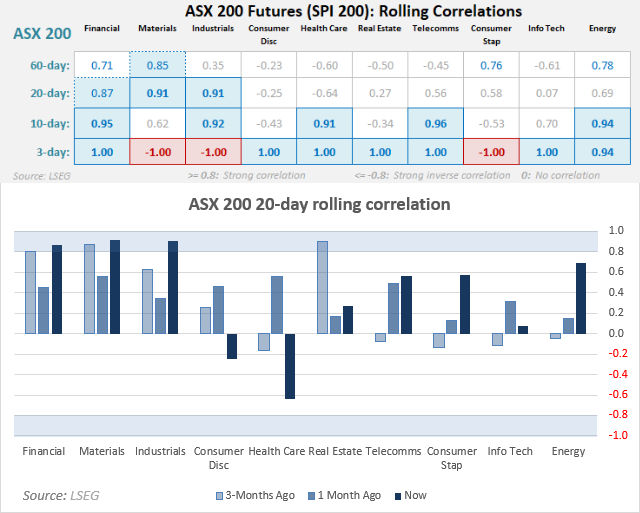
SPI 200 futures continue to show strong positive correlations with Financials and Materials on a 20-day basis, underlining how heavily the ASX 200 is driven by banks and miners. Shorter-term readings reveal sharper swings, including inverse correlations in Consumer Discretionary, highlighting shifting risk appetite beneath the surface. Overall, sector alignment suggests the index remains cyclical at heart, with sentiment-sensitive sectors exerting the greatest influence on near-term price action.
Source: ASX, LSEG

ASX 200 Technical Analysis
ASX 200 Gamma Levels: 9,100–9,125 Key Resistance Zone
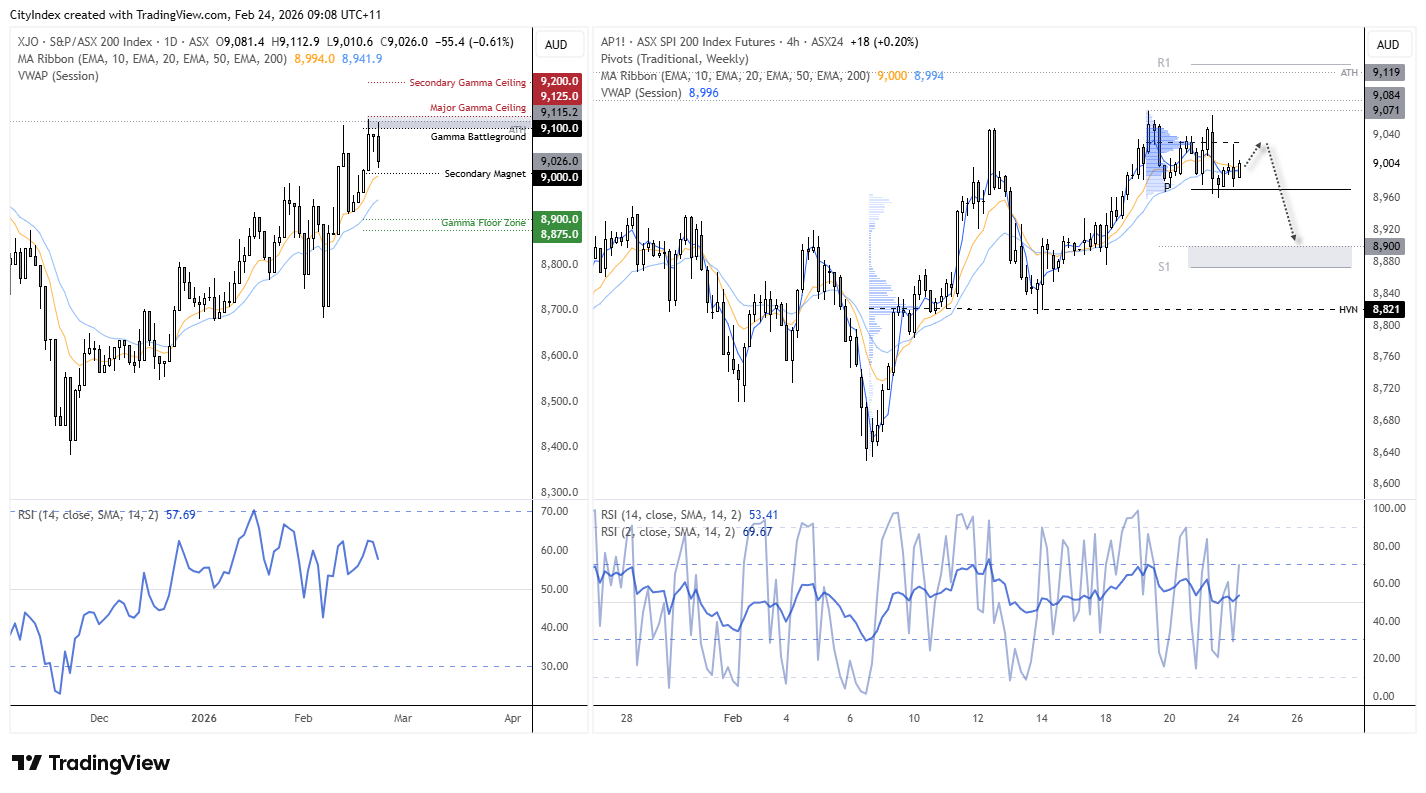
The 9,100–9,125 region remains the primary gamma battleground for the ASX 200 cash index, with options positioning suggesting heavier dealer hedging flows overhead. A sustained push above 9,125 could expose 9,200, while failure to hold 9,100 keeps the 9,000 magnet in focus.
Beneath that, the 8,900–8,875 zone marks the next meaningful pocket of support from a gamma perspective. As always, gamma levels reflect positioning dynamics rather than certainty, and broader macro drivers can override these zones.
 Source: ASX, TradingView
ASX 200 Outlook: Downside Risks While Below 9,125
With sentiment appearing fragile and the ASX 200 trading beneath this key resistance band, the near-term outlook for the Australian share market has softened. The 9,100 area had acted as a key options pivot, and failure to reclaim it leaves the index vulnerable to supply on rallies.
Technically, rebounds toward 9,100–9,125 may continue to attract selling pressure while the ASX 200 remains capped below that ceiling. A decisive break beneath the monthly pivot and recent swing lows would increase the probability of a move toward 8,900 — just above monthly S1 and a visible prior demand zone on the daily chart.
A sustained move back above 9,125 would weaken the bearish case. Until then, risks remain skewed toward a deeper retracement.
View the full economic calendar
-- Written by Matt Simpson
Follow Matt on Twitter @cLeverEdge
How to trade with City Index
You can trade with City Index by following these four easy steps:
- Open an account, or log in if you’re already a customer
• Open an account in the UK
• Open an account in Australia
• Open an account in Singapore
- Search for the market you want to trade in our award-winning platform
- Choose your position and size, and your stop and limit levels
- Place the trade
Related tags:







Web Trader platform
Our sophisticated web-based platform is packed with features.
Open an account today
Experience award-winning platforms with fast and secure execution.
Economic calendar
Related articles

Euro Short-term Outlook: EUR/USD Pullback Nears Pivotal Uptrend Support 8 28 2026
Warsh's comments accelerated the EUR/USD selloff, raising the stakes as buyers look to stabilize the broader recovery.


Gold and S&P 500 analysis: What now after Warsh’s hawkish speech?
The dollar surged across the board after the Fed Chair Kevin Warsh surprised with a hawkish-leaning speech at the Jackson Hole summit. All the bearish dollar bets that had been accumulated since last Friday on the back of data weakness and bond market troubles had to be squared and that triggered a short squeeze rally for the dollar. Gold and silver dropped, as a result, as too did bitcoin, while US indices were giving back earlier gains.


EUR/USD forecast: All eyes on Warsh at Jackson Hole - Forex Friday
For much of this week, the EUR/USD has been edging lower with the US dollar regaining some ground after last week’s sell-off that was triggered, in part, by the bond market worries. Investors have been unwilling to bet further against the US dollar so far this week ahead of Kevin Warsh’s keynote speech at the Jackson Hole summit, due later today.