


ASX 200 Outlook: Potential Bull Flag Forms Beneath Record Highs
The ASX 200 forms a potential bull flag beneath record highs, while options expiry and futures positioning could add volatility.
Written by
Matt Simpson
Market Analyst
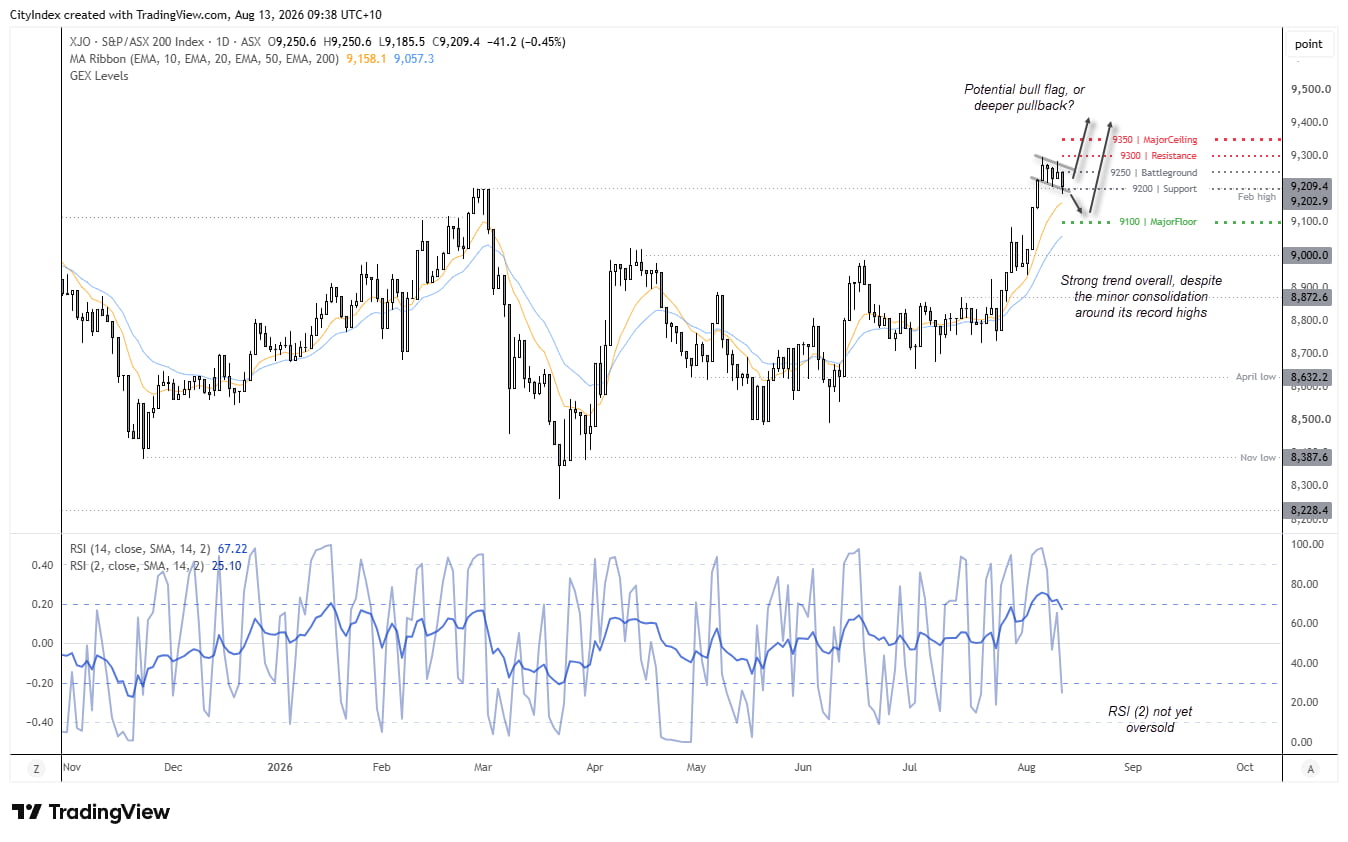
The ASX 200 is consolidating just beneath its record highs, with the shallow four-day pullback forming a potential bull flag on the daily chart. While options expiry could add some unpredictability to today’s price action, the broader bullish trend remains intact.
View related analysis:
ASX 200 Bull Flag Takes Shape Below Record Highs
The daily chart shows a potential bull flag forming on the ASX 200 cash market, just beneath its record highs. The four-day retracement has been shallow, but has lasted long enough to suggest bulls may at least try to make another run at a new high.
That said, it is options expiry day for the one-week tenure, which can add a little more unpredictability to price action.
Looking at options clusters for potential support and resistance suggests 9200–9300 may be an important area today, with put open interest concentrated around 9100 providing a potential floor, while strong call open interest around 9300–9350 creates an upside ceiling. With today’s options expiring, however, these levels can lose relevance quickly after expiry.
Looking ahead to next Thursday, the options structure is more clearly defined: 9100 looks like the main downside floor, while 9300–9350 forms a sizeable upside ceiling. The concentration of call open interest at 9300 and 9350 suggests rallies could face increasing resistance in this zone unless price can establish acceptance above it.
Source: ASX, TradingView
SPI 200 Futures Point to a Modest Pullback
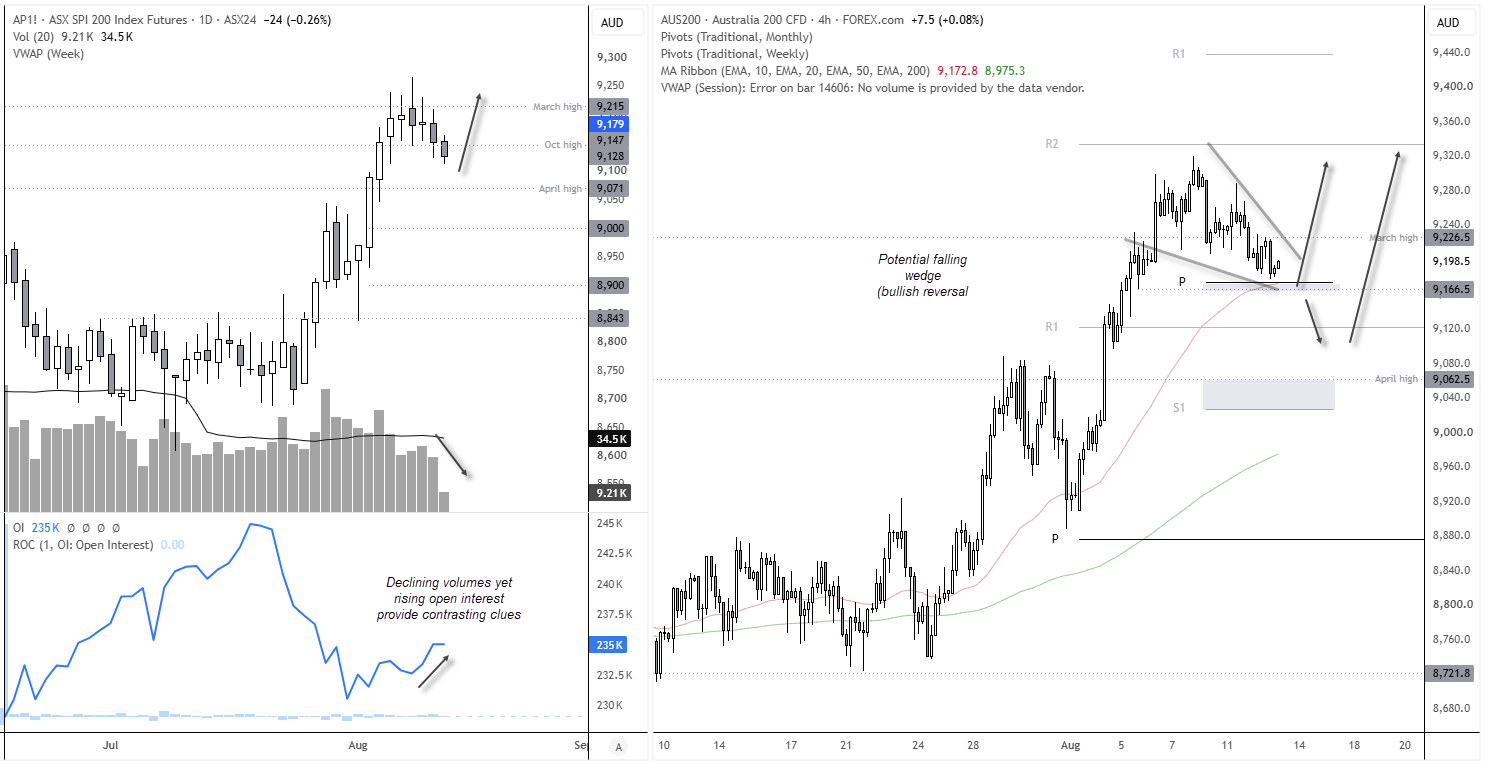
ASX 200 futures were lower overnight, so the cash market should open just beneath its February high. Daily trading volumes are in decline, which suggests bears are not getting behind the move. This contrasts with rising open interest, which suggests futures traders are leaning into the move lower. While we wait to see how these measures of activity evolve, it is worth remembering that the broader bullish trend remains strong. That makes it more a question of whether this is a minor or deeper pullback, as my bias is for new highs in the coming weeks until momentum says otherwise.

ASX 200 4Hour Chart Shows Potential Falling Wedge
The ASX 200 40-hour chart shows a potential falling wedge pattern, which is a bullish reversal pattern in an uptrend. Note prices are holding above the weekly pivot point for now, so let’s see how prices behave after the open and whether they can re-establish a potential swing low soon.
If momentum turns lower, bulls could seek evidence of a swing low around the monthly R1 pivot (9120) or April high (9062.5).
Source: ASX24, TradingView
View the full economic calendar
-- Written by Matt Simpson
Follow Matt on Twitter @cLeverEdge
How to trade with City Index
You can trade with City Index by following these four easy steps:
- Open an account, or log in if you’re already a customer
• Open an account in the UK
• Open an account in Australia
• Open an account in Singapore
- Search for the market you want to trade in our award-winning platform
- Choose your position and size, and your stop and limit levels
- Place the trade
Related tags:







Web Trader platform
Our sophisticated web-based platform is packed with features.
Open an account today
Experience award-winning platforms with fast and secure execution.
Economic calendar
Related articles

Euro Short-term Outlook: EUR/USD Pullback Nears Pivotal Uptrend Support 8 28 2026
Warsh's comments accelerated the EUR/USD selloff, raising the stakes as buyers look to stabilize the broader recovery.


Gold and S&P 500 analysis: What now after Warsh’s hawkish speech?
The dollar surged across the board after the Fed Chair Kevin Warsh surprised with a hawkish-leaning speech at the Jackson Hole summit. All the bearish dollar bets that had been accumulated since last Friday on the back of data weakness and bond market troubles had to be squared and that triggered a short squeeze rally for the dollar. Gold and silver dropped, as a result, as too did bitcoin, while US indices were giving back earlier gains.


EUR/USD forecast: All eyes on Warsh at Jackson Hole - Forex Friday
For much of this week, the EUR/USD has been edging lower with the US dollar regaining some ground after last week’s sell-off that was triggered, in part, by the bond market worries. Investors have been unwilling to bet further against the US dollar so far this week ahead of Kevin Warsh’s keynote speech at the Jackson Hole summit, due later today.