


ASX 200 Rebounds, But Resistance Looms
The ASX 200 has rebounded from the July low, but resistance around 8800 and 8875 could test the recovery.
Written by
Matt Simpson
Market Analyst
The ASX 200 has bounced from the July low after falling nearly 7% from its record high, supported by a bullish RSI divergence and firmer Wall Street sentiment. But with resistance clustered around 8800 and 8875, the rebound may soon face a more meaningful test.
ASX 200 Rebound Faces Resistance Around 8800
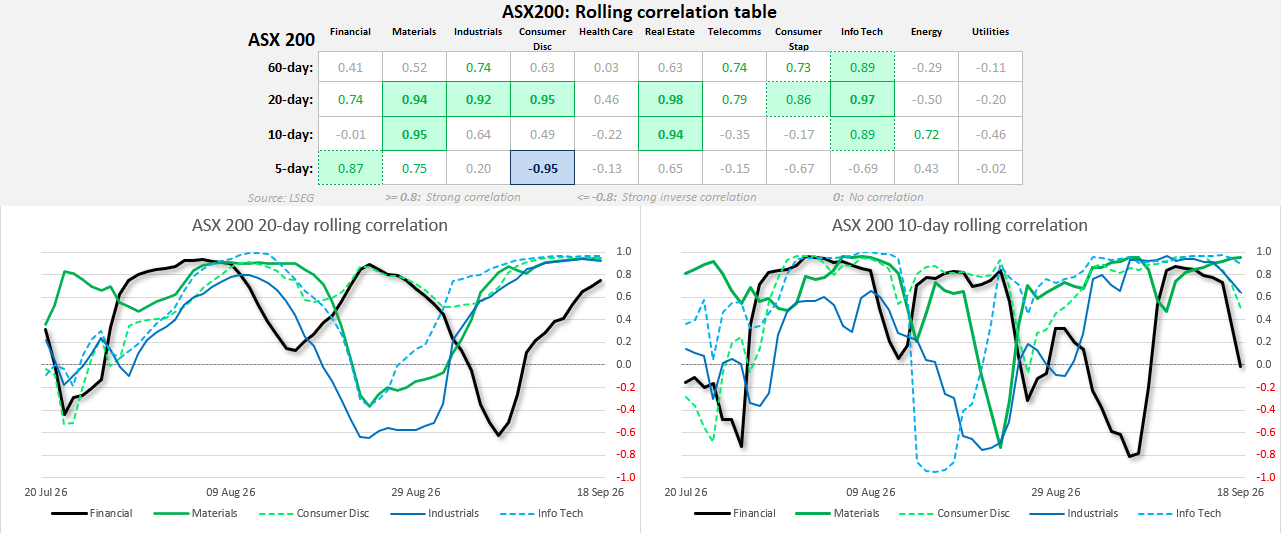
The ASX has fallen nearly 7% since reaching its record high just over five weeks ago. Correlations between sectors and the broader index strengthened sharply as macro themes took hold, but the ASX has since found support around the July low, accompanied by a bullish RSI divergence.
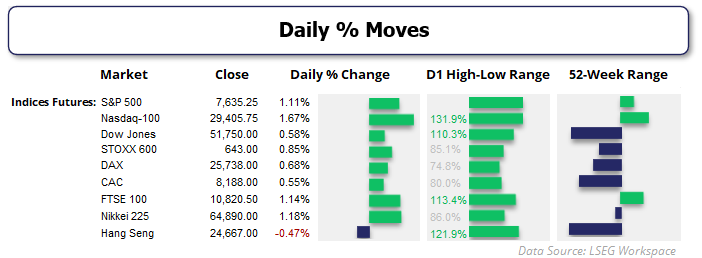
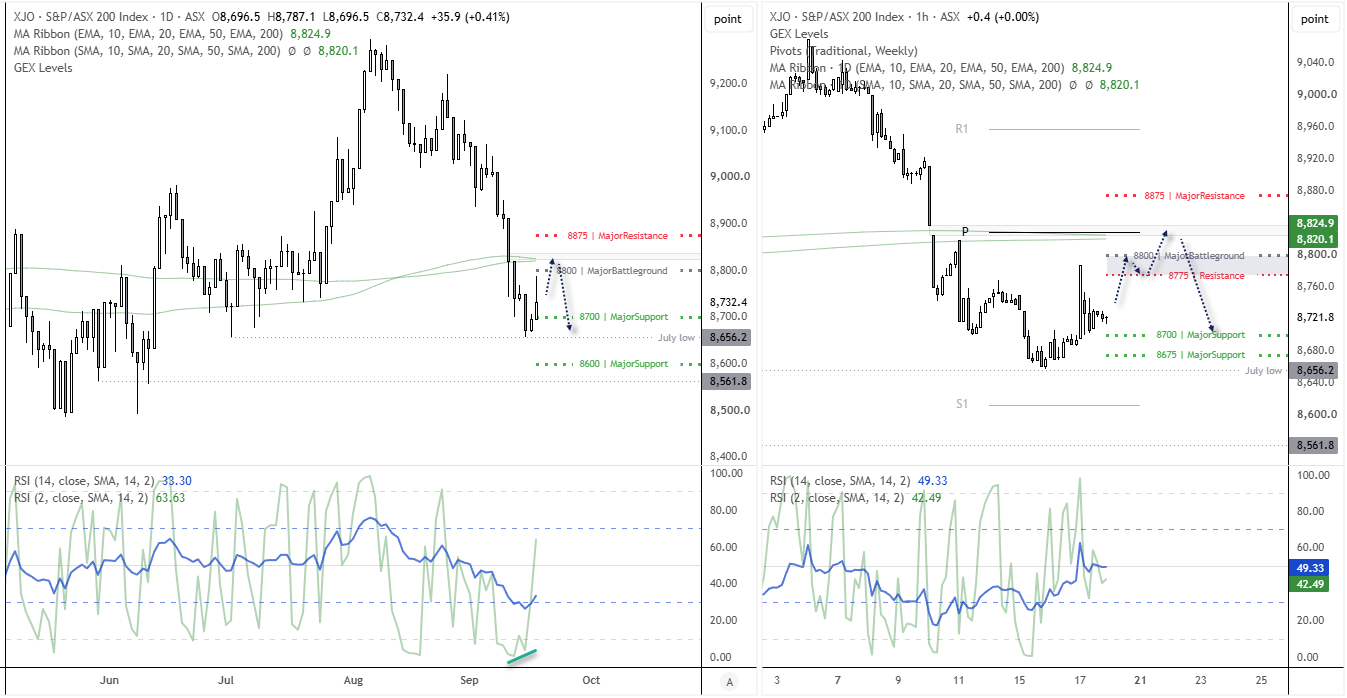
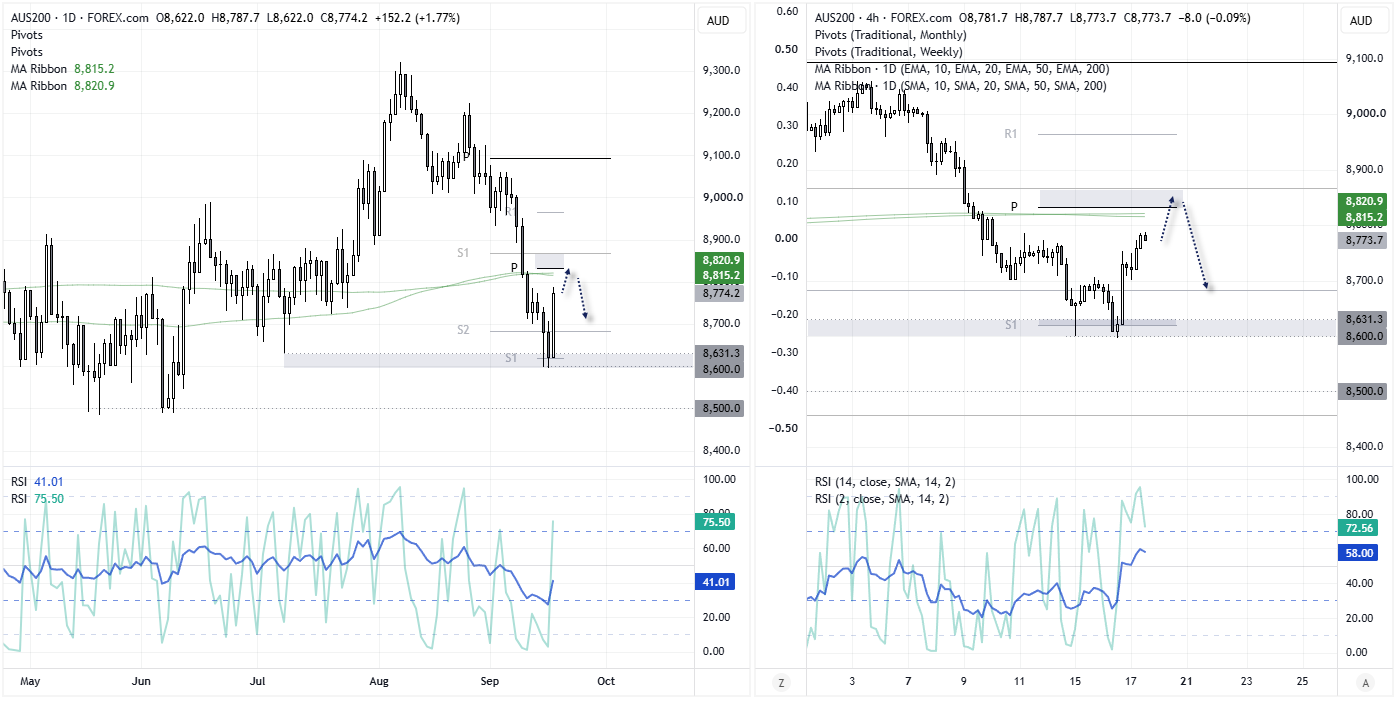
With Wall Street also regaining bullish momentum, the rebound could have further to run over the near term. The daily chart points to 8800 as the main upside pivot, with 8875 the broader resistance level if the recovery extends. Above current prices, the 200-day averages just above 8800 could also provide an important technical test.
Source: ASX, TradingView
- 8775 is the first resistance level, followed by the more important 8800 battleground.
- A clean break above 8800 would bring 8875 into focus.
- On the downside, 8700 is the key support level, with 8675 providing the next line of defence if selling resumes.
- On the daily timeframe, 8600 is the more relevant deeper support should volatility expand materially.
This content was created by an affiliate of FOREX.com and represents the views and opinions of the author/speakers, not the views and opinions of FOREX.com, StoneX Group Inc., or its subsidiaries. The content has not been independently reviewed by FOREX.com.
Source: Forex.com, TradingView
ASX 200 Sector Correlations Ease as Selloff Loses Momentum
The fact that correlations between the ASX and its sectors are no longer at extremes could be a sign that the worst of this phase of the selloff is behind us. This could mean lower volatility and choppier price action than we saw during the recent decline.
That is useful information when managing expectations and choosing strategies. And with the weekend approaching, intraday setups may be preferable, alongside tighter risk management and more conservative targets. We can then reassess conditions next week.
Source: LSEG
Related tags:
Latest market news











Web Trader platform
Our sophisticated web-based platform is packed with features.
Open an account today
Experience award-winning platforms with fast and secure execution.
Economic calendar
Related articles

Gold and S&P 500 analysis: What now after Warsh’s hawkish speech?
The dollar surged across the board after the Fed Chair Kevin Warsh surprised with a hawkish-leaning speech at the Jackson Hole summit. All the bearish dollar bets that had been accumulated since last Friday on the back of data weakness and bond market troubles had to be squared and that triggered a short squeeze rally for the dollar. Gold and silver dropped, as a result, as too did bitcoin, while US indices were giving back earlier gains.


EUR/USD forecast: All eyes on Warsh at Jackson Hole - Forex Friday
For much of this week, the EUR/USD has been edging lower with the US dollar regaining some ground after last week’s sell-off that was triggered, in part, by the bond market worries. Investors have been unwilling to bet further against the US dollar so far this week ahead of Kevin Warsh’s keynote speech at the Jackson Hole summit, due later today.

Nasdaq 100 forecast: Tech stocks shine as Nvidia results underpin AI trade
Much of this week’s attention has been on Nvidia’s earnings, and the chipmaker delivered the sort of numbers of investors had been hoping for. US index futures initially wobbled before moving higher overnight, with the results providing a fresh lift to the AI trade