
Australian Dollar Outlook: AUD/USD, AUD/JPY and AUD/NZD Setups
AUD/USD, AUD/JPY and AUD/NZD react to stronger risk sentiment, with major resistance levels likely to determine the Australian dollar's next move.
Written by
Matt Simpson
Market Analyst
Improving risk sentiment helped lift the Australian dollar after easing Middle East tensions and stronger US economic data. While AUD/USD, AUD/JPY and AUD/NZD all advanced, each cross is approaching important technical levels that could determine whether the rally extends or fades.
View related analysis:
Risk Sentiment Drives the Australian Dollar Higher
Middle East Optimism Lifts Global Risk Sentiment
Prospects that the Strait of Hormuz could reopen boosted risk appetite on Tuesday, lifting Wall Street sentiment. ISM manufacturing PMI also edged higher to 55.6 from 53.3. Employment expanded, new orders ticked higher and prices paid ticked lower, albeit from elevated levels. The S&P 500 and Dow Jones reached record highs, while the Nasdaq closed in on 30,000. The SPI 200 rose 0.4% overnight, which should see the ASX 200 gap higher and place its all-time high within a day's typical trading range.
Antipodeans Lead as Yen Lags
AUD/USD and NZD/USD were the strongest FX majors as the antipodeans embraced the positive lead from the Middle East headlines. Whether that proves to be another false start, however, risks reversing that sentiment. The Japanese yen was the weakest FX major, although its losses were marginal as traders likely remained wary of betting against the combined might of the MOF and the Fed. USD/JPY edged higher in line with yesterday's bias, although resistance emerged around the first zone, which includes the 200-day moving averages near 157.80. I suspect bears are seeking evidence of swing highs around resistance levels, with 158.00, 159.00 and 159.40 the main contenders.
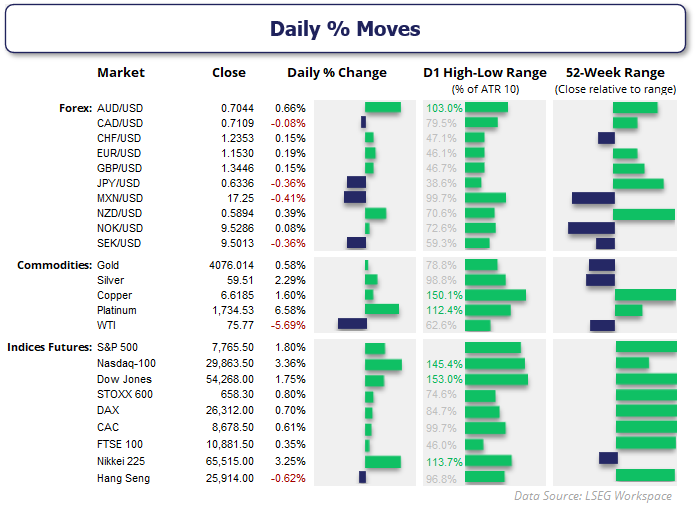
Source: LSEG
Australian Dollar Technical Setups
AUD/USD Presses Against Key Resistance
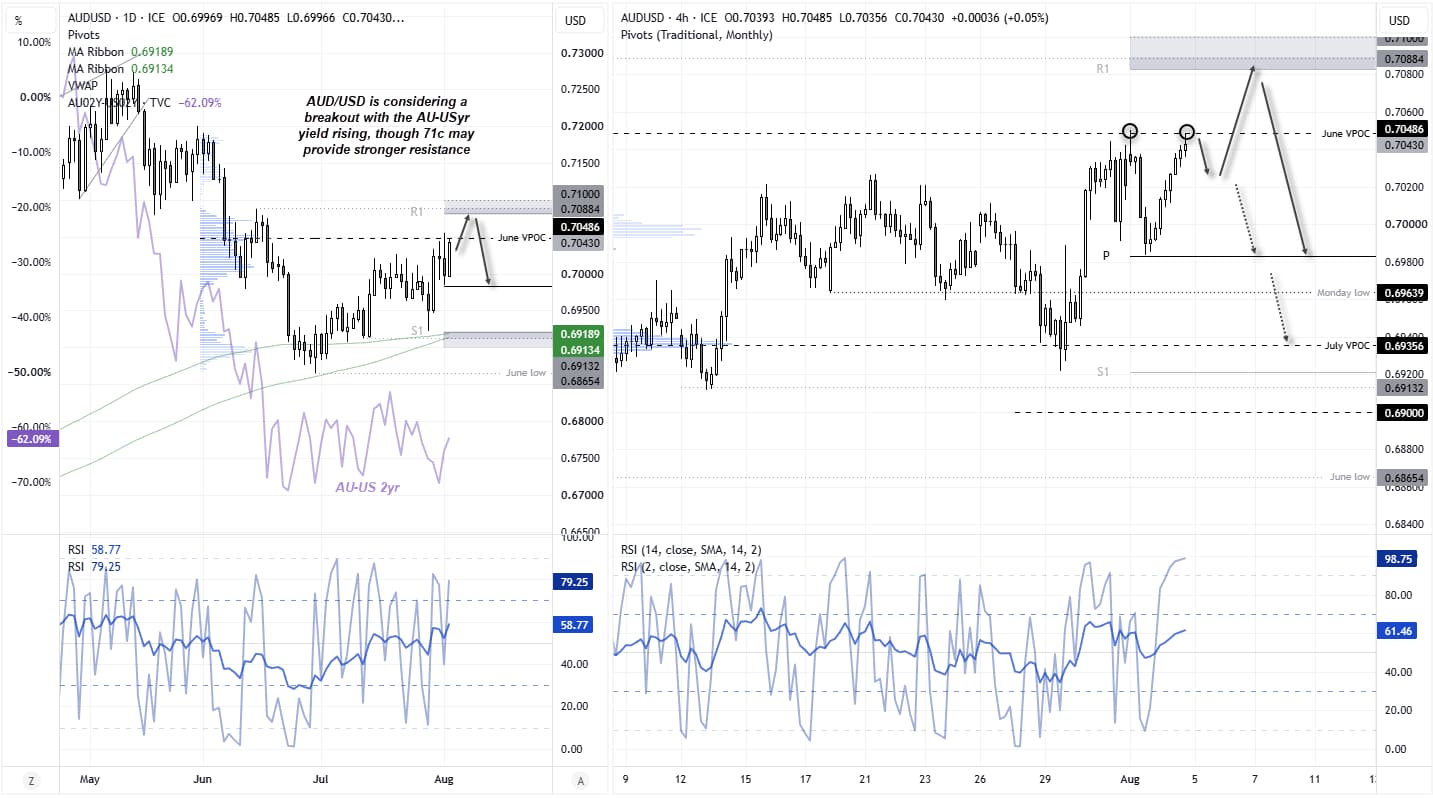
The Aussie has so far held up well against the US dollar's mild bullish retracement. Given the AU-US two-year yield spread has risen so far this week, perhaps a breakout is on the cards in the near term. For now, AUD/USD continues to respect the June VPOC as resistance, and even if bulls break above it, they still have the monthly R1 pivot point and the June 15 high to contend with. A break above 0.7100 could provide the first real test of this risk-on rally.
For now, however, my bias remains for a swing high to form and for AUD/USD to snap its four-week winning streak. The RBA seems unlikely to hike again this cycle, while futures traders continue to increase their bearish bets against the Australian dollar, according to recent Commitment of Traders (COT) data.
Source: ICE, TradingView

AUD/JPY Bounce Faces Heavy Resistance
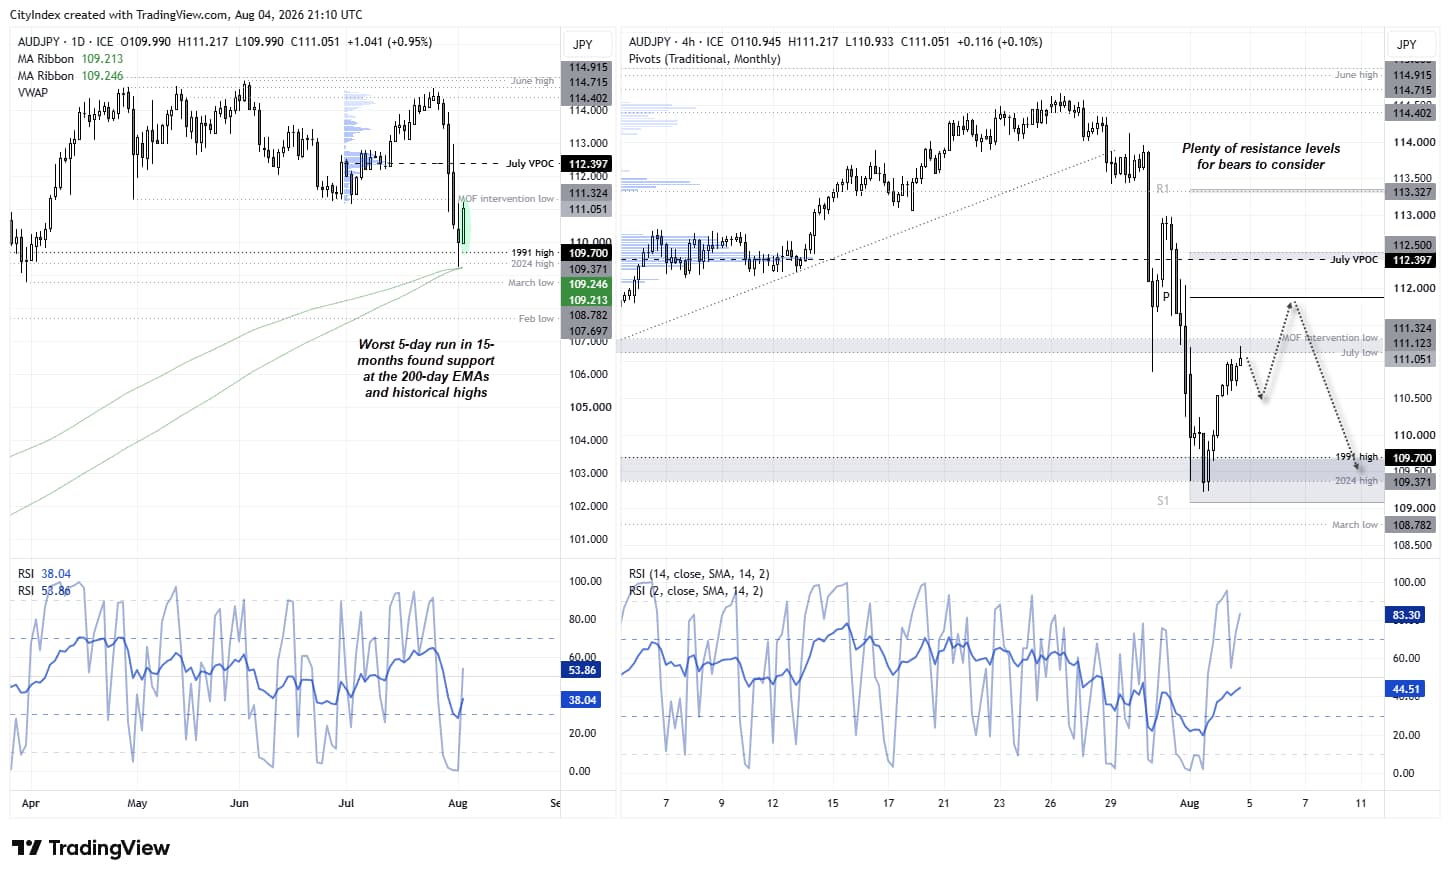
After its worst five-day run in 15 months, AUD/JPY found support at its 200-day moving averages and formed a bullish engulfing day. Under normal circumstances, this could provide the foundation for a decent rebound, but traders are right to remain wary of betting against the Japanese yen too aggressively given the scale of currency intervention over the past week. I therefore suspect that, as with USD/JPY, bears may be looking to fade rallies around resistance levels.
Tuesday's high stalled around the July low, the 111.00 handle and the prior intervention level. The monthly pivot point also sits just beneath the 112.00 handle, while the July VPOC is near 112.50. Ultimately, bears have several notable resistance levels to monitor for evidence of a potential swing high.
Source: ICE, TradingView

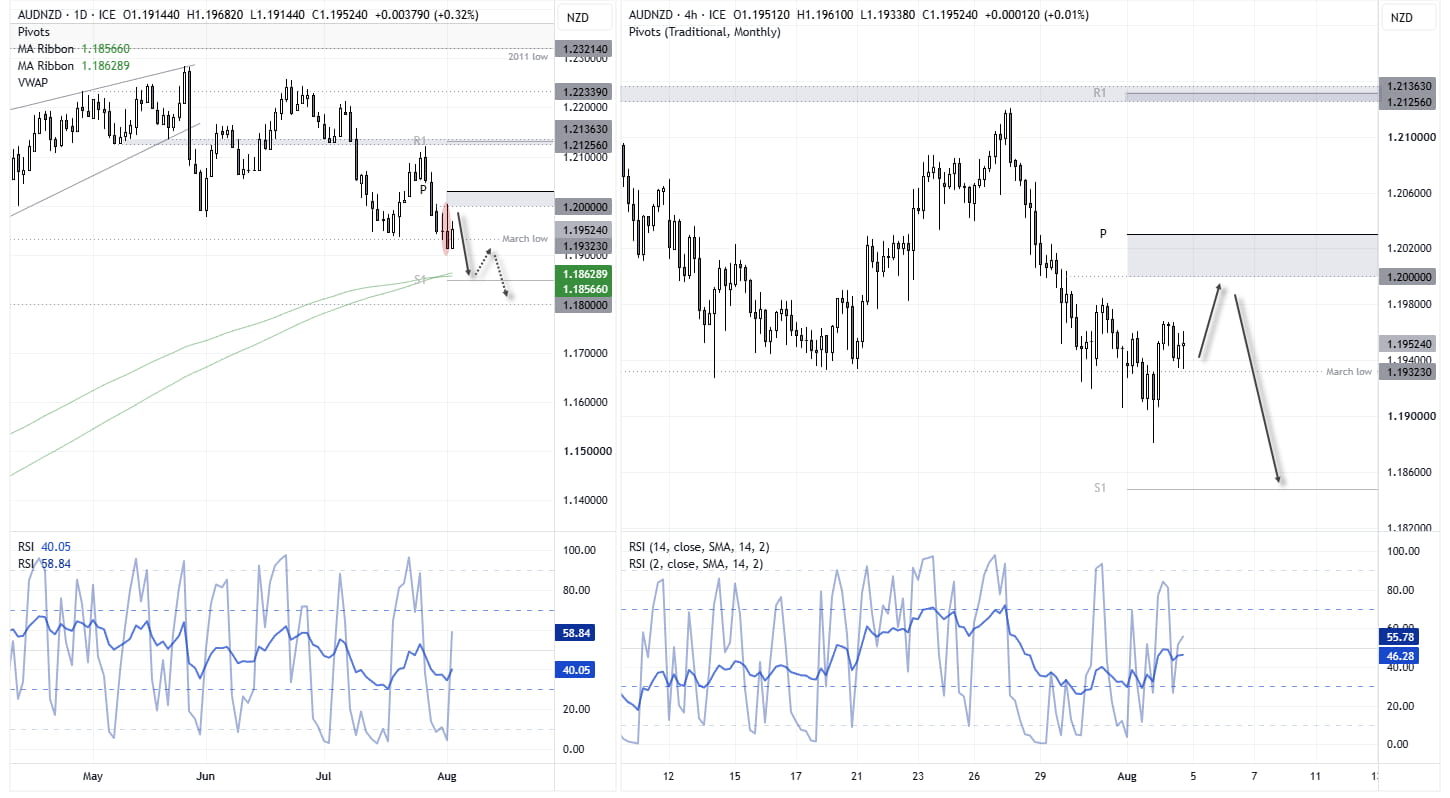
AUD/NZD Bears Defend the 1.20 Handle
The Aussie is in a clear downtrend against the Kiwi dollar on the daily chart, although it is trying to form a swing low. Monday's bearish outside candle met resistance at the 1.20 handle before closing beneath the March low, although Tuesday's bullish inside day suggests a tentative attempt to form a trough.
Today's New Zealand employment figures could determine whether hawkish RBNZ bets help push AUD/NZD towards the 200-day moving averages at 1.1556, or whether bulls have another crack at 1.20. But until we see a break or daily close above 1.20, risks remain skewed to the downside, with a break beneath the 200-day moving averages bringing 1.18 into focus.
Source: ICE, TradingView
View the full economic calendar
-- Written by Matt Simpson
Follow Matt on Twitter @cLeverEdge
How to trade with City Index
You can trade with City Index by following these four easy steps:
- Open an account, or log in if you’re already a customer
• Open an account in the UK
• Open an account in Australia
• Open an account in Singapore
- Search for the market you want to trade in our award-winning platform
- Choose your position and size, and your stop and limit levels
- Place the trade
Related tags:
Latest market news









Web Trader platform
Our sophisticated web-based platform is packed with features.
Open an account today
Experience award-winning platforms with fast and secure execution.
Economic calendar
Related articles

Gold and S&P 500 analysis: What now after Warsh’s hawkish speech?
The dollar surged across the board after the Fed Chair Kevin Warsh surprised with a hawkish-leaning speech at the Jackson Hole summit. All the bearish dollar bets that had been accumulated since last Friday on the back of data weakness and bond market troubles had to be squared and that triggered a short squeeze rally for the dollar. Gold and silver dropped, as a result, as too did bitcoin, while US indices were giving back earlier gains.


EUR/USD forecast: All eyes on Warsh at Jackson Hole - Forex Friday
For much of this week, the EUR/USD has been edging lower with the US dollar regaining some ground after last week’s sell-off that was triggered, in part, by the bond market worries. Investors have been unwilling to bet further against the US dollar so far this week ahead of Kevin Warsh’s keynote speech at the Jackson Hole summit, due later today.

Nasdaq 100 forecast: Tech stocks shine as Nvidia results underpin AI trade
Much of this week’s attention has been on Nvidia’s earnings, and the chipmaker delivered the sort of numbers of investors had been hoping for. US index futures initially wobbled before moving higher overnight, with the results providing a fresh lift to the AI trade