

Australian Dollar Outlook: AUD/USD in the Hands of the RBA and US CPI
AUD/USD could extend its six-week rally, but the RBA and US CPI may determine whether the Aussie can break higher or stalls near 71c.
Written by
Matt Simpson
Market Analyst
The Australian dollar enters the week on a six-week winning streak, but the rally could face an important test from the RBA and US CPI. Markets have priced out a near-term RBA hike following softer Q2 inflation, leaving the US dollar and incoming US data increasingly important for AUD/USD. A weak CPI print could undermine Fed hike expectations and give the Aussie room to push higher, while a hotter result could support the US dollar and limit gains around 71c.
View related analysis:
Australian Dollar Outlook: RBA and US CPI Set the Tone
US Jobs Growth Contracts as Hiring Weakens
Expectations for a September Fed rate cut were lowered once again following a weak nonfarm payrolls report. NFP job growth fell 23k – its first contraction in six months – missing the 85k estimate. June’s NFP was downgraded to 20k from 57k, while private payrolls slowed to 30k, missing the 78k expected, with June’s figure slashed to 330k from 48k. Healthcare and social assistance – which has accounted for around 80% of total job growth over the past 18 months – rose by a mere 22k, government jobs fell 53k and retail trade was down 19.4k. While unemployment fell to 4.1%, the focus was on growth – or lack thereof.
Fed fun futures now imply a 57% of no rate change in September, from a 54% chance of a hike before NFP. October hike odds are now 47%.
The US dollar was broadly lower on Friday and the weakest FX major, seeing the USD index form a bearish engulfing candle and weakest close in two months. Gold surged to a 7-week high during its best week 9 in 28.
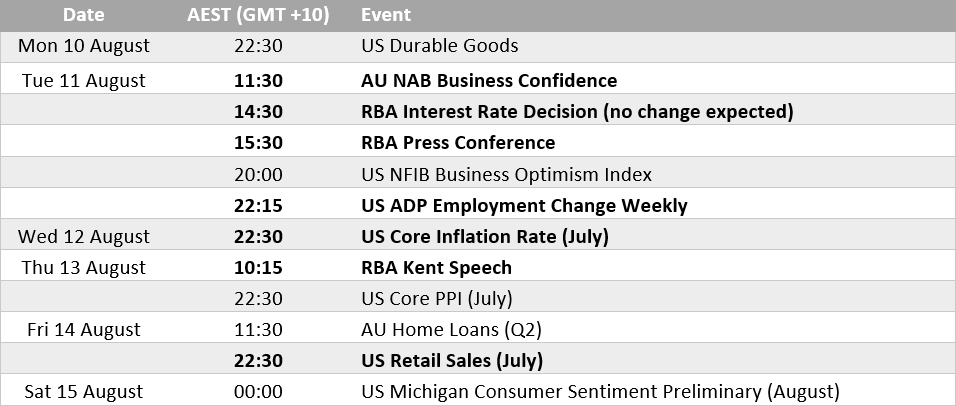

Australia This Week: Economic Data and Events for AUD/USD Traders
RBA To Deliver a Hawkish Hold?
Markets have effectively priced out a hike from the RBA this week following weaker-than-expected Q2 CPI figures two weeks ago. The OIS curve still suggests an 89% chance of a single 25bp hike within one year, however. The RBA’s tone could therefore shape expectations for that hike, but few are expecting one anytime soon.
Inflation remains firmer than the RBA would like and above its target band, which should force it to retain a hawkish bias tomorrow. But unless crude oil prices rip higher again due to another flare-up in the Middle East peace process, it seems likely that the RBA’s cash rate may have peaked at 4.35% for now. That said, it seems unlikely the RBA will tank the Australian dollar with a dovish tone.
The Australian dollar may therefore take its directional cue from a weaker US dollar rather than hawkish RBA expectations. This could see the Aussie grind higher without going on a tear, although resistance looms for AUD/USD and support is nearby for the US dollar index.
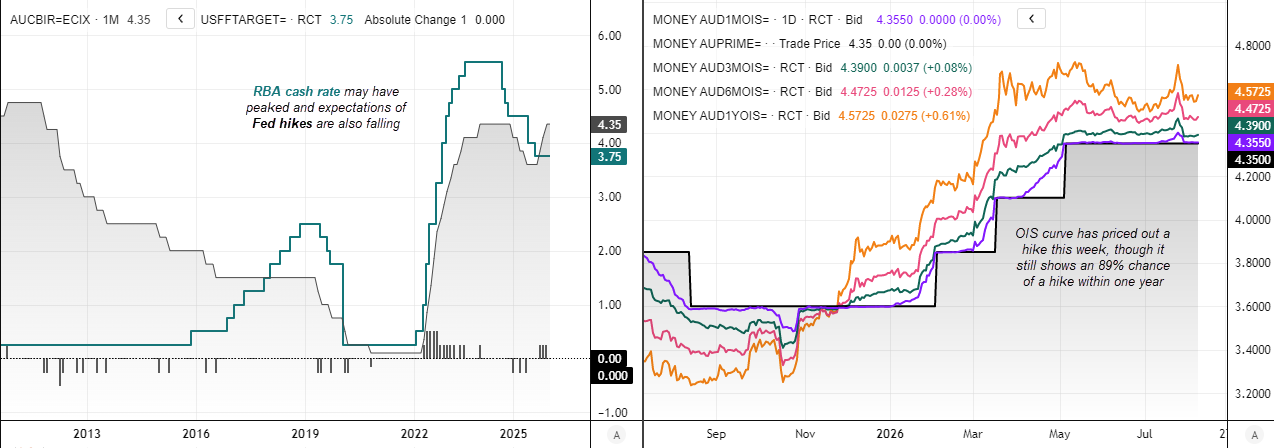
Source: LSEG
This content was created by an affiliate of FOREX.com and represents the views and opinions of the author/speakers, not the views and opinions of FOREX.com, StoneX Group Inc., or its subsidiaries. The content has not been independently reviewed by FOREX.com.
Traders will be on high alert for any pockets of weakness in incoming US data following the latest NFP miss. Core CPI will be top of the list, especially as ISM services prices paid have fallen from elevated levels and crude oil prices are lower than they could have been. Even a vaguely weak inflation print could crush hopes of another Fed hike, send the US dollar lower and lift risk appetite, allowing AUD/USD to rally along for the ride.
Traders will then shift their focus to producer prices and retail sales, with any signs of weakness potentially backing bets to short the US dollar. So, US inflation data could hold the key to the Australian dollar’s direction this week. An upside CPI surprise could muddy the waters, help the US dollar recover and stifle the AUD/USD rally around 71c.
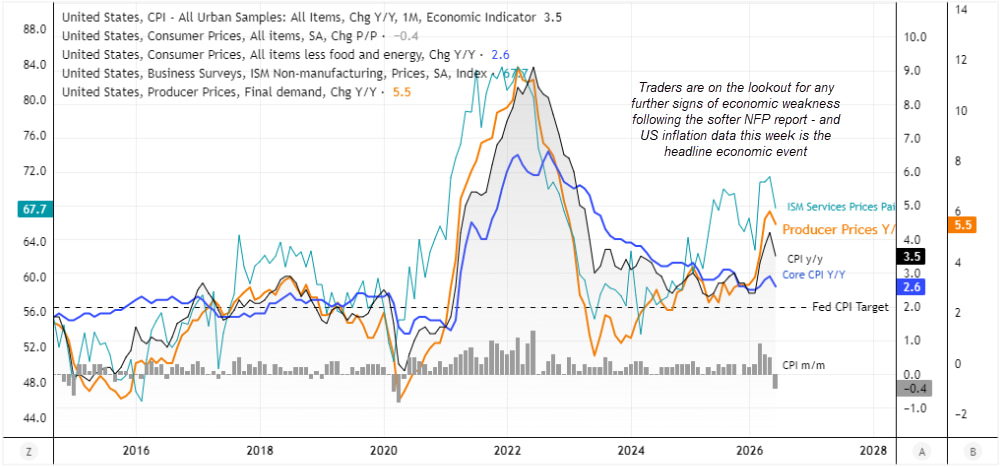
Source: BLS, ISM, LSEG
Australian Dollar Performance
It has been a bullish month for the Aussie overall, although its performance has been uneven – and that could point towards a mixed performance ahead. Cleaner, more explosive moves tend to occur during periods of risk aversion, risk rebounds or central bank policy divergence. None of those are apparent at the moment. SO unless a fresh catalyst arrives, moves could be on the smaller side. Though the best chance of a rally from AUD/USD could be if we see US data continue to undershoot expectations.
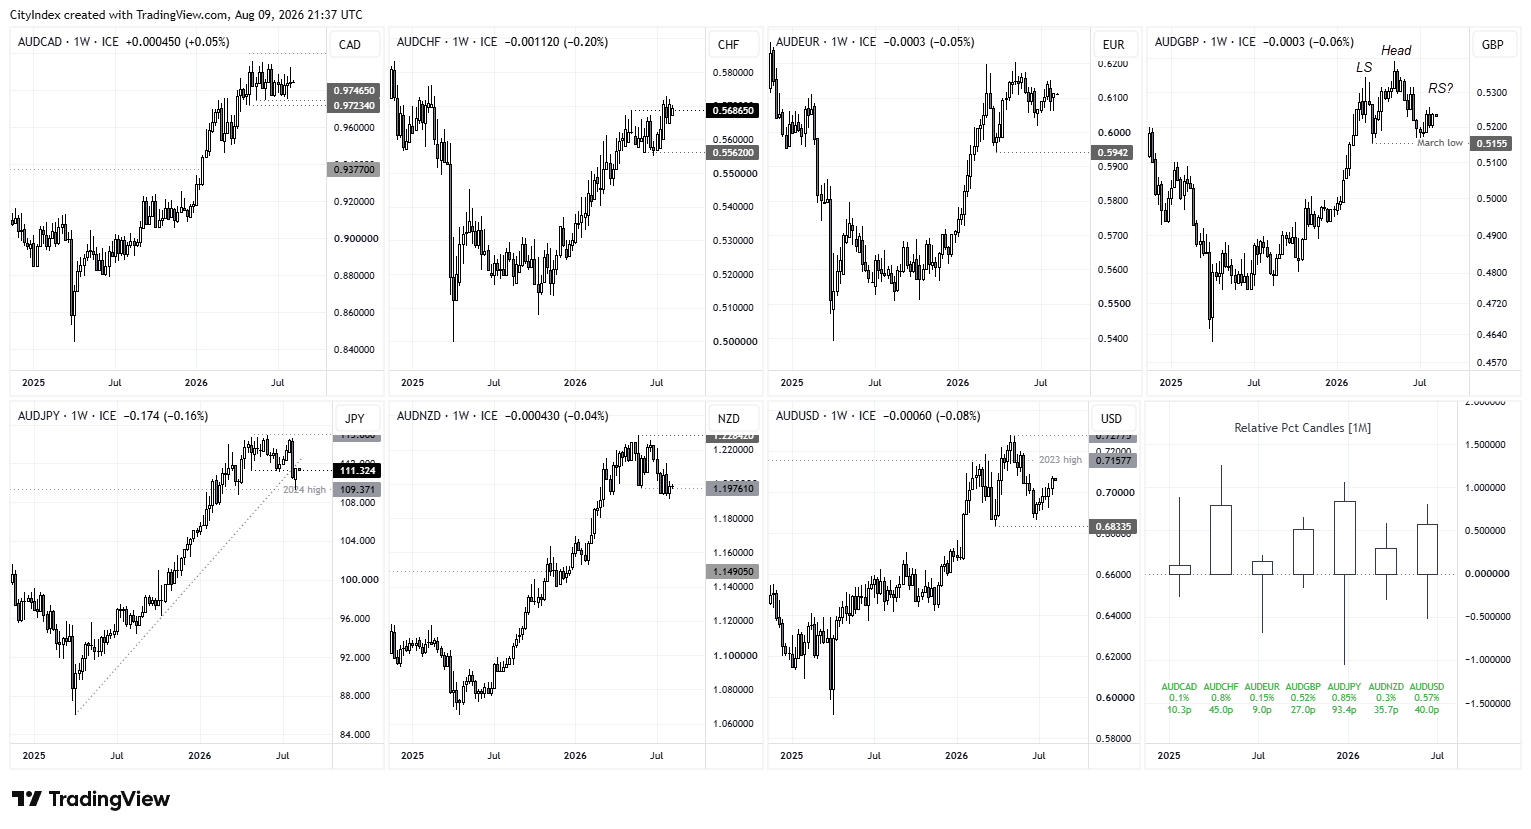
Source: TradingView
- AUD/USD rose for a sixth consecutive week and closed firmly above 70c. Whether it rises for a seventh week could come down to US data.
- AUD/CAD remains confined to its established range, which has favoured bearish setups near the highs and bullish setups near the lows.
- AUD/CHF appears to be forming a bullish flag around its cycle highs.
- AUD/EUR is becoming difficult to decipher directionally, given its series of higher lows and higher highs, which also lacks the structure of a continuation triangle.
- AUD/GBP is trying to gain further ground after bulls defended the March low, but this could also form the ‘right shoulder’ of a classic H&S bearish reversal.
- AUD/JPY found support at the 2024 high and shows potential to recoup more of its post-intervention losses.
- AUD/NZD formed a bearish engulfing week and closed below 1.20, although the sell-off from the highs is losing momentum overall. I am therefore not convinced it is ready to roll over without a fresh catalyst.

AUD/USD Technical Analysis: Australian Dollar vs US Dollar
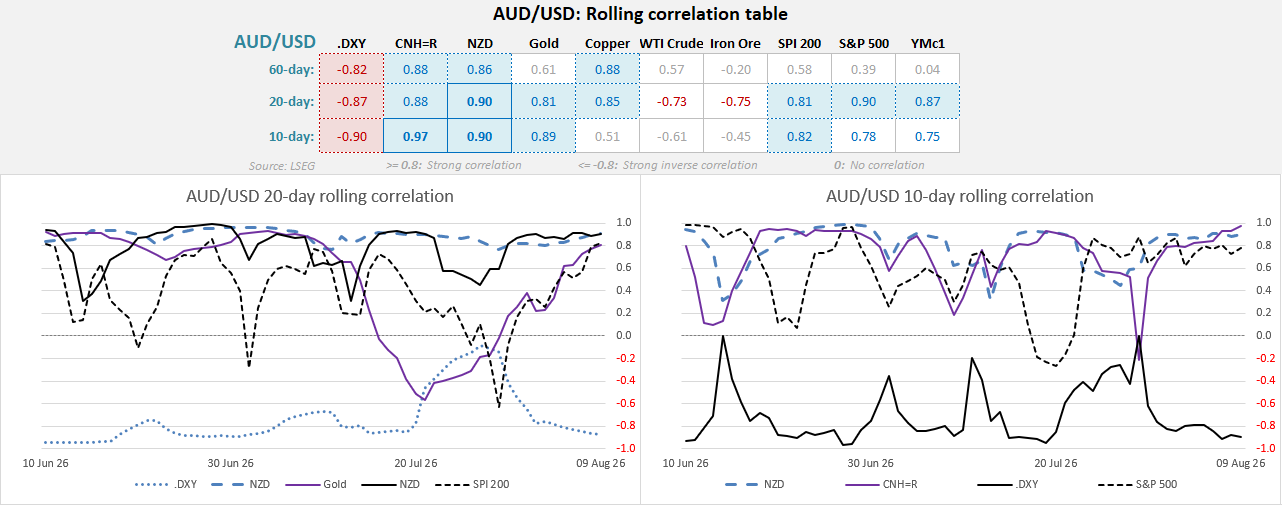
AUD/USD Correlations Strengthen Against the US Dollar
- The Aussie’s strongest relationship remains with the US dollar, with the inverse correlation between AUD/USD and the US dollar index (DXY) rising to -0.90 over 10 days, from -0.87 over 20 days and -0.82 over 60 days.
- China and risk sentiment remain supportive: AUD/USD has a 0.97 correlation with the Chinese yuan and 0.78 with the S&P 500 over 10 days.
- Gold has also become more closely aligned, with the correlation rising to 0.89 over 10 days.
- Commodity links are more mixed: copper's correlation has fallen to 0.51, while WTI crude oil has shifted to a -0.61 inverse correlation.
Source: LSEG
For traders wanting a deeper understanding of futures positioning, I’ve also published a guide on how to read and interpret weekly COT data in forex markets.
AUD/USD Positioning Shifts as Longs Increase
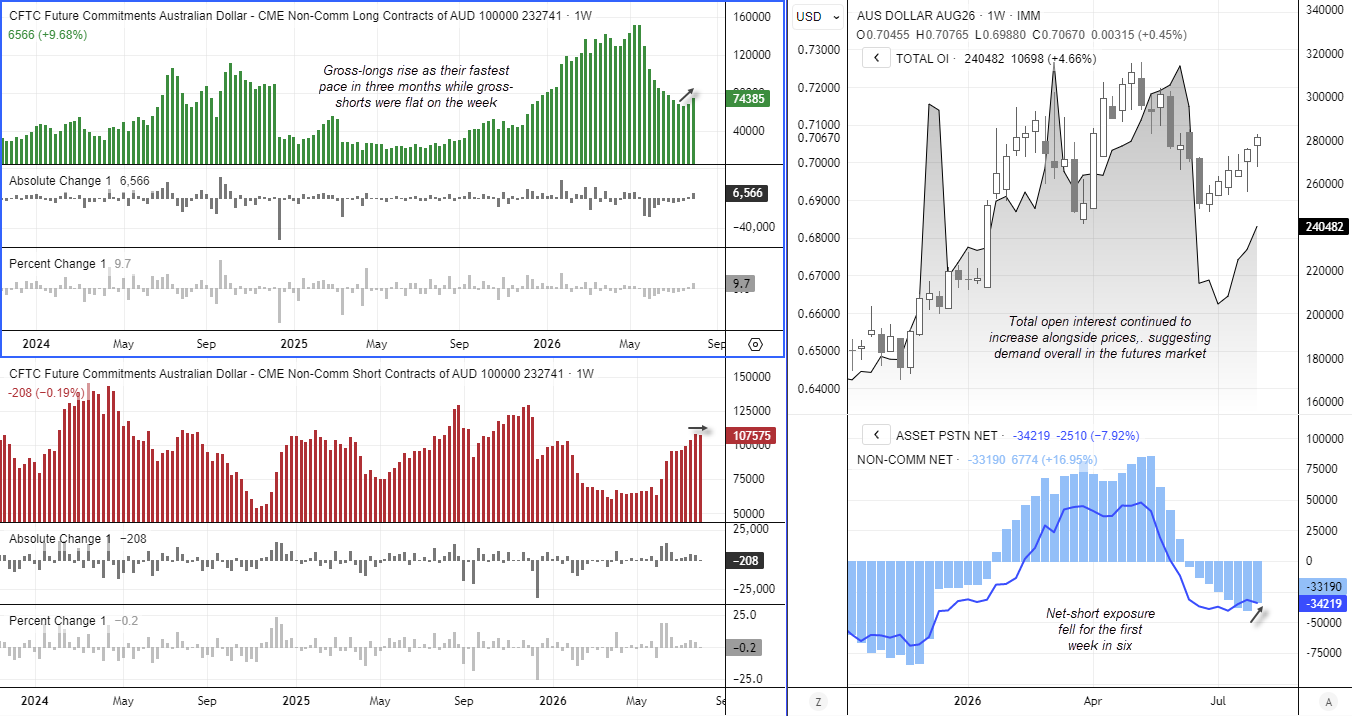
Large speculators increased gross longs by 6.6k contracts last week, their fastest weekly increase in three months. Gross shorts were a touch lower, suggesting the dynamics behind the Aussie’s rally are slowly changing. Total open interest is also rising alongside prices, pointing to broader demand for the Australian dollar from futures traders.
So, despite AUD/USD rising for six consecutive weeks, it still has potential to move higher if the US dollar remains under pressure. Six consecutive weekly gains is certainly on the extreme side, but the rally over this period has not been excessive. Taking the strong inverse correlation with the US dollar into consideration, the dollar remains in the driving seat.
Source: CFTC (COT) CME, LSEG
AUD/USD Options Signal Further Upside
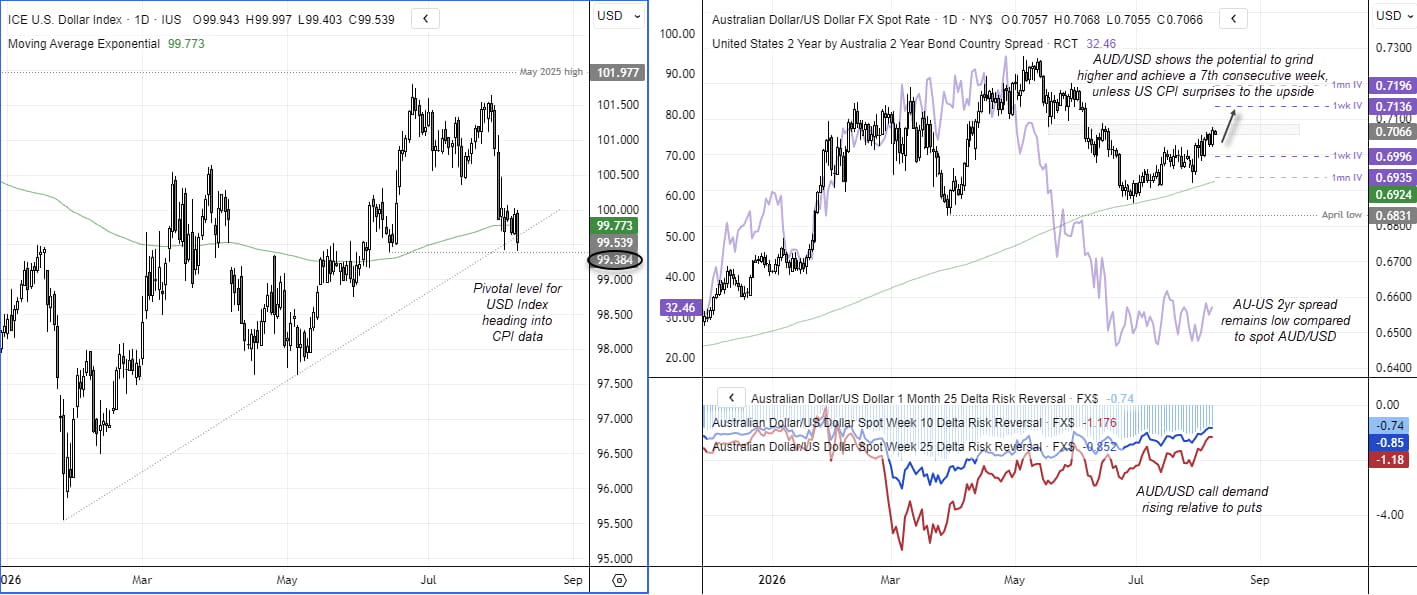
The US dollar index is clinging to support around the 99.384 swing low after breaking below its bullish trendline and 200-day MA last week. Incoming US data could decide which side of support it lands on by Friday’s close, and therefore whether AUD/USD can extend its trend or retrace lower.
Risk reversals remain supportive of the AUD/USD rally for now, with the rising lines showing that call demand is increasing relative to puts, even though puts remain dominant on an absolute basis. The one-week implied volatility band sits at 0.6996–0.7136, while the 71c handle also looks like a likely resistance level unless the US dollar index simply rolls over.
I have a hunch that inflation may not surprise much in either direction, which leaves the option, but not the obligation, of another Fed hike. That could allow AUD/USD to grind higher towards 0.7100–0.7136.
Source: ICE, LSEG
View the full economic calendar
-- Written by Matt Simpson
Follow Matt on Twitter @cLeverEdge
How to trade with City Index
You can trade with City Index by following these four easy steps:
- Open an account, or log in if you’re already a customer
• Open an account in the UK
• Open an account in Australia
• Open an account in Singapore
- Search for the market you want to trade in our award-winning platform
- Choose your position and size, and your stop and limit levels
- Place the trade
Related tags:
Latest market news










Web Trader platform
Our sophisticated web-based platform is packed with features.
Open an account today
Experience award-winning platforms with fast and secure execution.
Economic calendar
Related articles

EUR/USD forecast: All eyes on Warsh at Jackson Hole - Forex Friday
For much of this week, the EUR/USD has been edging lower with the US dollar regaining some ground after last week’s sell-off that was triggered, in part, by the bond market worries. Investors have been unwilling to bet further against the US dollar so far this week ahead of Kevin Warsh’s keynote speech at the Jackson Hole summit, due later today.


Gold Falters at Resistance, Grappling With PCE, Month-End Flows and Jackson Hole
Gold has pulled back from resistance after sticky PCE data, with month-end flows and Jackson Hole now shaping the near-term outlook.

DAX and EUR/USD forecast: Lower energy prices, yields offer support
But the question, of course, is how much further oil prices and bond yields can fall. For now, the combination is supportive of risk assets and is helping to sustain a relatively benign decline in the dollar. The focus today will be on US core PCE inflation, due for release shortly, while Nvidia’s second-quarter earnings will provide another test for risk appetite after the US markets close – not just for US indices but for global tech-heavy indices given the influence Nvidia has over the global tech and AI names.