


Bitcoin (BTC) Bulls Regain Control as 100k and 110k Come Into View
Bitcoin futures are breaking higher after weeks of consolidation, with positioning and momentum pointing to further upside — though key resistance levels remain close at hand.
Written by
Matt Simpson
Market Analyst
Bitcoin is regaining bullish traction after bears failed to force a breakdown below the 80k region. Momentum indicators and futures positioning suggest the balance of risks is tilting higher in the near term, although broader risk sentiment — particularly around US tech earnings — could still test bullish resolve.
View related analysis:
Bitcoin Momentum Turns Higher After Failed Breakdown
Momentum is curling higher after bears failed to push Bitcoin futures below 80k following a multi-week consolidation. Given Bitcoin’s tendency to sustain moves as late buyers rejoin the market, the odds favour continued upside over the near term. That said, the sell-off from October’s high may not be fully complete, leaving Bitcoin vulnerable to further downside if Wall Street’s tech earnings disappoint in the weeks ahead.
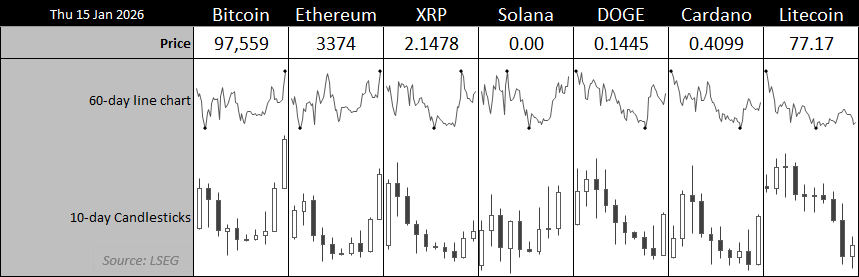
Chart prepared by Matt Simpson - source: CME, LSEG
Bitcoin Futures Positioning: Downside Hedges Begin to Ease
Data from the latest Commitment of Traders (COT) report show institutions remain wary of Bitcoin, with leveraged funds still net-short and asset managers holding relatively low net-long exposure. However, with gross shorts trending lower among leveraged traders, net-short exposure is diminishing.
While this does not yet signal a decisive bullish shift, it suggests demand for downside hedges is easing. With Bitcoin futures already breaking higher from a compression pattern this week, this positioning backdrop could fuel further short covering — and potentially fresh bullish initiation.

Chart analysis by Matt Simpson - source: CME, LSEG
Bitcoin Technical Analysis: Weekly Structure Turns Constructive
A closer look at the weekly chart shows the recent consolidation found support around the 2021 high, with a bullish divergence forming between late November and mid-December. The 36% sell-off from the record high also failed to test the April low, leaving a clear higher low in its wake. In hindsight, there were growing signs that bearish momentum was beginning to fade.
The 100k level stands out as an obvious psychological target. However, given Bitcoin’s tendency to run further and faster than most expect, it appears conservative following the multi-week consolidation carved out near cycle lows.
A sustained break above 100k could open the door towards 110k, close to the 112.55k high-volume node (HVN) formed during the sell-off from the record high.
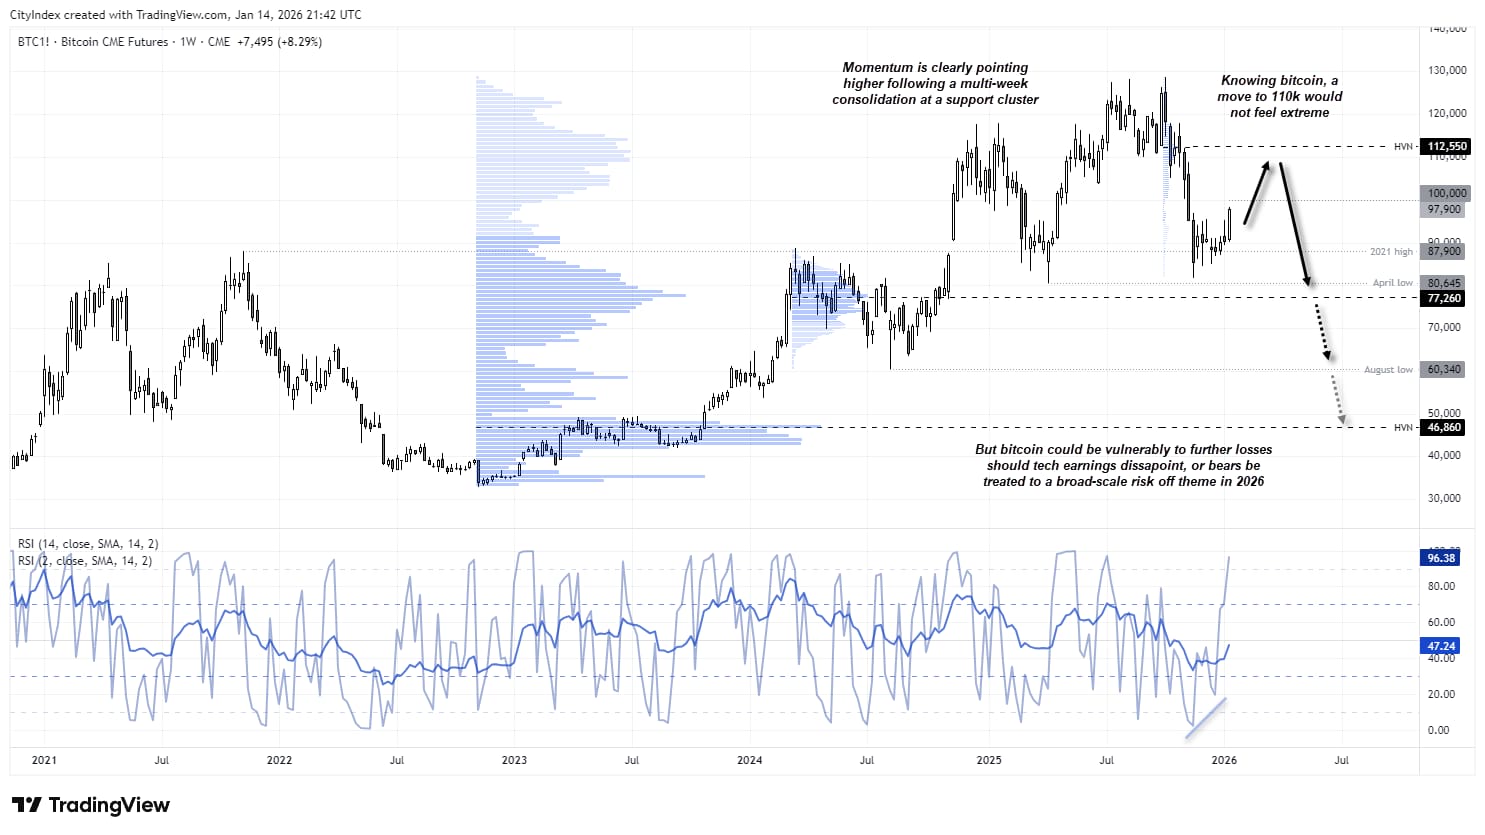
Chart analysis by Matt Simpson - Source: CME, TradingView
Bitcoin Daily Chart: Short-Term Momentum vs Key Resistance
The daily chart shows Bitcoin rising for a second consecutive session on Wednesday, with the past three days posting above-average volume — a sign of bullish initiation. The daily RSI (14) is rising alongside price but remains below overbought territory, although the RSI (2) flags near-term exhaustion risks.
With the 100k handle and the 200-day EMA (exponential moving average) at 102,235 nearby, bulls may want to tread carefully. A test of this zone could trigger mean reversion, potentially offering another opportunity to reload at lower levels ahead of a move towards the 107k handle near the 200-day SMA (simple moving average). A sustained break above that would bring the 112,550 HVN into focus.
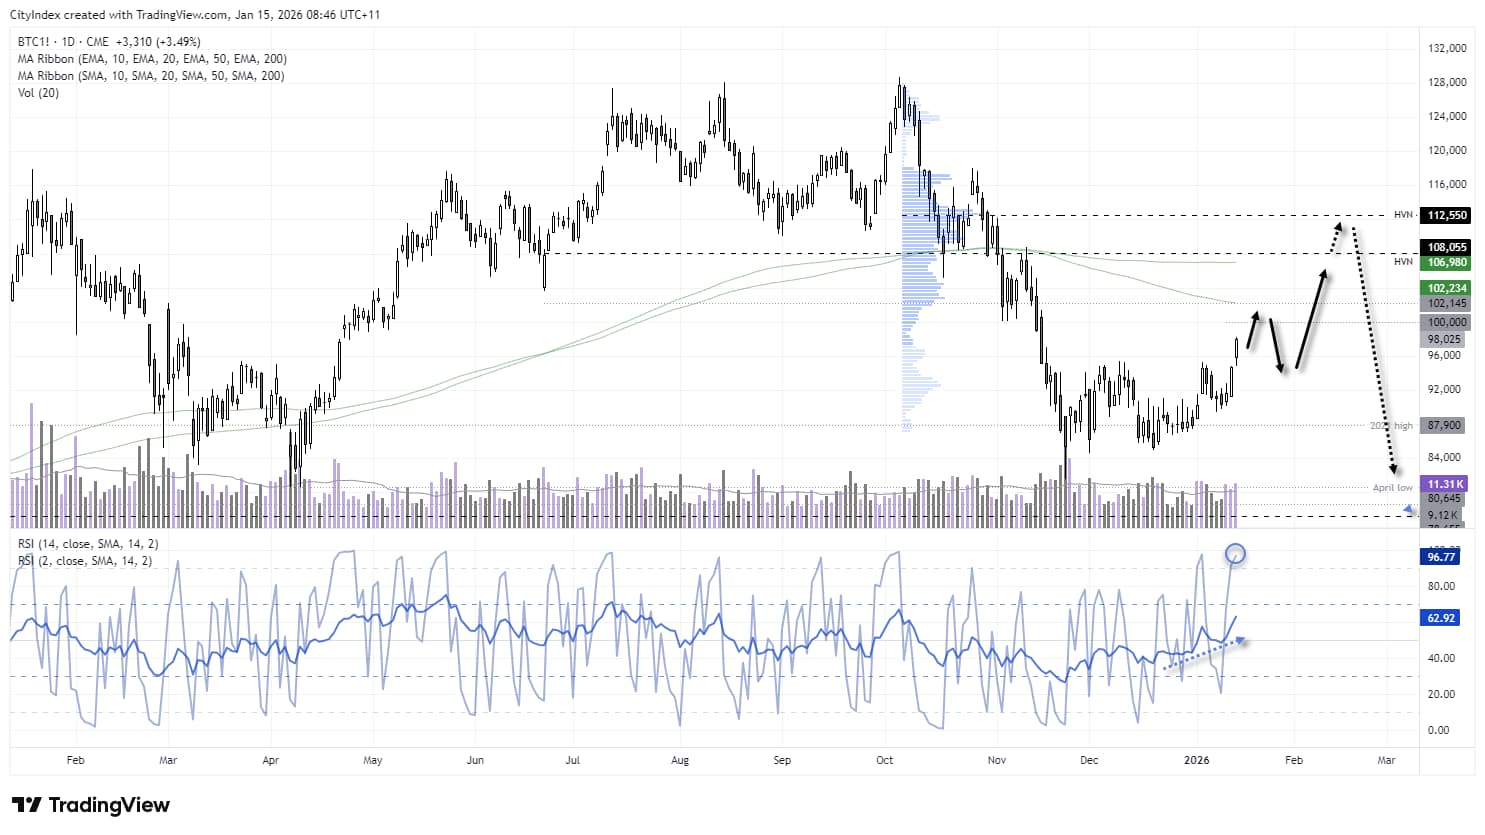
Chart analysis by Matt Simpson - Source: CME, TradingView
View the full economic calendar
-- Written by Matt Simpson
Follow Matt on Twitter @cLeverEdge
How to trade with City Index
You can trade with City Index by following these four easy steps:
- Open an account, or log in if you’re already a customer
• Open an account in the UK
• Open an account in Australia
• Open an account in Singapore
- Search for the market you want to trade in our award-winning platform
- Choose your position and size, and your stop and limit levels
- Place the trade
Related tags:







Web Trader platform
Our sophisticated web-based platform is packed with features.
Open an account today
Experience award-winning platforms with fast and secure execution.
Economic calendar
Related articles

Euro Short-term Outlook: EUR/USD Pullback Nears Pivotal Uptrend Support 8 28 2026
Warsh's comments accelerated the EUR/USD selloff, raising the stakes as buyers look to stabilize the broader recovery.


Gold and S&P 500 analysis: What now after Warsh’s hawkish speech?
The dollar surged across the board after the Fed Chair Kevin Warsh surprised with a hawkish-leaning speech at the Jackson Hole summit. All the bearish dollar bets that had been accumulated since last Friday on the back of data weakness and bond market troubles had to be squared and that triggered a short squeeze rally for the dollar. Gold and silver dropped, as a result, as too did bitcoin, while US indices were giving back earlier gains.


EUR/USD forecast: All eyes on Warsh at Jackson Hole - Forex Friday
For much of this week, the EUR/USD has been edging lower with the US dollar regaining some ground after last week’s sell-off that was triggered, in part, by the bond market worries. Investors have been unwilling to bet further against the US dollar so far this week ahead of Kevin Warsh’s keynote speech at the Jackson Hole summit, due later today.