


Bitcoin, Ethereum, Ripple Forecast: Key Scenarios in Sight
Bitcoin, Ethereum and Ripple forecast: charts are testing key support levels following the August–September drawdown, the Federal Reserve’s rate hike and a potential reversal in crude oil prices.
Written by
Razan Hilal
Market Analyst
Bitcoin, Ethereum and Ripple charts are testing key support levels following the August–September drawdown, the Federal Reserve’s 25 bps rate hike, and a potential reversal in crude oil prices.
The recent drawdowns were:
- Bitcoin (BTCUSD): -9%
- Ethereum (ETHUSD): -11%
- Ripple (XRPUSD): -20%
These drawdowns are equal to or less than 50% of the strong bullish rebounds from the yearly lows, suggesting that the recent declines may represent a corrective move before the broader rebound and uptrend resume.
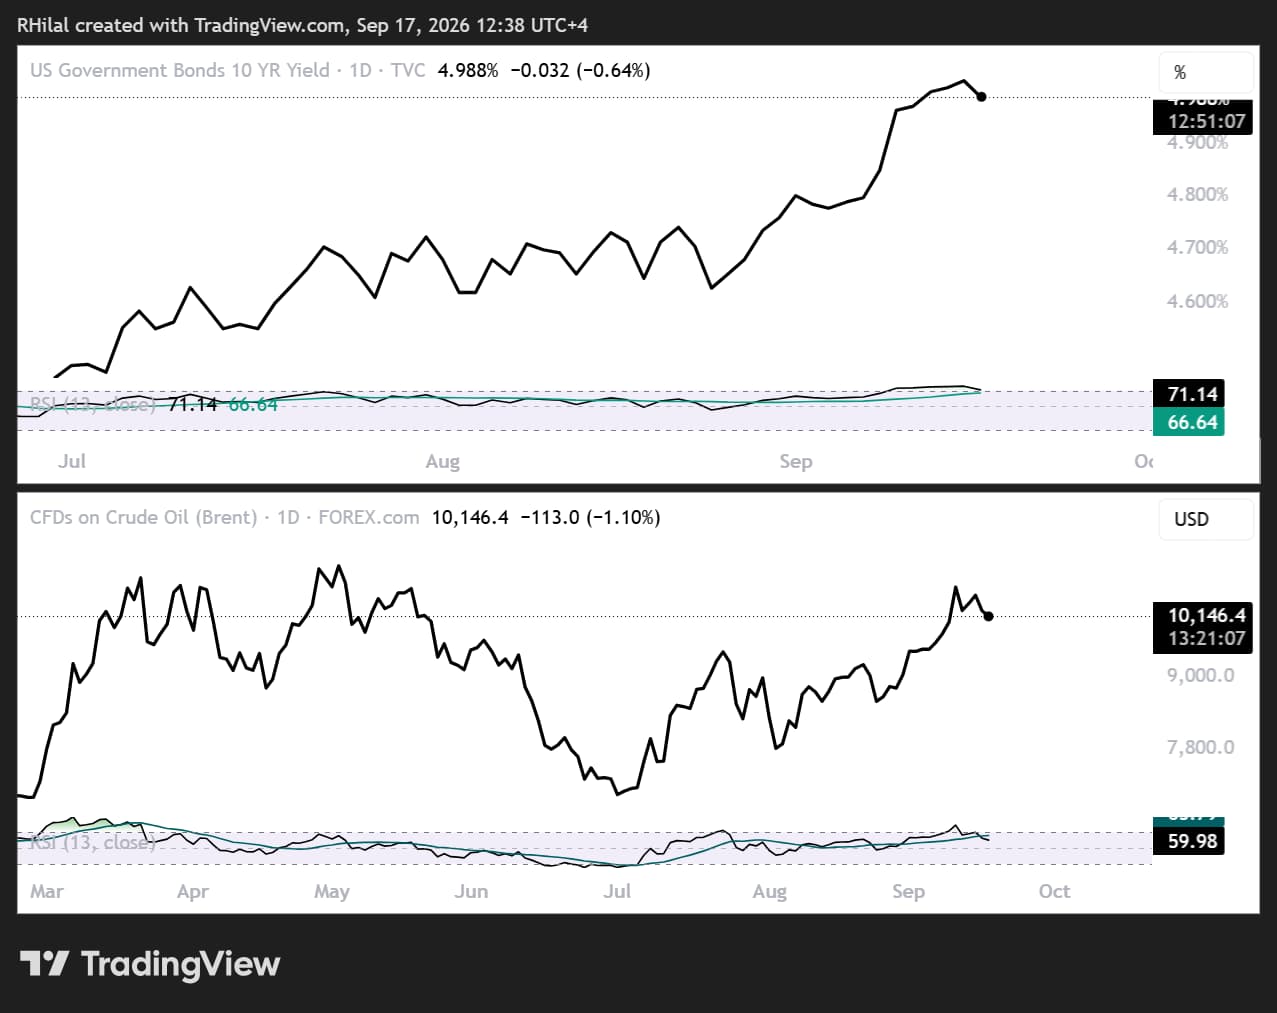
This scenario is supported by the latest pullback in Brent crude oil and U.S. 10-year Treasury yields, which may be easing some of the pressure created by persistent geopolitical escalation risks.
U.S. 10-Year Treasury Yields and UKOIL — Daily Time Frame — Log Scale
Source: TradingView
Although rate-hike expectations remain above 50% for another 25-basis-point increase at the October meeting, according to the CME FedWatch Tool, these expectations continue to limit gains across currency markets.
At the same time, the broader narrative driving markets appears to be easing. Crude oil prices and energy disruption risks are moderating, with Brent crude down more than 6% from its monthly highs. This signals a potential reversal in inflationary pressures.
U.S. 10-year Treasury yields have also pulled back from the 2007 resistance zone near 5.02%–5.3%, while daily overbought momentum has weakened below its respective moving average.
This may provide another source of support for risk appetite and help shield the charts from further drawdowns, particularly as prices approach technically significant support levels:
- Bitcoin: 74,500
- Ethereum: 2,340
- Ripple: 127
These support levels correspond to the Fibonacci retracements of the strong rebounds from the yearly lows, positioning the outlook between a short-term bearish correction and a long-term bullish structure.
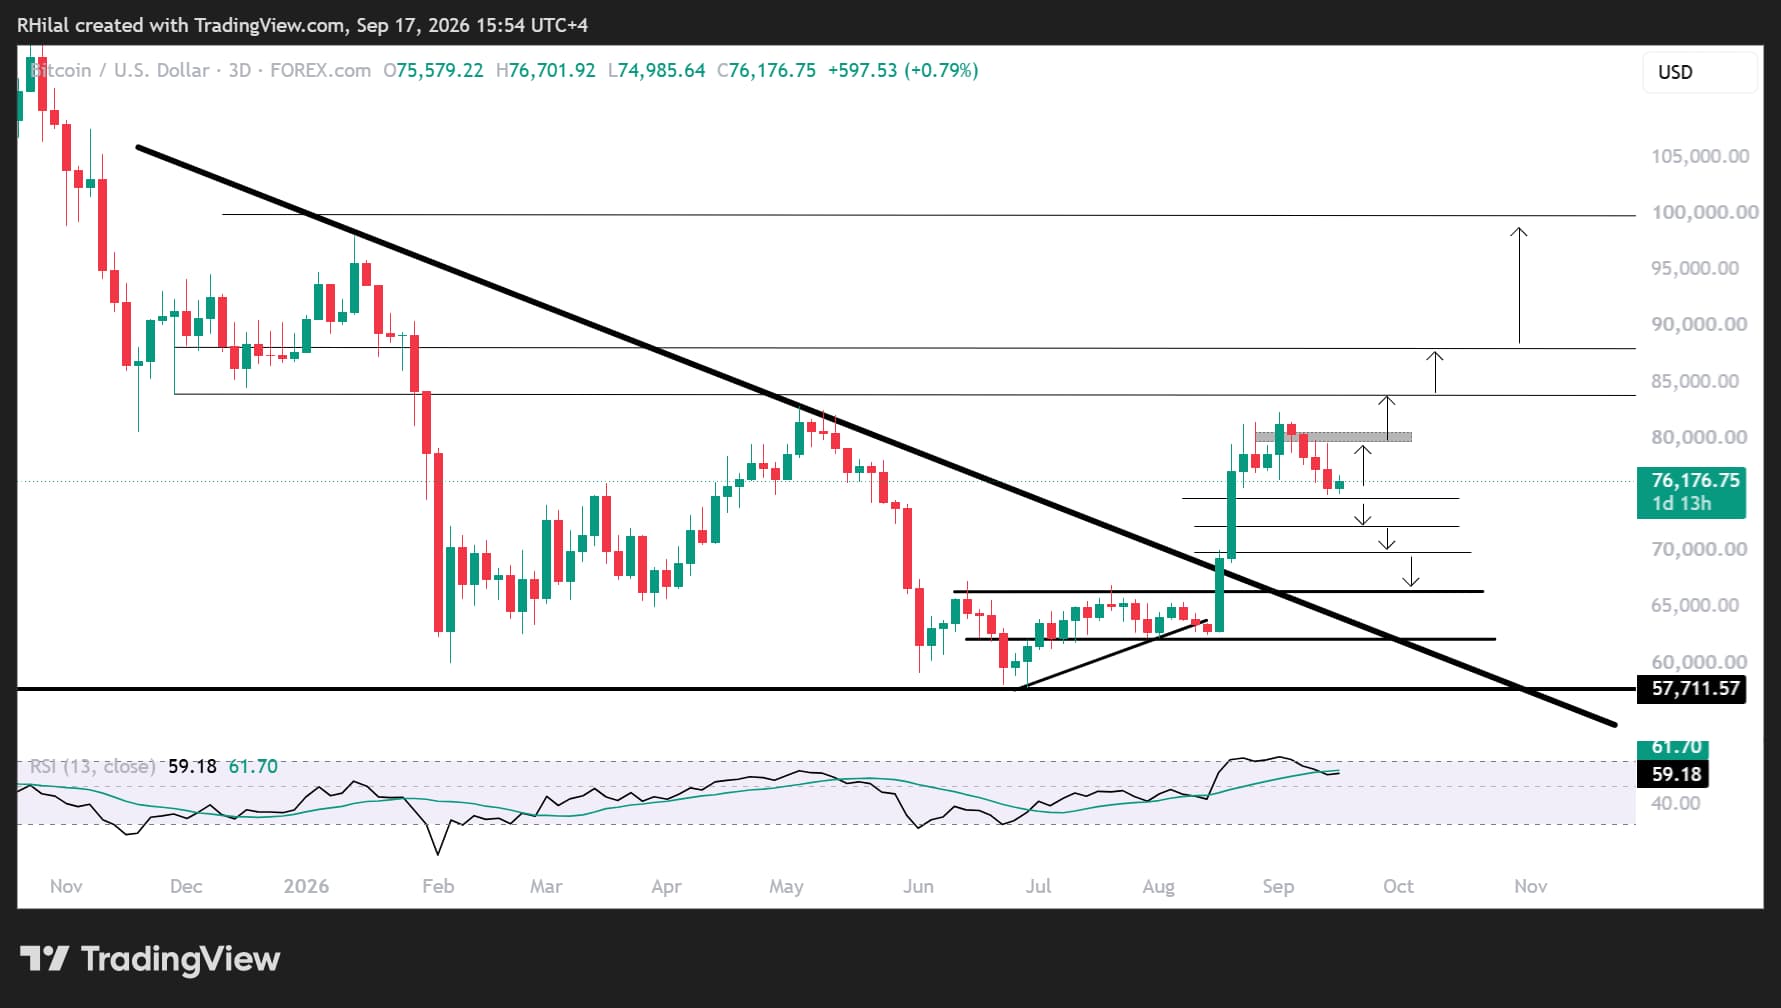
Bitcoin Forecast: Weekly Time Frame — Log Scale
Source: TradingView
Dominant narrative: A short-term pullback within a long-term uptrend. The key level that could invalidate the bullish structure is 66,400.
Bitcoin is currently holding its bullish rebound above 58,000 and the 61.8% retracement of the 2022–2025 advance. This represents a significant long-term support level that could help reinforce the potential return toward record highs.
Key resistance levels include 80,600 from a short-term perspective and the 84,000–88,000 zone from a longer-term perspective.
This area aligns with the first Fibonacci extension resistance of the 2022–2025–2026 wave. It may cap gains and introduce another period of sideways price action. A sustained breakout above this zone, however, could increase confidence in bullish continuation toward 100,000.
On the downside, short-term pullback risks are reflected by the Fibonacci retracement levels of the July–September uptrend near 74,500.
This level aligns with the 38.2% retracement, while the next key targets are the 50% and 61.8% retracement levels near 69,000 and 66,400, respectively.
As long as price holds above these levels, the bullish setup remains valid. A breakdown below them would re-expose the yearly lows near 58,000.
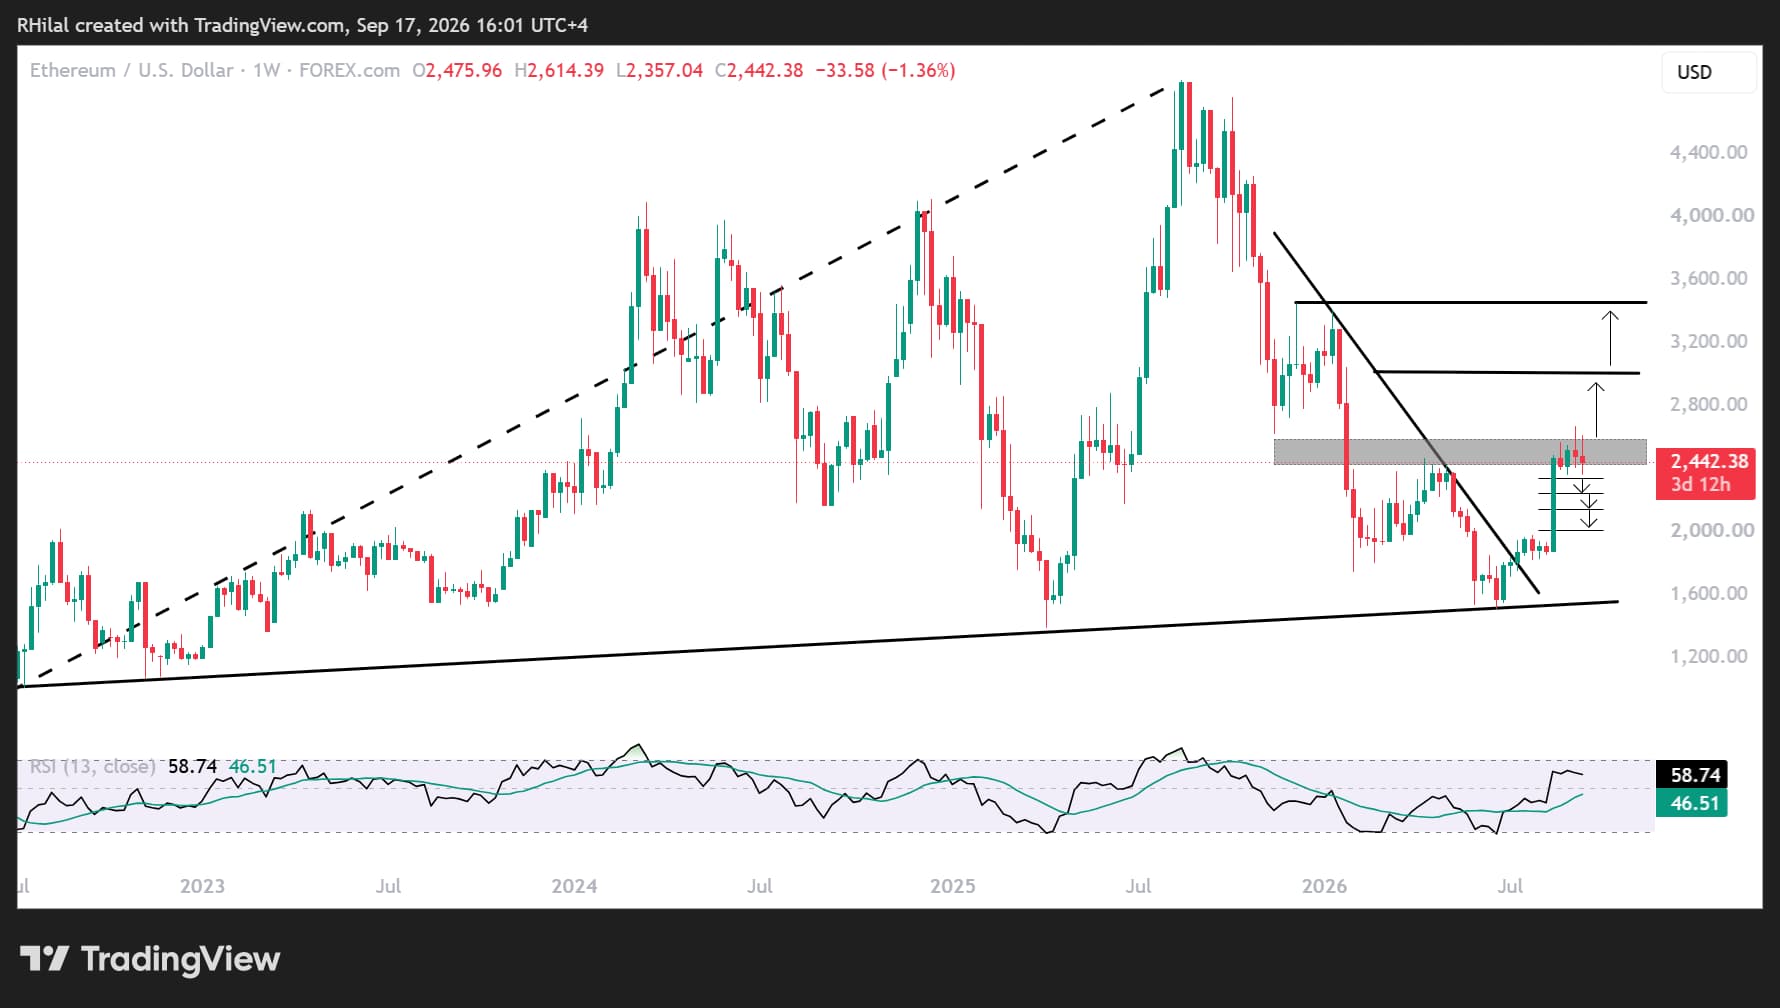
Ethereum Forecast: Weekly Time Frame — Log Scale
Source: TradingView
Dominant narrative: A short-term pullback within a long-term uptrend. The key level that could invalidate the bullish structure is 2,000.
Ethereum is currently holding its bullish rebound above 1,500 and the uptrend connecting the higher lows since 2022. This represents a significant long-term support structure that could reinforce the potential return toward record highs.
Key resistance levels include 2,570–2,660 from both a short- and long-term perspective.
A breakout above this zone could either sustain the current consolidation or confirm a bullish continuation toward the 38.2% Fibonacci extension of the 2022–2025–2026 wave near 3,000, followed by the 50% extension near 3,400. Such a move would increase confidence in a return toward new record highs.
On the downside, short-term pullback risks are reflected by the Fibonacci retracement levels of the July–September uptrend near 2,340.
This level aligns with the 38.2% retracement, while the next key targets are the 50% and 61.8% retracement levels near 2,240 and 2,140, respectively.
As long as price holds above these levels, the bullish setup remains valid. A breakdown below them would re-expose the 2,000 level and the yearly lows.
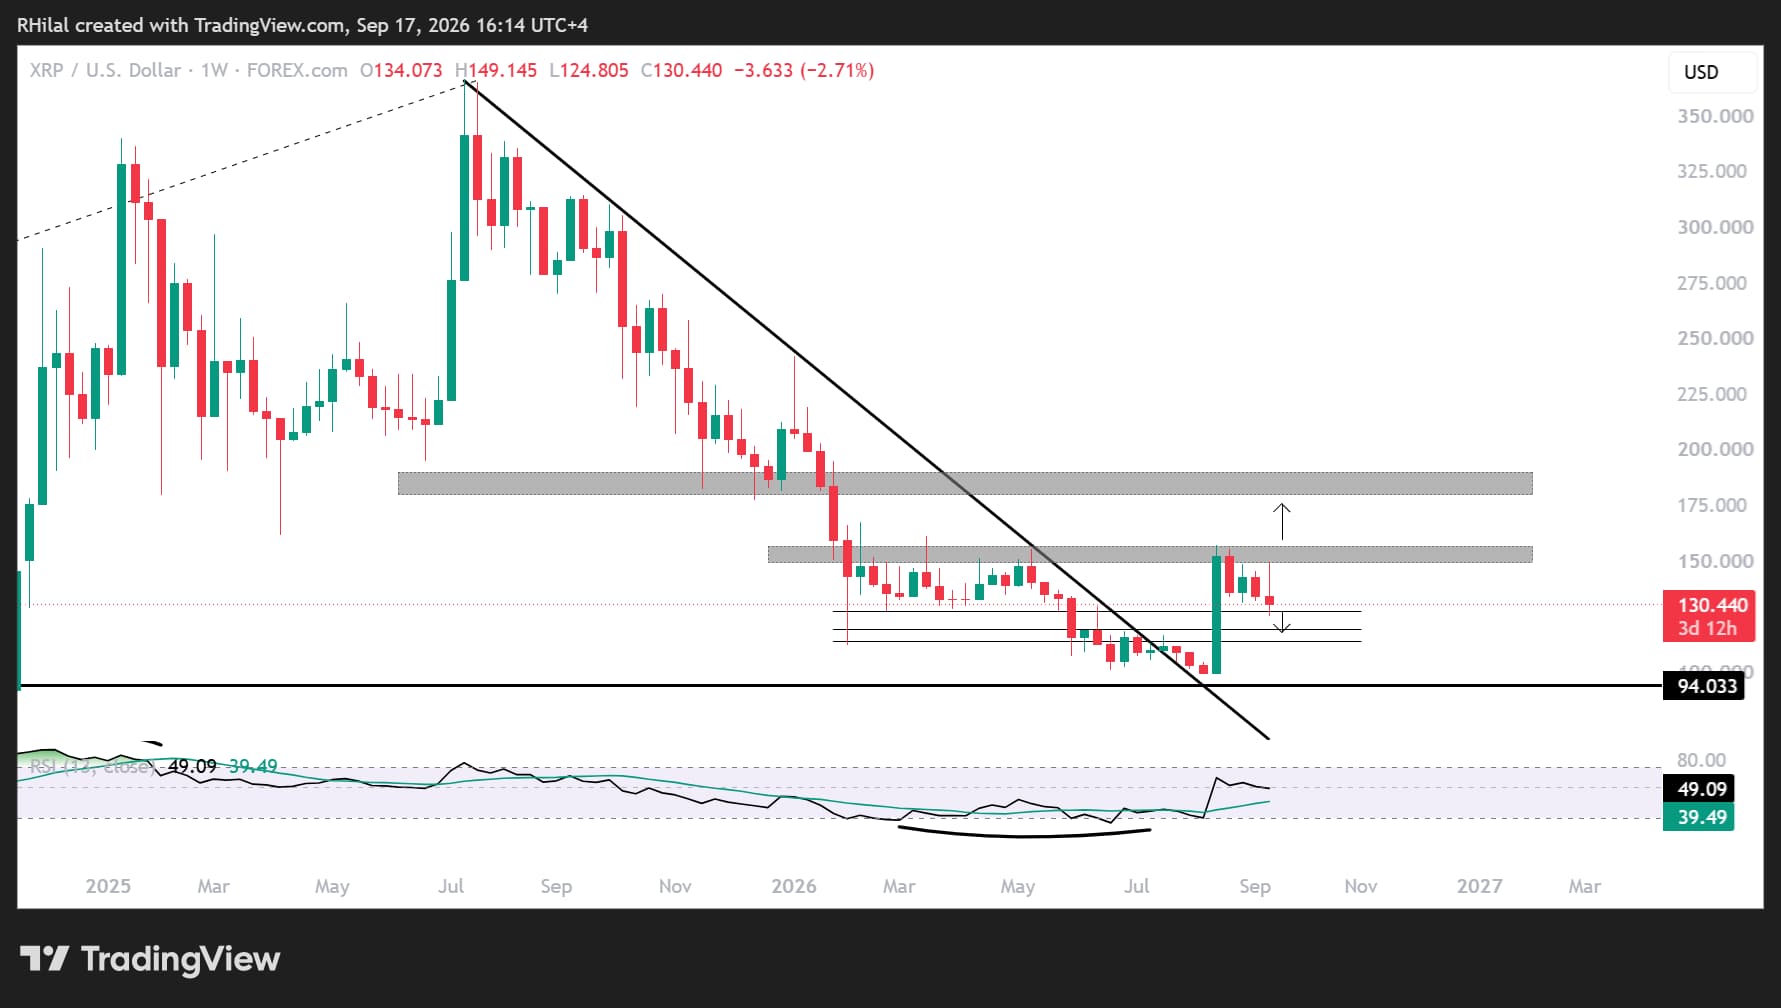
Ripple Forecast: Weekly Time Frame — Log Scale
Source: TradingView
Dominant narrative: A short-term pullback within a long-term uptrend. The key level that could invalidate the bullish structure is 114.
Ripple is currently holding its bullish rebound above 99 and the 78.6% retracement of the 2022–2025 advance.
This represents a significant long-term support level that could help reinforce the potential return toward record highs.
Key resistance levels include 149 and 156 from a short- and long-term perspective. These levels align with the first Fibonacci extension resistance of the 2022–2025–2026 wave.
This resistance zone may cap gains and introduce another period of sideways price action. A sustained breakout above it, however, could increase confidence in bullish continuation toward 180.
On the downside, short-term pullback risks are reflected by the Fibonacci retracement levels of the July–September uptrend near 124.80.
This level aligns with the 61.8% retracement, while the next key targets are the 78.6% retracement levels near 119 and 114.
As long as price holds above these levels, the bullish setup remains valid. A breakdown below them would re-expose the 99 level and the yearly lows.
These setups significantly resemble those on the gold and silver charts.
Written by Razan Hilal, CMT
Follow on X: @Rh_waves
Latest market news










Web Trader platform
Our sophisticated web-based platform is packed with features.
Open an account today
Experience award-winning platforms with fast and secure execution.
Economic calendar
Related articles

Bitcoin Forecast: BTC/USD Back to $80K Ahead of Warsh’s Jackson Hole Speech
After surging over $15,000 in the past 10 days alone, there is risk of a near-term pullback if Warsh says anything remotely hawkish at Jackson Hole - what are the levels to watch from here?


Euro Forecast: Will Core PCE Tip the Scales for the Fed?
The last Core PCE before the Fed's September meeting will mark 65 straight months above the central bank's 2% target - will it be enough to push the FOMC toward a rate hike?

EUR/USD forecast: Technical Tuesday | August 25, 2026
The relative calm in the energy and bond markets have allowed the US dollar and equities to make a slightly positive start to the week. America’s economic war on Iran also failed to trigger any panic, leaving investors with little to chew over until the release of US inflation data on Wednesday and Kevin Warsh’s speech at the Jackson Hole Symposium on Friday.