

EUR/USD outlook: Hawkish Fed puts euro on the ropes
The Fed delivered a unanimous hike, stronger economic projections and a more hawkish dot plot, giving markets little reason to unwind aggressive tightening bets and keeping the dollar firmly supported.
Written by
David Scutt
Market Analyst
- Unanimous Fed hike clears a high bar for hawks
- Updated forecasts point to stronger growth, lower unemployment, sticky inflation
- Dot plot validates higher-for-longer pricing across the curve
- Front-end yields surge, driving sharp bear flattening of US curve
- EUR/USD breaks to multi-month lows
After telling markets to figure out the appropriate level for the funds rate themselves, Kevin Warsh and the FOMC duly delivered at the September meeting, hiking rates for the first time in more than three years, as expected, while doing enough to validate the extremely hawkish shift in market pricing seen heading into the decision.
That helped support the US dollar, which ripped higher against a number of the majors, including the euro. With the technical picture for EUR/USD deteriorating sharply, we look at the key levels to watch heading into the weekend.
Fed clears a high bar
Coming into the September FOMC meeting, markets had set a high bar for the Fed to match following the significant hawkish shift in rate expectations over the past month after Warsh’s Jackson Hole speech.
To his credit, Warsh not only met those expectations by following through with a rate hike, but managed to bring the entire FOMC with him. That included influential members such as New York Fed President John Williams, who had been delivering notably dovish commentary heading into the meeting, along with Governor Christopher Waller.
The unanimous vote was the first clear sign that the decision was at least as hawkish as markets had expected, and perhaps even more so.
Stronger growth, lower unemployment, firmer inflation
Source: LSEG
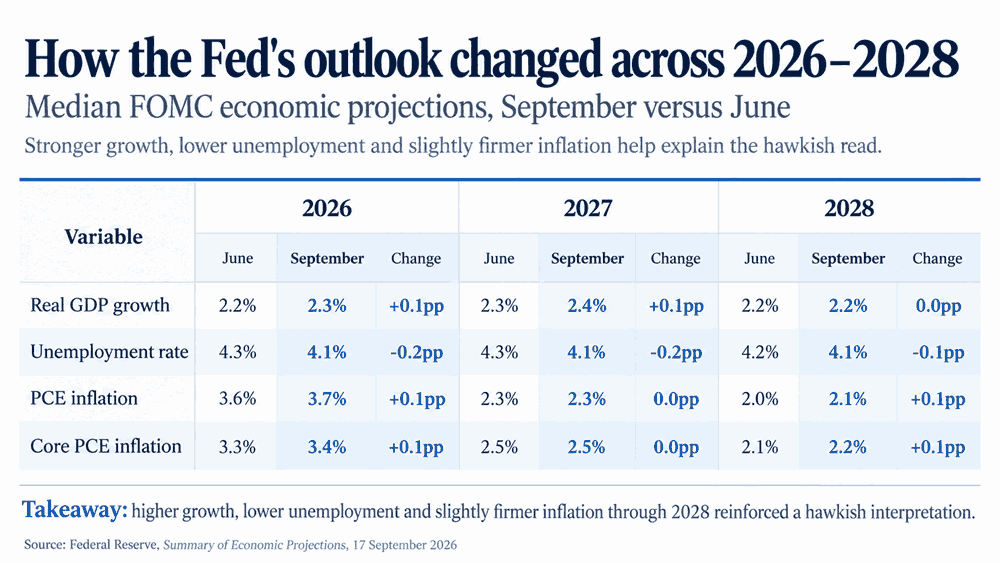
That view was enhanced further by the Fed’s updated economic projections, which upgraded growth this year and next while simultaneously seeing unemployment significantly lower than projected three months earlier in both years.
Importantly, the FOMC also lifted its 2026 core PCE inflation forecast a tenth to 3.4%, and still has it sitting above its 2% target through 2028, even with a far more hawkish rate profile delivered in the accompanying dot plot.
Faster growth, lower unemployment and persistently high inflationary pressures, especially in the near term. That was an entirely hawkish message.
Rates seen staying higher for longer
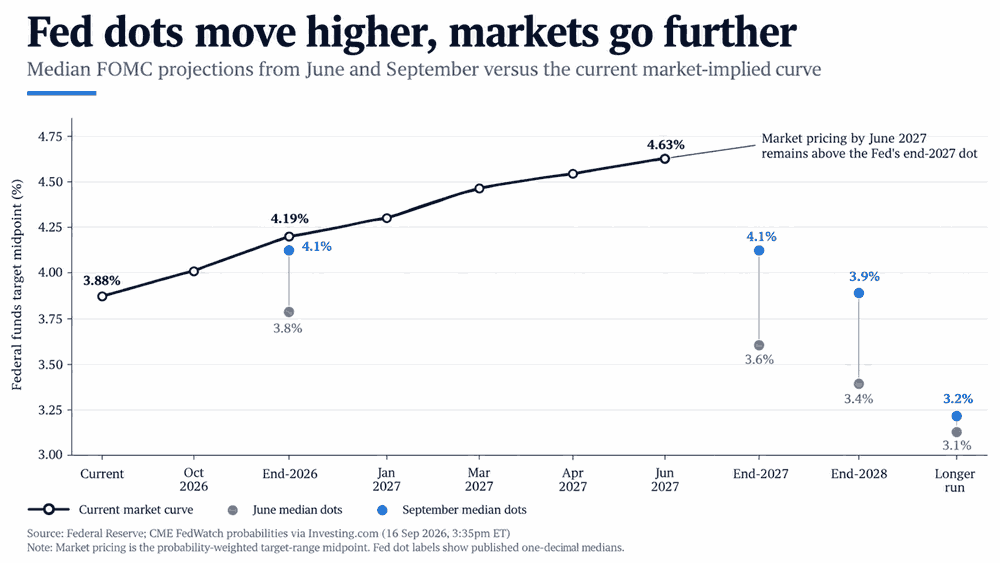
While Warsh once again declined to provide his own rate forecast, the remaining 18 FOMC participants overwhelmingly saw the need for higher rates moving forward.
Of those 18 participants, only two saw rates remaining at current levels through year-end. Twelve pencilled in one further 25bp hike, while four saw the case for another 50bp of tightening.
The message remained hawkish further out. The median funds rate was also projected to remain above 4% at the end of 2027, while the longer-run dot was nudged up a tenth to 3.2%, reinforcing the message that policy rates may need to remain higher for longer.
Source: LSEG
While the updated median dot plot path was not as aggressive as what markets had priced heading into the meeting for this year and next, it was hawkish enough to validate the broader direction of travel. Markets not only maintained that hawkish pricing but added to it in response, with another three hikes now expected by June next year.
Undoubtedly, the broader message from the dots was hawkish. But once the dust settles, it may be difficult for the Fed to out-hawk what is already priced into the curve unless we see clear evidence of renewed strength in labour market conditions and another acceleration in inflation over the coming months.
That’s not out of the realms of possibility, but it’s also not the base case. That may eventually create downside risk for the US dollar and front-end Treasury yields, something to keep in mind when assessing directional risks for markets that are heavily influenced by those markets.
Warsh sees little sign of restriction
To ram home the point, Warsh delivered an unequivocally hawkish message in the press conference. He said he would be “hard pressed to describe broad financial conditions as restrictive”, a view he said was widely shared by the Committee, before adding that the September hike had “removed a dose of accommodation”.
Read between the lines, that suggests Warsh does not regard current policy as being particularly restrictive even after the hike. It also leaves the impression that his own stance may be more hawkish than the median FOMC member, even if he declined to provide any guidance.
Front end takes the brunt
Source: LSEG
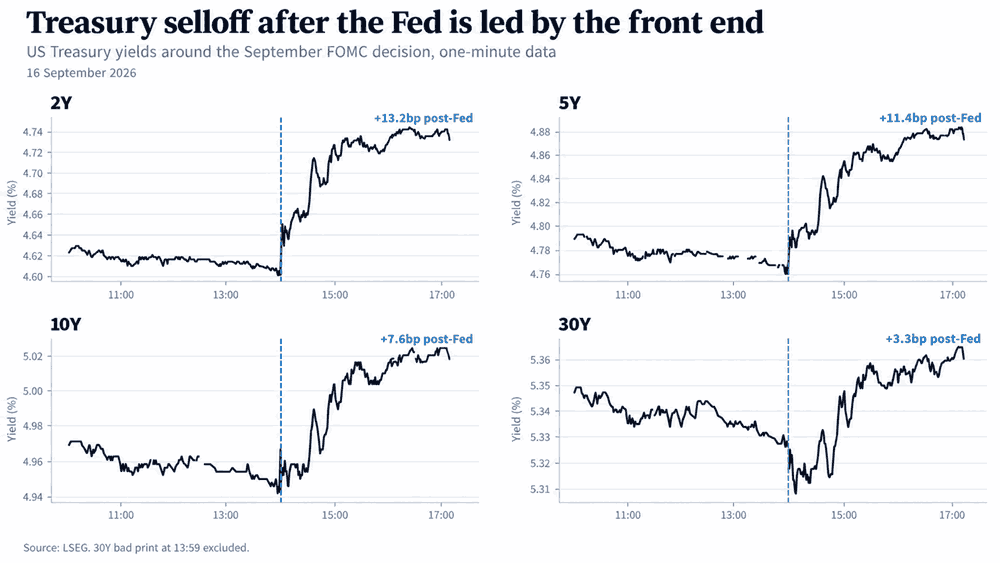
The reaction in US rates was entirely as you would expect, with yields lurching higher across the curve, led by the front end. Two-year yields rose 13.2bp from immediately before the decision, compared with 11.4bp for five-year yields, 7.6bp for tens and just 3.3bp for the 30-year.
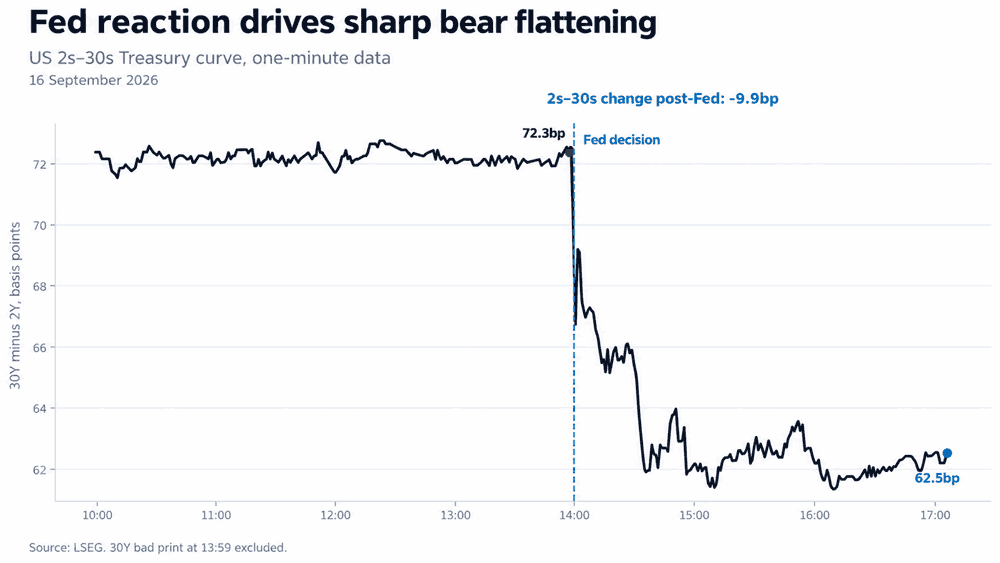
The net result was a sharp bear flattening of the Treasury curve, with the 2s–30s differential narrowing from 72.3bp immediately before the decision to 62.5bp afterwards. With the selloff heavily concentrated at the front end, long-dated yields remained beneath the highs seen earlier this month.
Source: LSEG
On the back of the lift in yields across the curve, the US dollar also strengthened rapidly, placing pressure on all G10 FX names, including the euro.
EUR/USD downside pressure builds
Source: TradingView
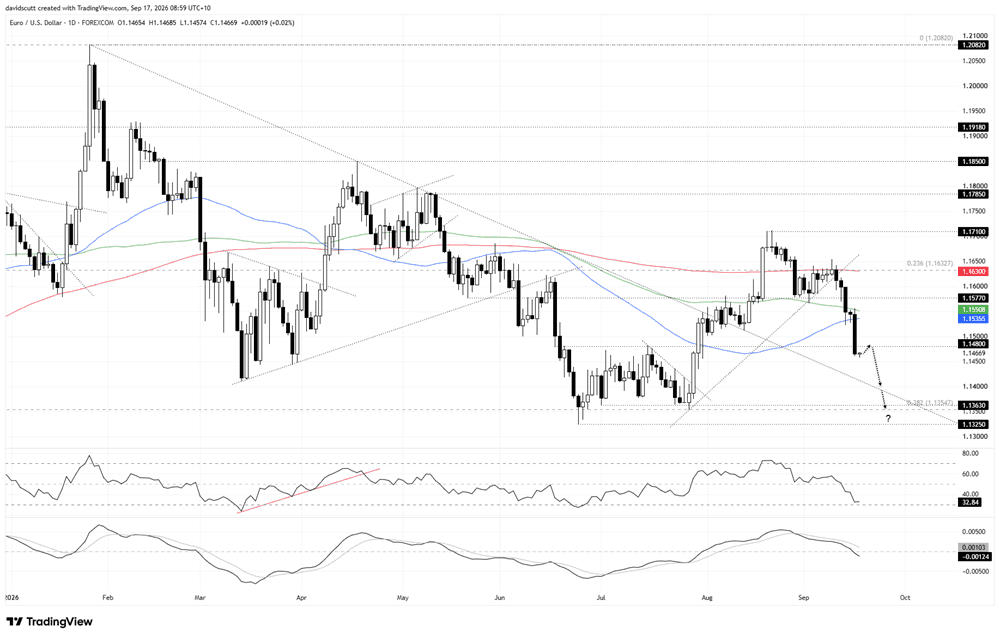
Heading into the FOMC meeting, EUR/USD was already under pressure, losing support at 1.1577 early in the week before settling into a range between the 50-day moving average underneath and the 100-day moving average overhead.
However, on the back of the hawkish hike, the pair was sent sharply lower, hitting levels not seen since late July while simultaneously slicing beneath support at 1.1480.
That’s now the immediate level to watch overhead and can be used as a reference point when establishing potential setups depending on price action around it. If we were to see a retest of 1.1480 and failure, it may provide an opportunity to establish shorts with a tight stop above the level for protection, seeking lower levels.
Those to watch underneath include former downtrend resistance running from the January highs, found today around 1.1420, followed by a much more pronounced support zone beginning around the 38.2% Fibonacci retracement of the January 2025 to January 2026 low-high move and extending down to the June 24 swing low around 1.1325. A breach of the latter would add to the risk of a far deeper unwind back towards support at 1.1200.
If EUR/USD were to reverse back above 1.1480 and hold there, the option is also available to establish longs with a tight stop beneath the level for protection. The 50-day moving average comes across as the first potential upside target, found today around 1.1535.
However, longs are the least preferred of the available options right now, a message backed up by the oscillators, which continue to suggest increasing downside pressure. RSI (14) continues to trend lower and is sitting just above oversold territory around 33, while MACD has now flipped negative after already staging a bearish crossover in late August.
That favours, in the short term, selling into strength and downside breaks.
Latest market news










Web Trader platform
Our sophisticated web-based platform is packed with features.
Open an account today
Experience award-winning platforms with fast and secure execution.
Economic calendar
Related articles

FX Futures Positioning: Dollar Rebound Meets Diverging Forex Bets | COT Report
US dollar longs held firm into Jackson Hole, while euro, yen and commodity FX positioning diverged ahead of ISM and NFP.


Gold and S&P 500 analysis: What now after Warsh’s hawkish speech?
The dollar surged across the board after the Fed Chair Kevin Warsh surprised with a hawkish-leaning speech at the Jackson Hole summit. All the bearish dollar bets that had been accumulated since last Friday on the back of data weakness and bond market troubles had to be squared and that triggered a short squeeze rally for the dollar. Gold and silver dropped, as a result, as too did bitcoin, while US indices were giving back earlier gains.


EUR/USD forecast: All eyes on Warsh at Jackson Hole - Forex Friday
For much of this week, the EUR/USD has been edging lower with the US dollar regaining some ground after last week’s sell-off that was triggered, in part, by the bond market worries. Investors have been unwilling to bet further against the US dollar so far this week ahead of Kevin Warsh’s keynote speech at the Jackson Hole summit, due later today.