


British Pound Price Action Setups: GBP/USD, GBP/JPY
GBP/JPY has flown up to a fresh 18-year high and even with a recent bout of USD-strength, GBP/USD has held up relatively well.
Written by
James Stanley
Sr. Strategist
GBP Talking Points:
- The British Pound retains relative strength, with GBP/USD setting a fresh monthly high yesterday, even as EUR/USD held lower-high resistance.
- GBP/JPY, however, has been in full breakout mode. I looked into this at the Tuesday webinar and the move has stretched all the way into a major Fibonacci level just below the 220 handle.
While USD bulls came back to life from mid-April through last month, GBP/USD has held up relatively well. The pair did test a fresh low in late-June but support held at a key Fibonacci level of 1.3143, and that’s where the music stopped for sellers and since then a strong bullish reversal has taken over that’s seen Cable rip for more than 400 pips into yesterday’s fresh monthly high.
This Fibonacci level carries some historical importance, as well, as the 38.2% retracement of the 2025 rally, and this came into play in August of that year to hold the lows with another instance of support, albeit messier, a couple months later.
GBP/USD Weekly Chart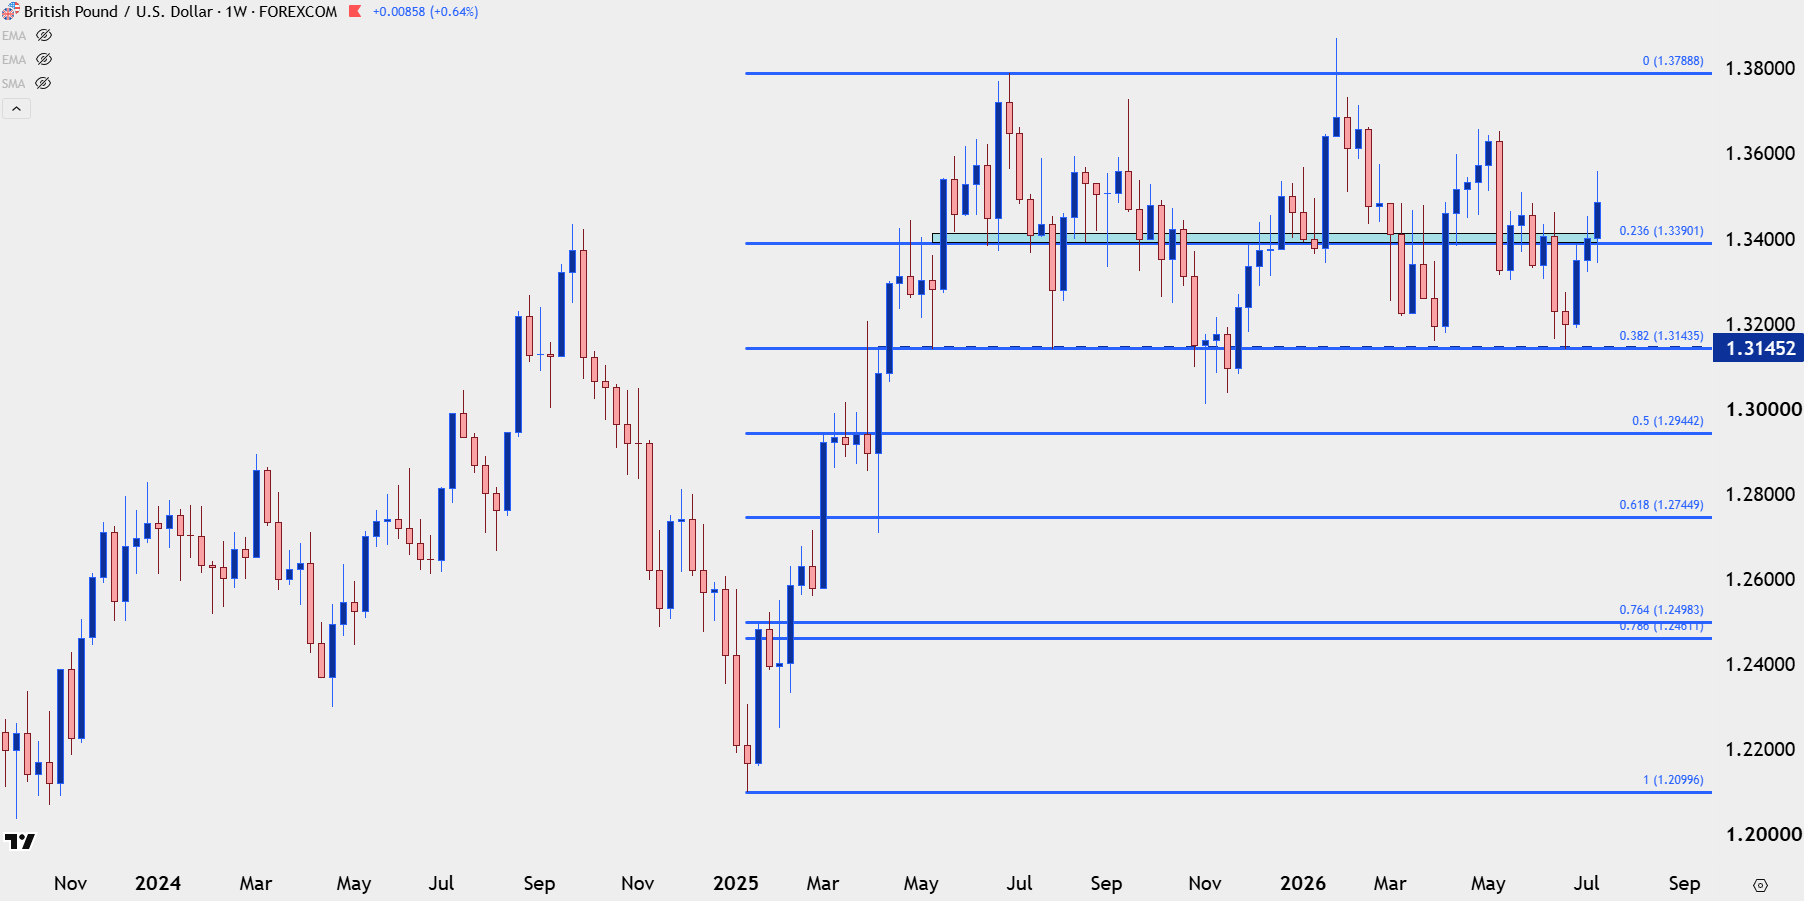
Chart prepared by James Stanley; data derived from Tradingview
GBP/USD
On a shorter-term basis prices are pulling back from the fresh high set yesterday, and the question now is when or where a higher-low might appear. The 1.3500 handle certainly seems to be playing a role but perhaps more interesting is a spot of prior resistance, down around 1.3450 that would be an ideal spot for buyers to defend. And then below that, the 1.3390 Fibonacci level up to the 1.3400 handle. And for an ‘s3’ support, there’s a prior swing-low turned swing-high that stands out around 1.3325.
GBP/USD Four-Hour Chart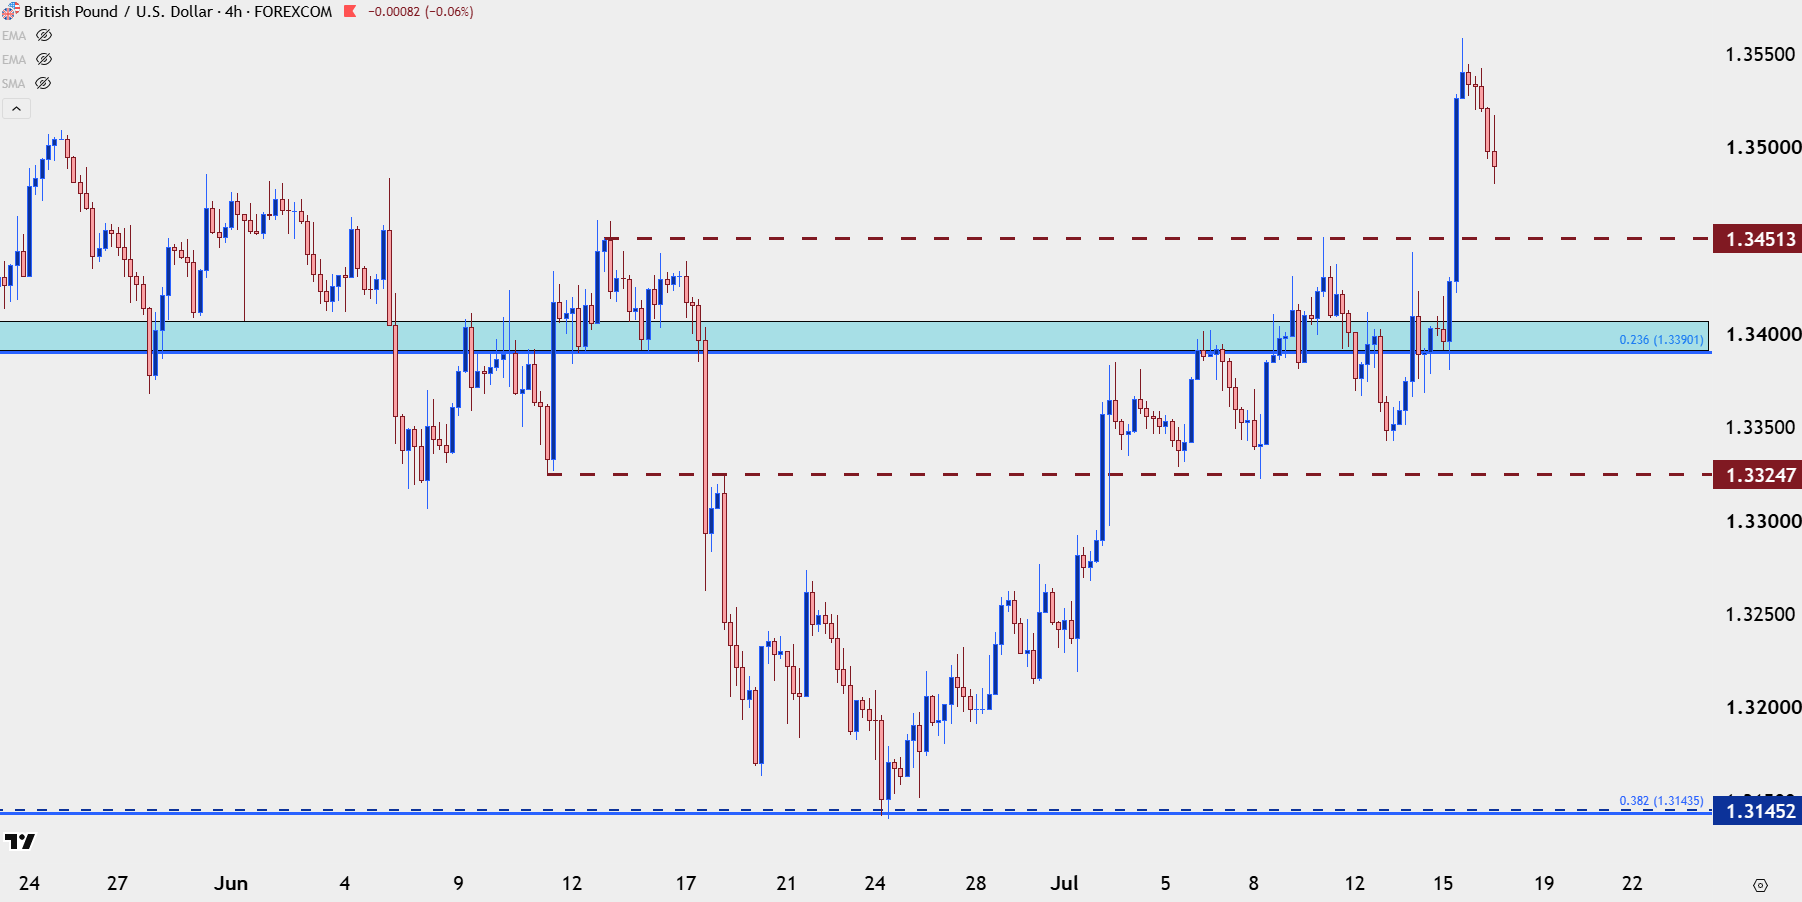
Chart prepared by James Stanley; data derived from Tradingview
GBP/JPY
I looked into GBP/JPY in the Tuesday webinar and at the time, the pair was set up in an ascending triangle formation. Buyers have since made a mark with a rally of more than 200 pips, and now we have price pushing into a longer-term Fibonacci level of note at 219.39 following the print of a fresh 18-year high.
GBP/JPY Monthly Chart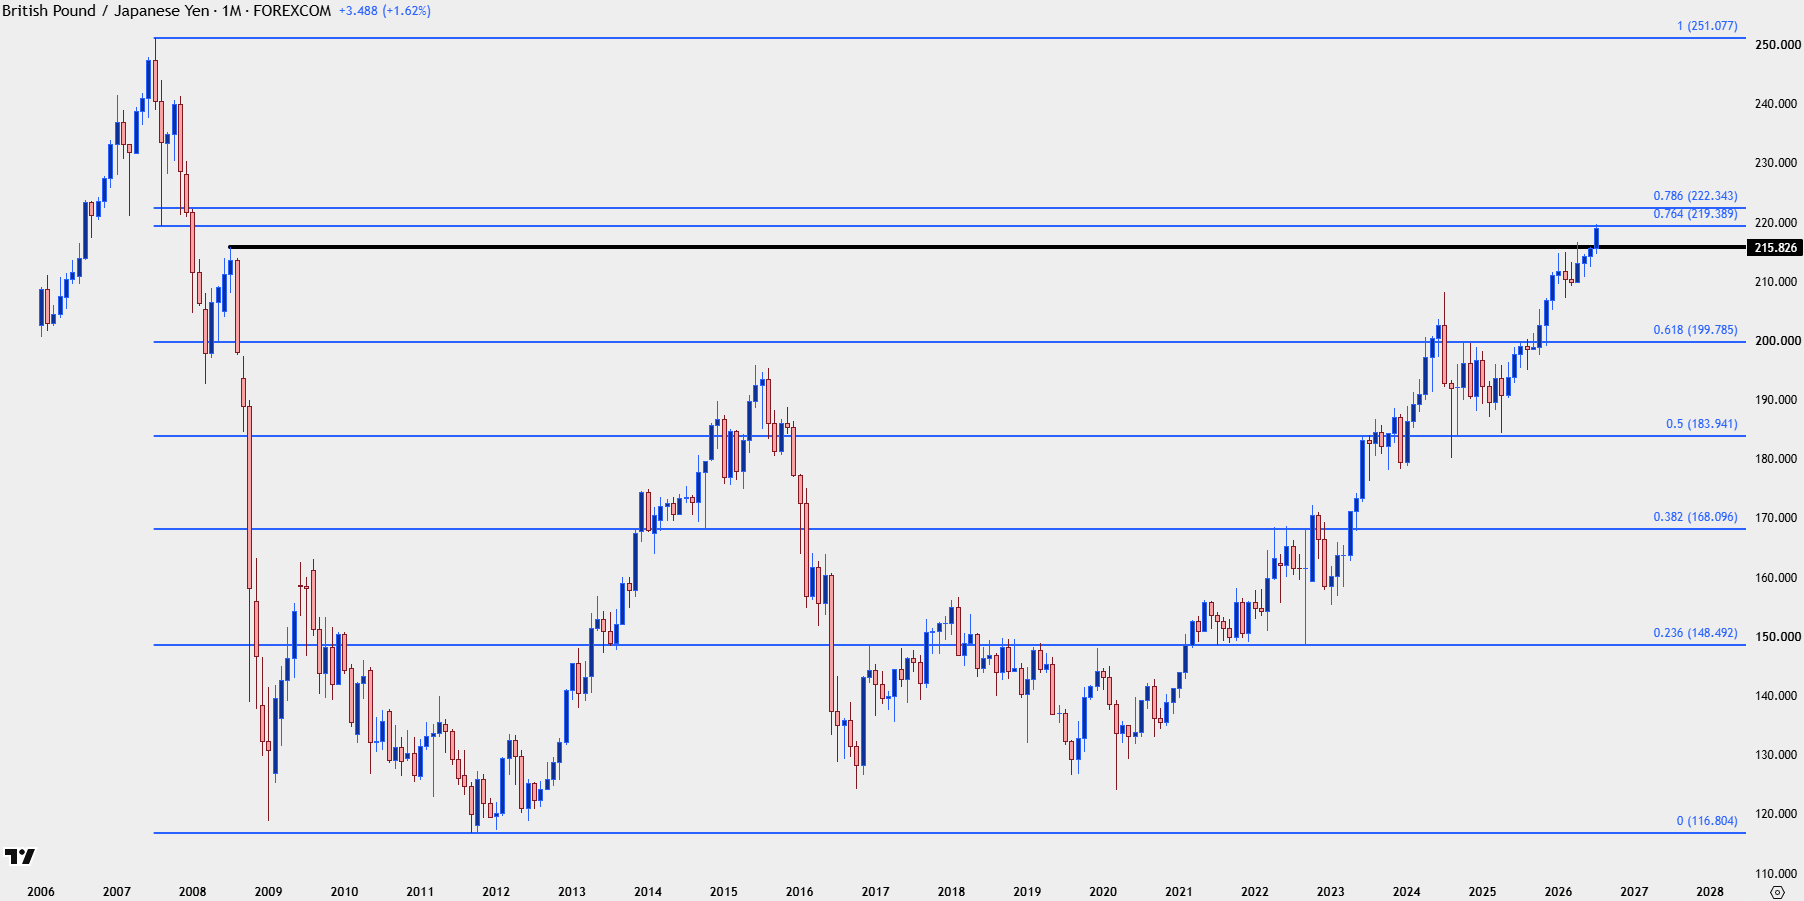
Chart prepared by James Stanley; data derived from Tradingview
Similar to albeit with more relative strength, we have the move pulling back in a short-term counter-trend dynamic. Given the veracity of the breakout, however, we’re also further away from any nearby possible swing points, as prior resistance is all the way down around 217.84 and for that to come into play we’d need a retracement of more than 100 pips from current market price. Ideally, for bullish continuation, buyers would remain more aggressive than that, and something like this is where Fibonacci can come into play as the recent rally has so far only given back 23.6% of the move.
The 38.2% retracement of that same move sets up as support potential, and this would be a more attractive area for bulls to show hints of topside continuation. From that same retracement, 218.41 and 218.04 would also be of interest.
GBP/JPY Two-Hour Price Chart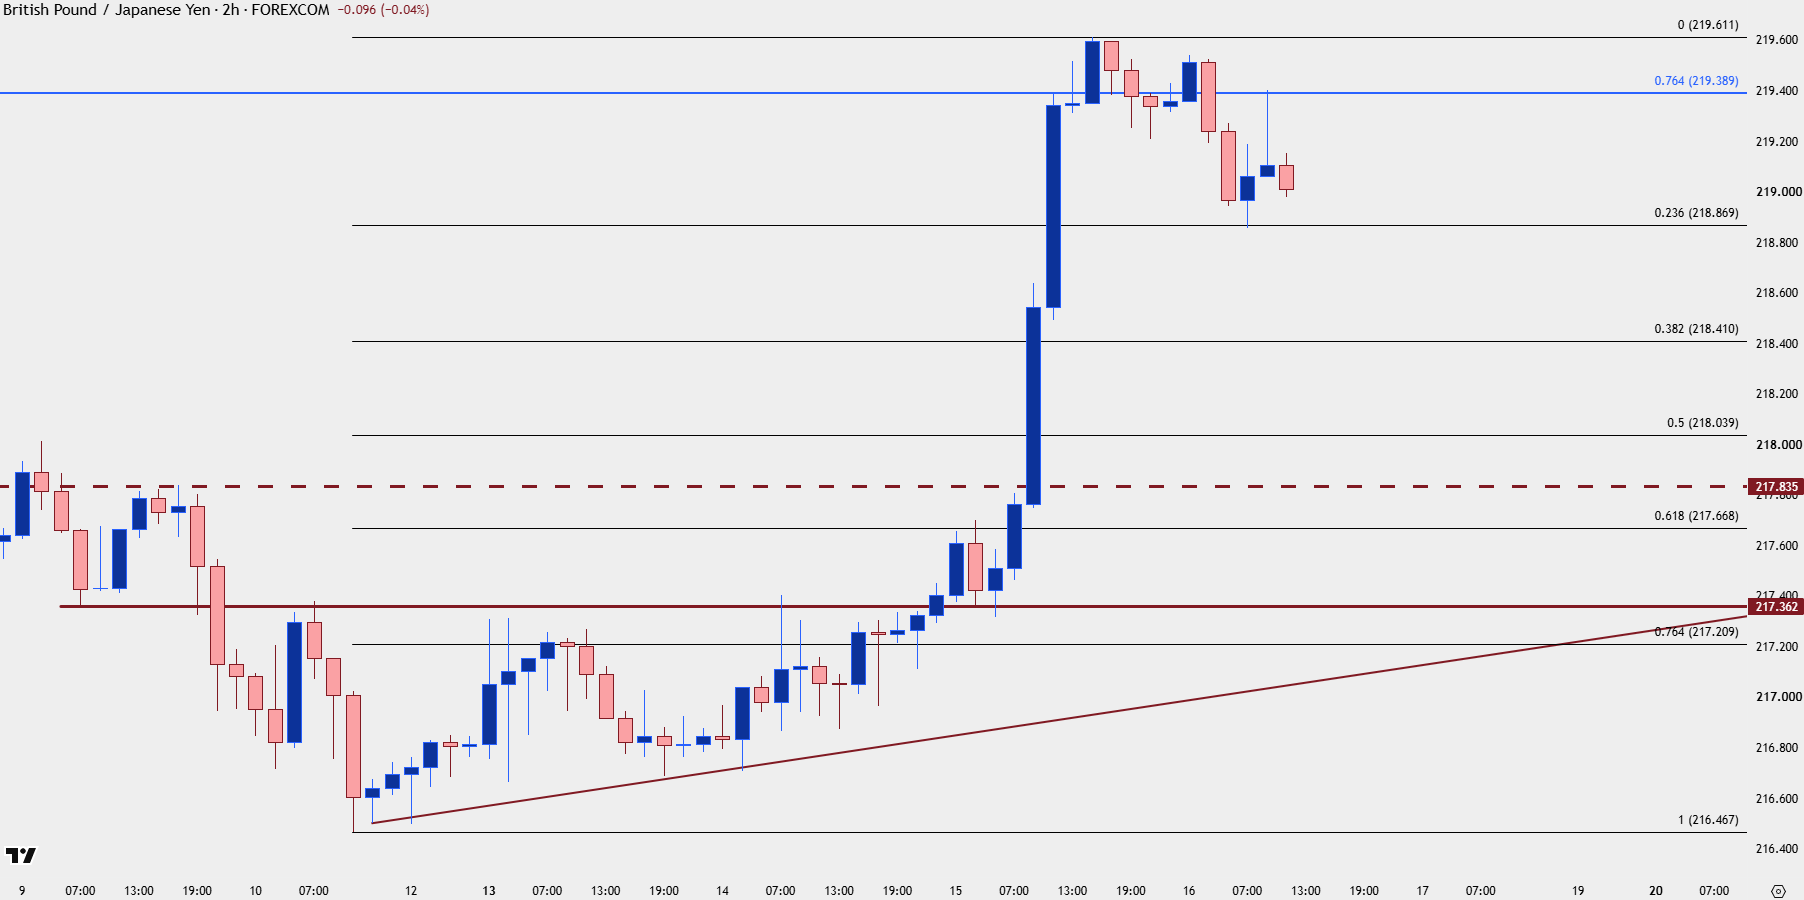
Chart prepared by James Stanley; data derived from Tradingview
--- written by James Stanley, Senior Market Analyst, Global Macro
Related tags:








Web Trader platform
Our sophisticated web-based platform is packed with features.
Open an account today
Experience award-winning platforms with fast and secure execution.
Economic calendar
Related articles

DAX, GBP/USD Forecast: Two trades to watch 2708
DAX rises as Nvidia boosts AI trade ahead of Jackson Hole. GBP/USD slips below 1.36 as Fed expectations shift.


Gold Pullback Risk Builds as AUD/USD and USD/CAD Set Up
Gold has stalled near major resistance after a powerful rally, while AUD/USD looks stretched and USD/CAD attempts to extend its rebound.

British Pound Short-term Outlook: GBP/USD Bulls Confront Resistance at Three-Month Highs 8 20 2026
The Sterling rally remains firmly intact, but stretched momentum is raising the risk of a near-term inflection as the bulls test resistance.