


Crude Oil Weekly Outlook: BRICS Summit Calls for Maximum Restraint
Crude Oil Weekly Outlook: BRICS Summit Calls for Maximum Restraint as the Energy Crisis Reaches Critical Economic Tipping Points
Written by
Razan Hilal
Market Analyst
The BRICS summit called for maximum restraint this weekend as the energy crisis reaches critical economic tipping points. Diplomacy was presented as the preferred path toward resolution rather than escalation, potentially supporting the latest pullback in crude oil prices.
This diplomatic narrative follows steep price surges across WTI, Brent and the energy sector ETF, including:
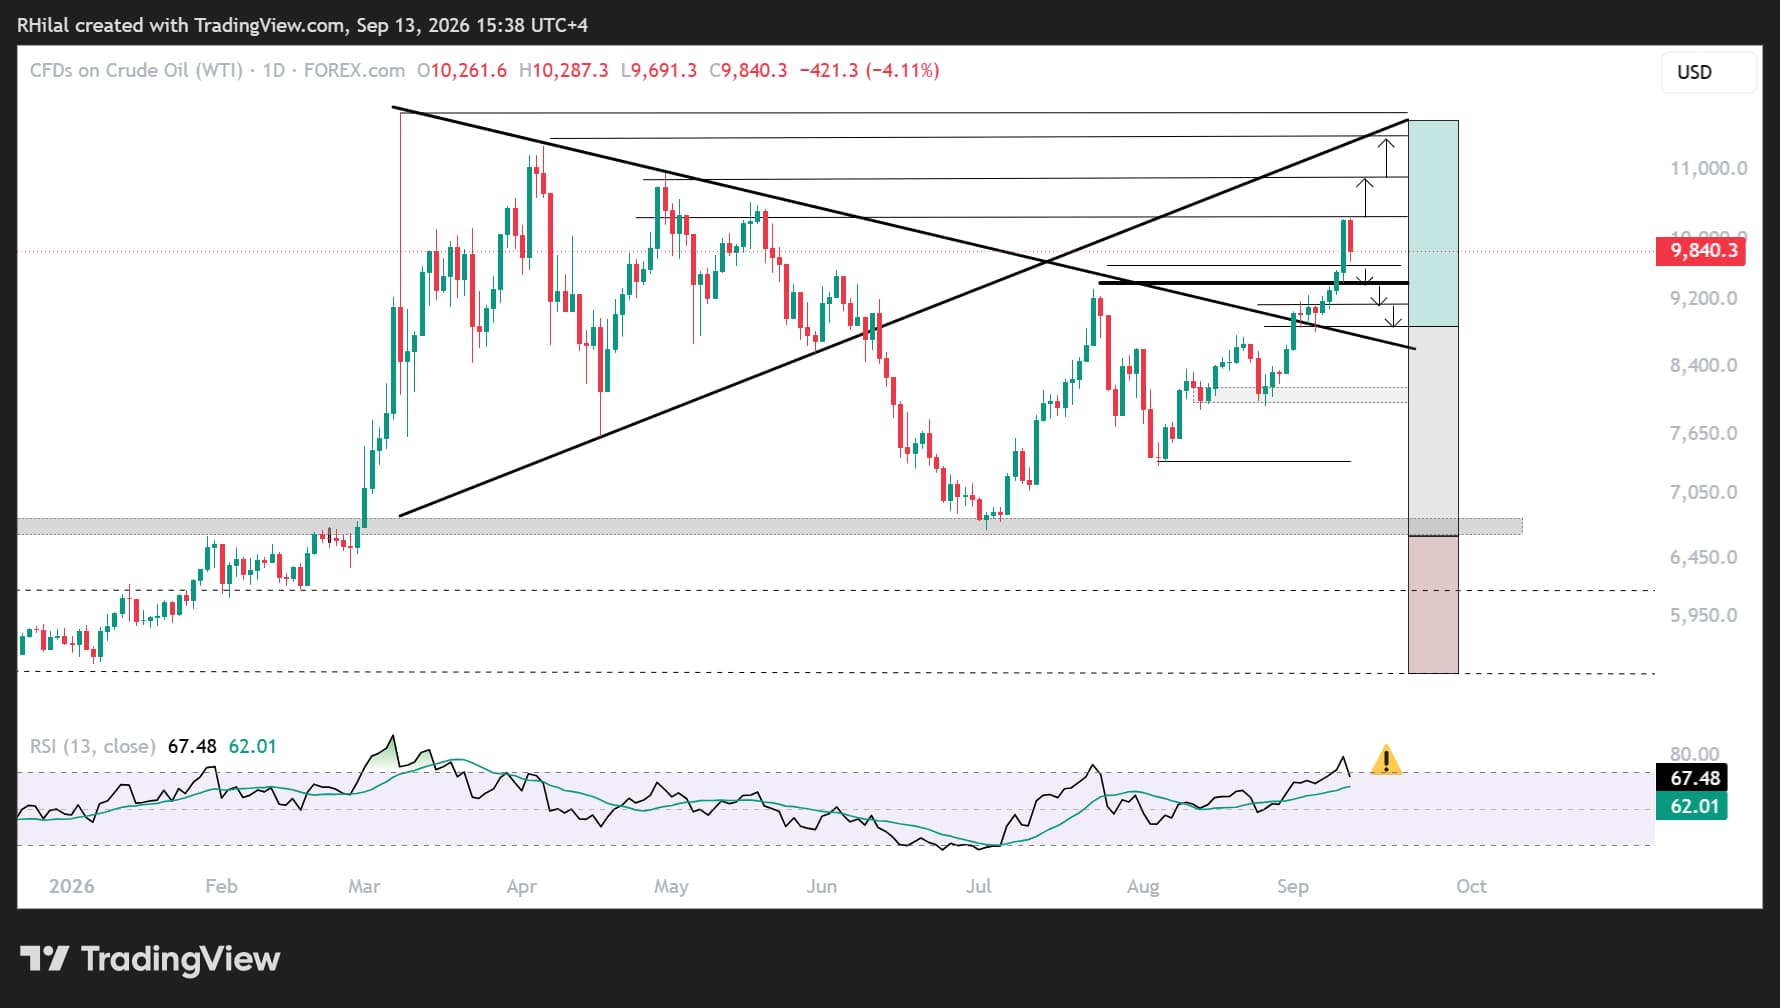
- WTI breaking above 7-month declining resistance near $94.
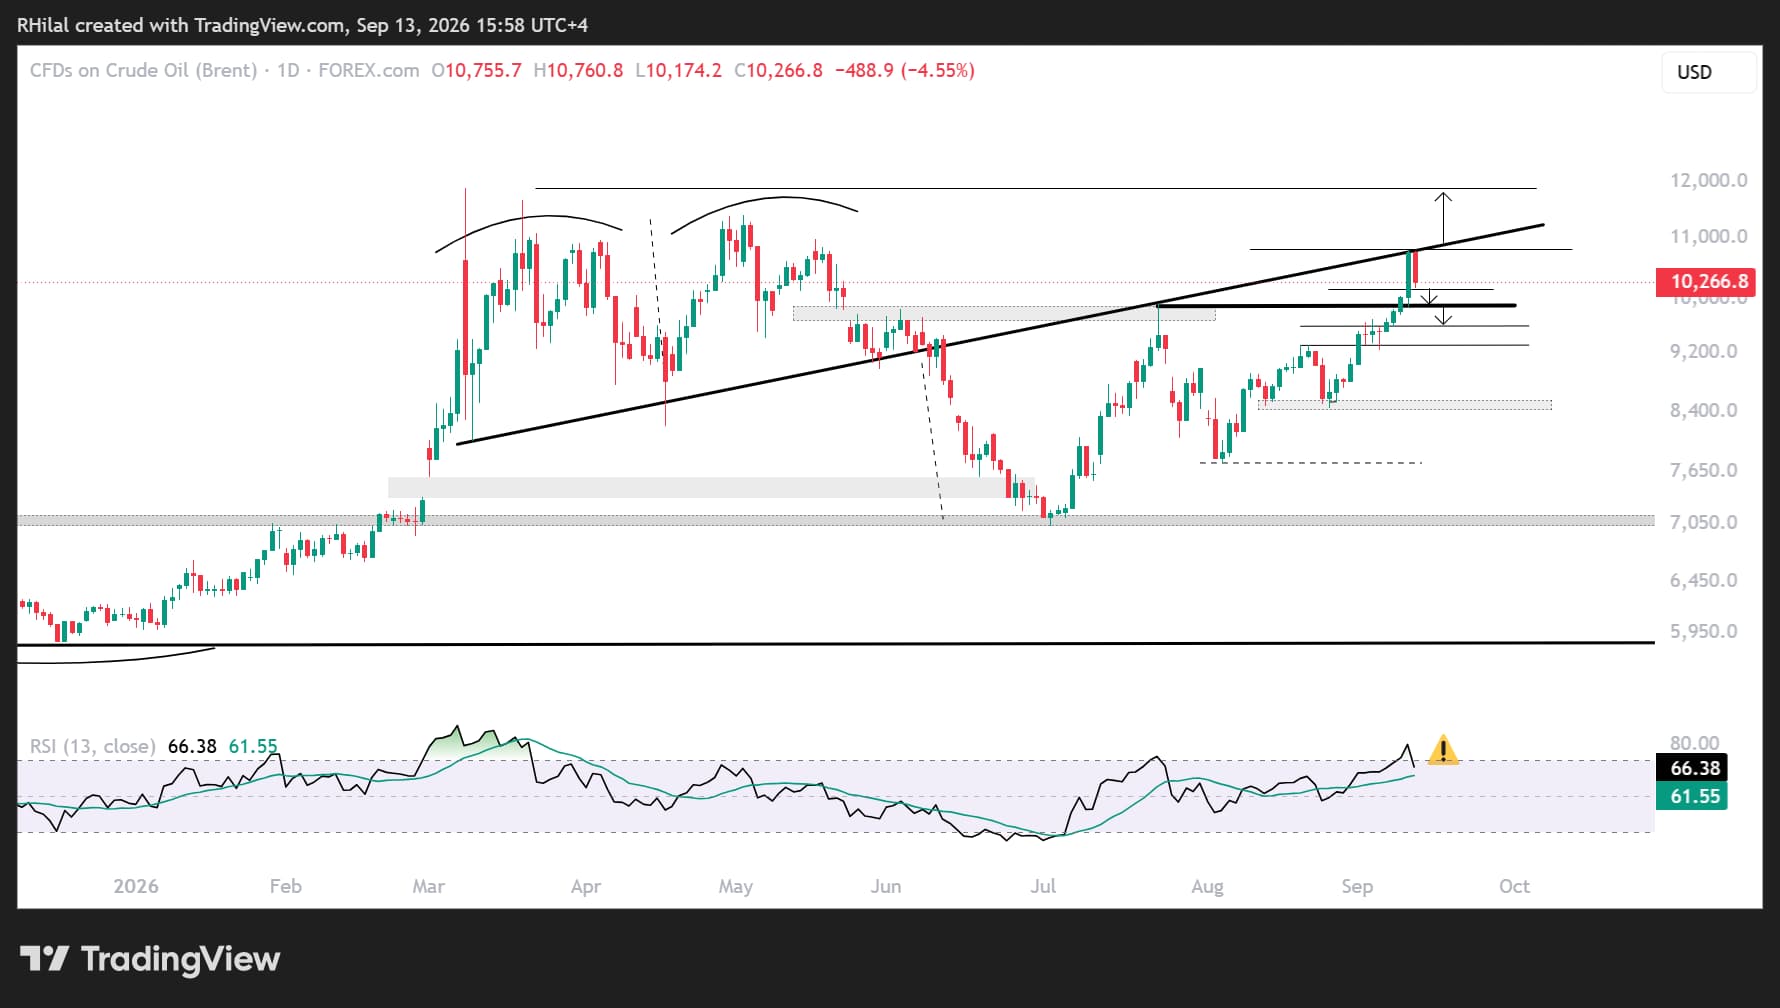
- Brent rallying toward its 7-month declining resistance near $108.
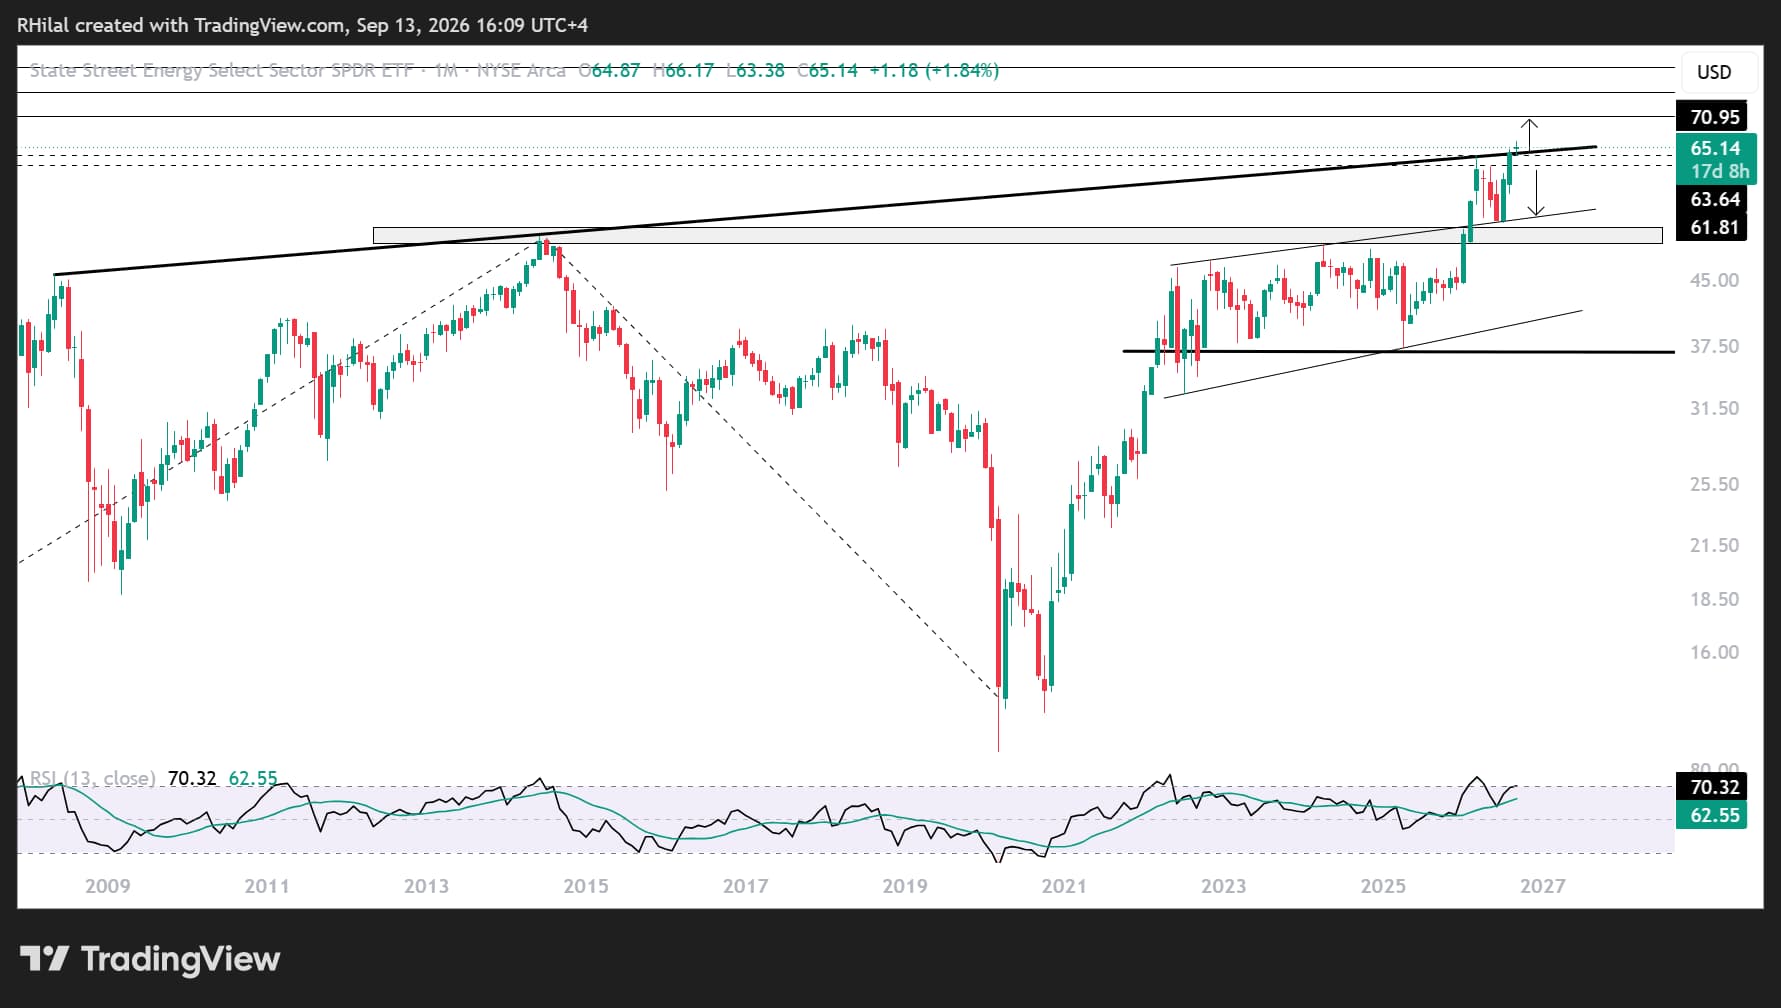
- The Energy Select Sector SPDR Fund (XLE) breaking above its 2008–2026 resistance.
These bullish setups reflected rising inflationary risks, while transportation disruptions also contributed to food-price inflation. The global food-price index has reached levels last seen in 2022.
The BRICS alliance was created in 2009 as a forum for major emerging economies seeking greater influence in institutions traditionally dominated by Western powers. Its members include the UAE, India, China and Russia, representing approximately 50% of the world’s population, 40% of global GDP and more than 25% of global trade.
In his opening remarks at the summit, Indian Prime Minister Narendra Modi stated: “We have to transform this pyramid of privilege into a platform of partnership.”
The statement reflects a shift toward resolution and cooperation rather than further escalation, which could help limit pressure on global economic growth and reduce the risk of disruptions to oil exports, shipping routes and energy flows through the Strait of Hormuz.
The summit does not guarantee an end to the war. At the same time, U.S. President Donald Trump has vowed to bring these risks to an end as the U.S. midterm elections approach, including by seeking an end to the conflict involving Iran and encouraging lower crude oil prices.
This remains speculative, but it shifts the narrative toward a potential resolution rather than continued escalation. The crude oil setups below could help determine whether that shift is confirmed by price action.
USOIL: Daily Time Frame — Log Scale
Source: TradingView
For WTI, the 7-month resistance level that has capped lower highs since March 2026 remains the main barometer for the bullish or bearish bias.
- The key support levels align with the July 2026 high near $94 and the September 4 low near $88.
- A breakdown below these levels could confirm a broader de-escalation narrative.
- The $88 area also aligns with the 61.8% Fibonacci retracement of the August 26–September 11 advance, making it another major confluence zone to monitor.
Bullish scenario: A daily close above $103 would redirect WTI toward $108, which also represents the 78.6% Fibonacci retracement of the March–July downtrend.
A sustained move above this area would reinforce the potential for another rally toward the yearly highs.
Overall, bullish risks remain elevated as long as crude oil prices hold above the July 2026 highs.
The current oil-market structure continues to interact with inflation data, Treasury yields and expectations for the Federal Reserve’s policy decision.
The broader risk-off narrative could begin to reverse if crude oil breaks below its key support levels, Treasury yields extend their pullback and geopolitical tensions begin to ease ahead of the U.S. midterm elections.
UKOIL: Daily Time Frame — Log Scale
Source: TradingView
For Brent crude, price action reached a major confluence zone, increasing the possibility that a short-term top may have formed.
The confluence zone includes:
- The 7-month trendline that served as support between March and June 2026 before turning into resistance between July and September 2026.
- The 78.6% Fibonacci retracement of the March–July 2026 downtrend near $108.
- Overbought momentum conditions last seen in March, close to the yearly highs.
The pullback was expected given the steepness of the rally and the importance of this confluence zone.
Bullish scenario: Reclaiming the $108 mark would restore the longer-term bullish outlook and reinforce inflationary and geopolitical escalation risks.
Such a move could redirect Brent toward the yearly highs.
Bearish scenario: A move back below 101.60 and the July 2026 high near $99 would support a short-term de-escalation narrative.
The next downside levels would be $95.70 and $93, corresponding to Fibonacci retracement levels of the advance between August 26 and September 11.
XLE: Monthly Time Frame — Log Scale
Source: TradingView
From an ETF perspective, XLE reflects the broader performance of the energy sector.
Price action broke above a major 2008–2026 resistance level, which turned into support in September 2026. For now, that support is holding above $63.50.
The price structure remains consistent with persistent geopolitical tensions and signals potential long-term stress across the energy market.
Bullish scenario: Holding above $63.50 and reclaiming the $65.50 area would reinforce the bullish forecast and open the door to new record highs.
Upside targets include the Fibonacci extension levels of the 2002–2014–2020 cycle near $68, $73 and $77.
This scenario would likely align with a broader escalation scenario.
Bearish scenario: A breakdown below the $61–$60 zone would reaffirm the strength of the multi-year resistance level and pressure XLE into another corrective cycle, targeting $58 and $51.
This scenario would likely align with broader de-escalation across geopolitical tensions.
Written by Razan Hilal, CMT
Follow on X: @Rh_waves
Latest market news










Web Trader platform
Our sophisticated web-based platform is packed with features.
Open an account today
Experience award-winning platforms with fast and secure execution.
Economic calendar
Related articles

Bitcoin Forecast: BTC/USD Back to $80K Ahead of Warsh’s Jackson Hole Speech
After surging over $15,000 in the past 10 days alone, there is risk of a near-term pullback if Warsh says anything remotely hawkish at Jackson Hole - what are the levels to watch from here?


Euro Forecast: Will Core PCE Tip the Scales for the Fed?
The last Core PCE before the Fed's September meeting will mark 65 straight months above the central bank's 2% target - will it be enough to push the FOMC toward a rate hike?

EUR/USD forecast: Technical Tuesday | August 25, 2026
The relative calm in the energy and bond markets have allowed the US dollar and equities to make a slightly positive start to the week. America’s economic war on Iran also failed to trigger any panic, leaving investors with little to chew over until the release of US inflation data on Wednesday and Kevin Warsh’s speech at the Jackson Hole Symposium on Friday.