


EUR/USD and Nasdaq Forecast: Dollar Slips as Nasdaq Rallies on Hormuz Optimism
The US Dollar Index (DXY) has slipped back below the 100 mark, while US equity indices continue to push toward fresh record highs as markets increasingly anticipate a potential breakthrough in US-Iran negotiations.
Written by
Razan Hilal
Market Analyst
The US Dollar Index (DXY) has slipped back below the 100 mark, while US equity indices continue to push toward fresh record highs as markets increasingly anticipate a potential breakthrough in US-Iran negotiations. Optimism strengthened after Qatar indicated that a new draft agreement is being finalized.
Despite ongoing fluctuations in headlines surrounding the US-Iran talks and lingering expectations of a Federal Reserve rate hike in September, market sentiment continues to favor a risk-on environment during the summer trading season.
Key market developments include:
- Dow Jones trading at fresh record highs above 53,300. GBP/USD, Dow Jones Forecast: Key Technical Scenarios to Watch
- DXY hovering slightly below 100. US Dollar Index Holds Its Uptrend While the Yen Cracks First
- S&P 500 testing record highs near 7,630
- Nasdaq rebounding above 29,000
Nevertheless, elevated Treasury yields and persistent inflation concerns remain important risks despite the recent rally, particularly until a lasting security framework is established between the United States and Iran.
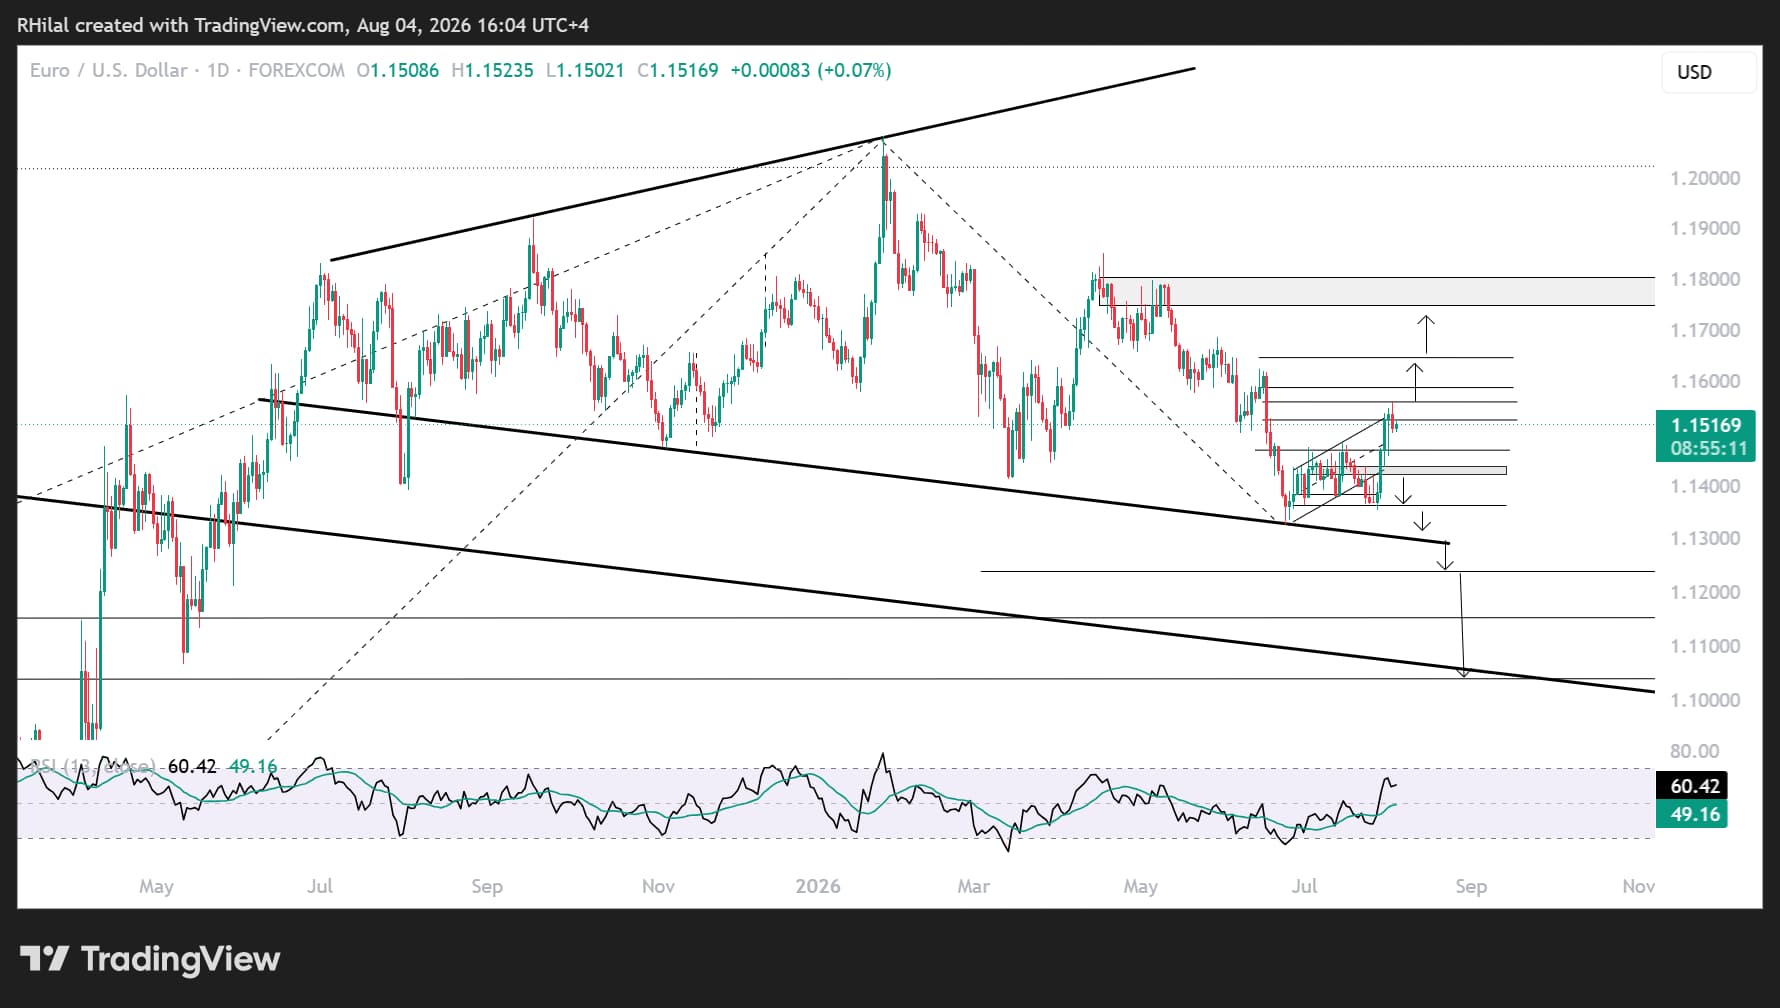
EUR/USD Price Outlook: Daily Time Frame – Log Scale
Source: TradingView
EUR/USD remains below the 1.1560 resistance level and beneath the 38.2% Fibonacci retracement of the April-June decline after rebounding from the descending trendline connecting the lower lows since August 2025. Meanwhile, the DXY's ability to hold above its 2026 uptrend and the 99.30 support area continues to limit the euro's recovery.
Bullish Scenario
The bullish outlook is likely to remain limited unless the DXY breaks decisively below 99.30, while weekly momentum remains below the neutral 50 level.
A sustained breakout above 1.1560 would expose the following upside targets:
- 1.1590 – 50% Fibonacci retracement.
- 1.1650 – 61.8% Fibonacci retracement and a high-probability pullback zone. A sustained break above this level would significantly strengthen the bullish outlook and expose the 1.1800 region.
Bearish Scenario
A breakdown below the 1.1460-1.1420 support zone would expose the yearly lows near 1.1300-1.1280, where price action could either rebound or confirm a decisive break below the August 2025-July 2026 consolidation range.
Such a move would expose the key Fibonacci extension levels of the April-June-August decline:
- 1.1240 – 61.8% extension.
- 1.1130 – 78.6% extension.
- 1.1030 – 100% extension and a high-probability rebound zone, aligning with the May 2025 low and the upper boundary of the well-respected 2008-2025 ascending channel.
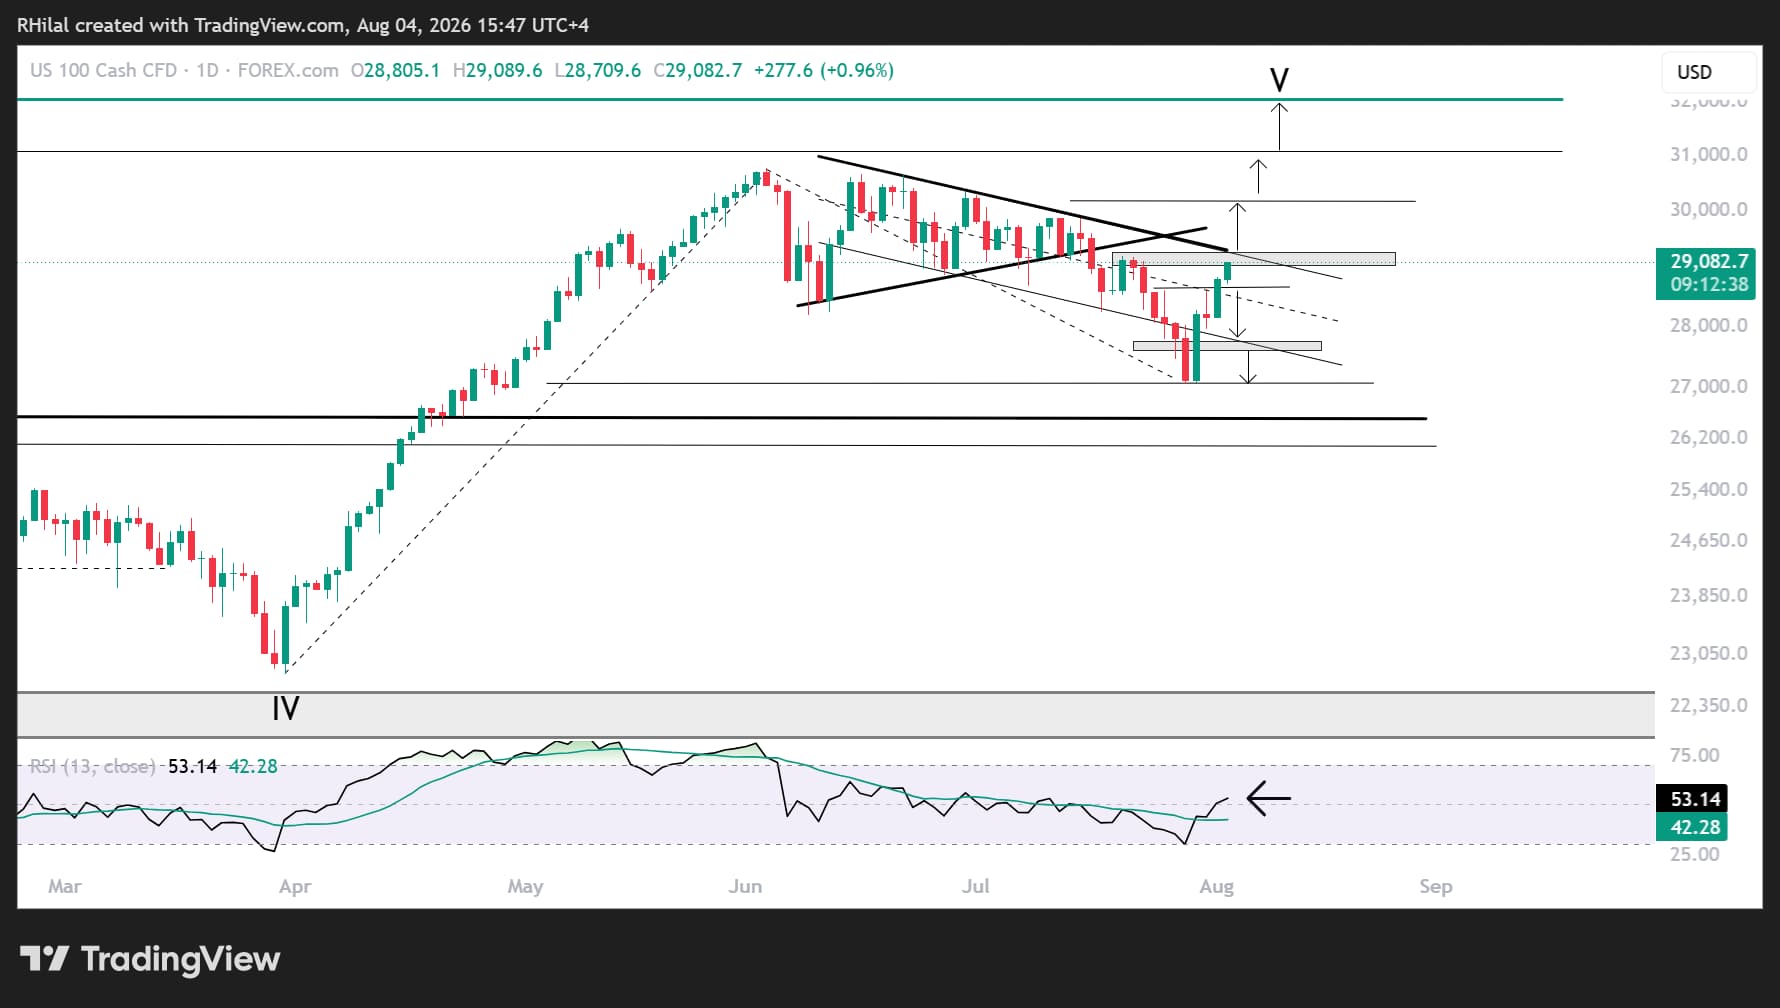
Nasdaq Price Outlook: Daily Time Frame – Log Scale
Source: TradingView
The Nasdaq's daily outlook remains cautiously bullish as price action approaches the descending resistance trendline connecting the lower highs since June 2026, currently near 29,300. Daily momentum also remains constructive, holding above the neutral 50 level.
Bullish Scenario
A breakout above the multi-month descending resistance near 29,300, which also aligns with the 27.2% Fibonacci extension of the April-June-July advance, would expose the following upside targets:
- 30,100 – 38.2% extension.
- 31,000 – 50% extension.
- 32,000 – 61.8% extension and a high-probability pullback zone. This level could coincide with the Dow Jones testing its long-term 2022-2026 channel resistance, as discussed in the previous analysis.
The recent recovery has already achieved its triangle breakout objective while daily momentum has rebounded from oversold conditions last seen in March 2026.
Bearish Scenario
A breakdown below the 28,800-28,600 support zone, which represents the midpoint of the well-defined descending channel from June 2026, would expose the channel's lower boundary near 27,700.
A rebound may emerge from this area. However, a decisive break lower would expose the 27,000-26,500 region, creating another potential long-term buying opportunity. This area aligns with the 61.8% Fibonacci retracement of the March-June advance and the previous highs recorded during 2025-2026.
A lasting resolution to the US-Iran negotiations would likely reduce concerns surrounding a September Fed rate hike, although renewed setbacks in negotiations could quickly reverse the current improvement in market sentiment.
Written by Razan Hilal, CMT
Follow on X: @Rh_waves
Latest market news








Web Trader platform
Our sophisticated web-based platform is packed with features.
Open an account today
Experience award-winning platforms with fast and secure execution.
Economic calendar
Related articles

EUR/USD, AUD/USD, Gold Weekly Technical Outlook 8 31 2026
Sr. Technical Strategist Michael Boutros highlights the levels that matter on the Euro, Aussie and Gold this week.

Euro Short-term Outlook: EUR/USD Pullback Nears Pivotal Uptrend Support 8 28 2026
Warsh's comments accelerated the EUR/USD selloff, raising the stakes as buyers look to stabilize the broader recovery.

Gold and S&P 500 analysis: What now after Warsh’s hawkish speech?
The dollar surged across the board after the Fed Chair Kevin Warsh surprised with a hawkish-leaning speech at the Jackson Hole summit. All the bearish dollar bets that had been accumulated since last Friday on the back of data weakness and bond market troubles had to be squared and that triggered a short squeeze rally for the dollar. Gold and silver dropped, as a result, as too did bitcoin, while US indices were giving back earlier gains.
