

GBP/USD, XAU/USD Weekly Technical Outlook
Sr. Technical Strategist Michael Boutros highlights the levels that matter on the Sterling and Gold charts this week.
Written by
Michael Boutros
Sr. Technical Strategist
Weekly Technical Trade Levels for Sterling and Gold
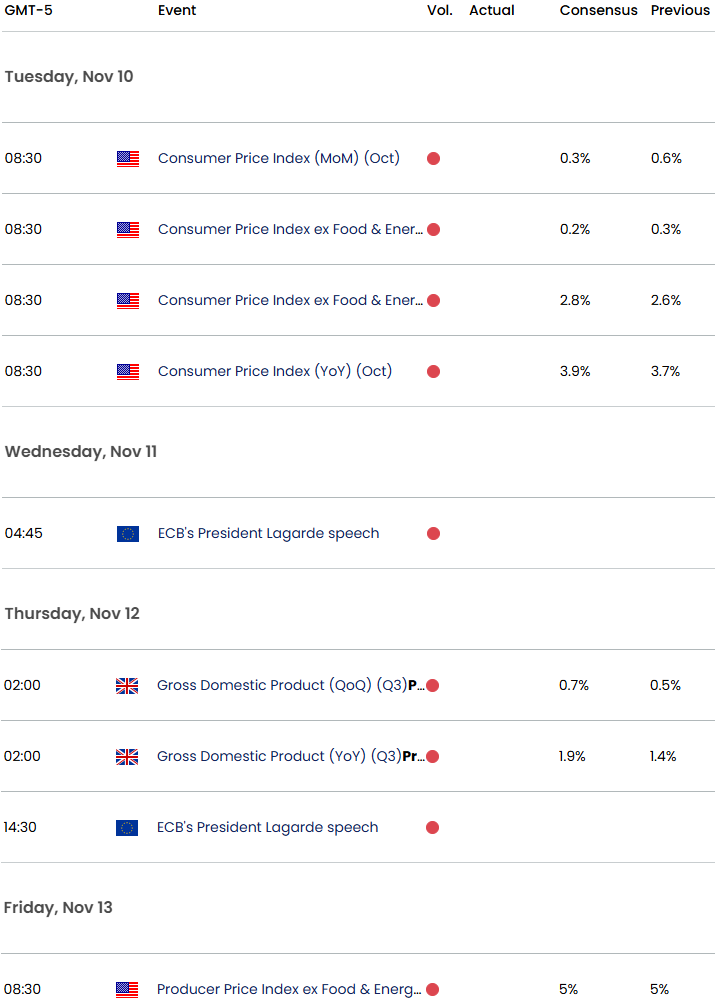
USD Majors event risk this week is concentrated on the U.S. side, with October CPI Tuesday and PPI Friday providing the next tests for expectations of a December Fed hike following last week’s blowout payrolls report. Several Fed officials are also scheduled to speak, keeping the dollar and Treasury yields sensitive to any discussion of inflation and policy. Sterling faces U.K. GDP data Thursday and comments from BoE officials.
British Pound Price Chart – GBP/USD 240min
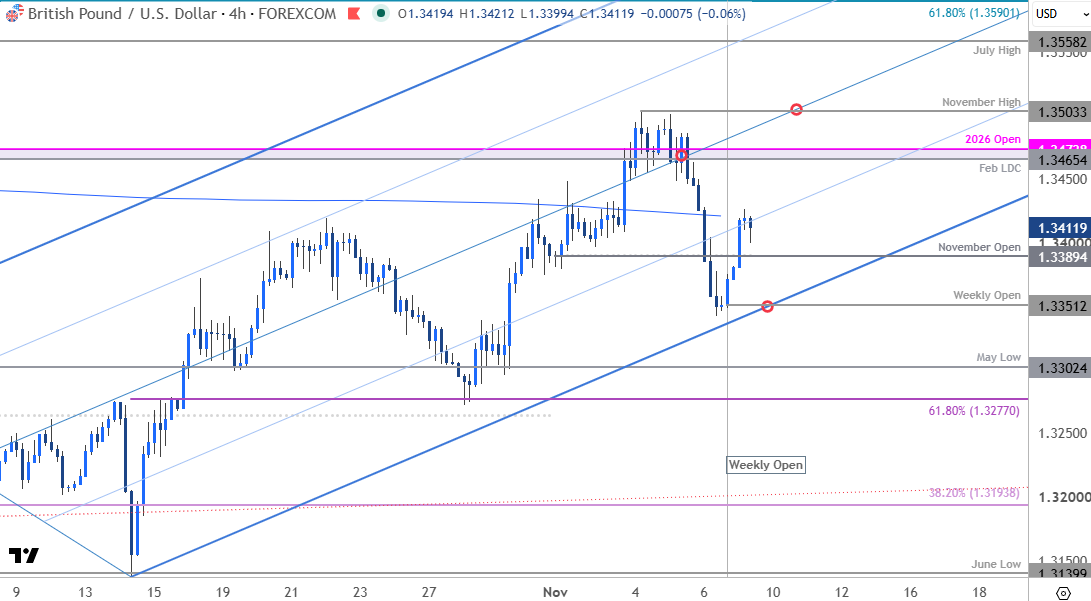
Chart Prepared by Michael Boutros, Sr. Technical Strategist; GBP/USD on TradingView
Notes: Sterling failed to hold / mark a daily close above critical resistance last week at the February low-day close (LDC) and the 2026 yearly open at 1.3465/74. A decline of nearly 1.2% has rebounded just ahead of parallel support of the October uptrend and the focus into the start of this week is on this recovery.
Initial resistance is being tested today at the 200-day moving average (currently near ~1.3419) with key resistance steady at 1.3465/74. A breach / daily close above this threshold would be needed to mark uptrend resumption with subsequent resistance eyed at the monthly high at 1.3503, the July high at 1.3558 and the 61.8% retracement of the yearly range at 1.3590.
Monthly open support rests at 1.3389 and backed by the weekly open at 1.3351. A break / daily close below this threshold would be needed to suggest a more significant high was registered last week, and a more significant reversal is underway. Subsequent support rests at the May low at 1.3302 and the 61.8% retracement of the October rally at 1.3277- look for a larger reaction there IF reached.
Bottom line: Sterling turned from major resistance last week with the rebound now testing the 200-day moving average. From a trading standpoint, losses would need to be limited to 1.351 IF price is heading higher on this stretch with a close above 1.3474 still needed to fuel the next leg of the advance.
Gold Price Chart – XAU/USD 240min
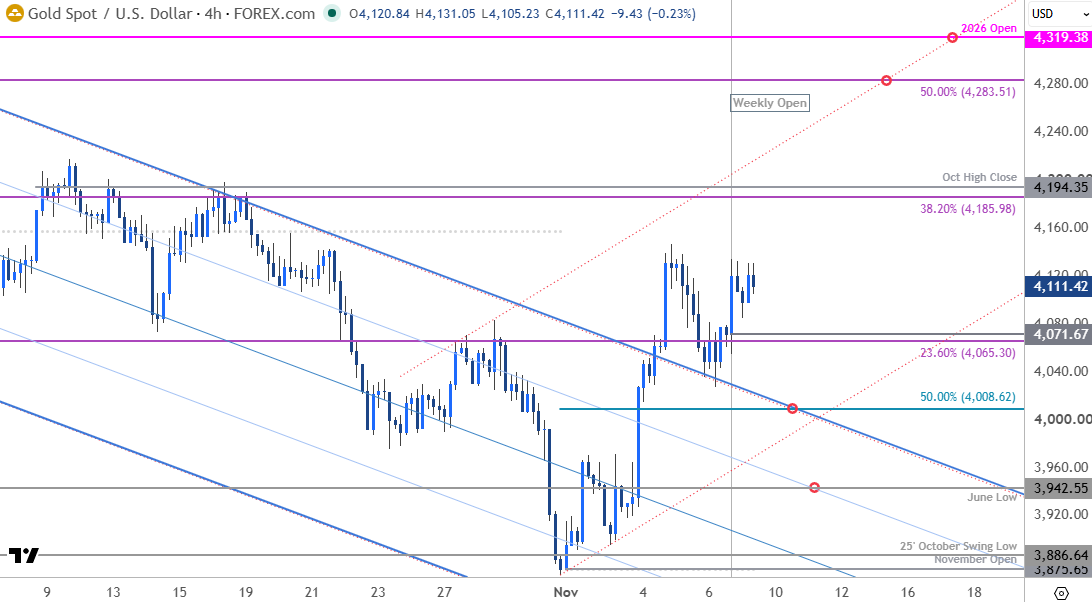
Chart Prepared by Michael Boutros, Sr. Technical Strategist; XAU/USD on TradingView
Notes: Gold broke out of the September downtrend last week with the rally extending more than 7.1% off the yearly low. Daily RSI is now attempting to breach 50 for the first time September and shift in the momentum profile in favor of the bulls would keep this advance viable in the days ahead.
A breach of the highs would keep the focus on initial resistance objectives at the 38.2% retracement of the August decline & the October high-close at 4186/94. A daily close above this threshold is needed to validate the reversal with subsequent resistance objectives eyed at the 50% retracement at 4283 and the 2026 yearly open at 4919.
Initial support now rests with the 23.6% retracement and the weekly open at 4065/72. Near-term bullish invalidation rests with the 50% retracement of the November range at 4008 which converges on former channel resistance mid-week. Losses below this threshold would suggest a false breakout scenario and threaten resumption of the September downtrend. Subsequent support rests at the June low at 3942 and the November open / 2025 October swing low at 3876/86.
Bottom line: Gold broke out of a multi-week downtrend last week and the focus is on price stabilization above former resistance. From a trading standpoint, losses would need to be limited to 4008 IF price is heading higher on this stretch with a break of last week’s high (4147) needed to fuel the next leg of the advance.
Economic Calendar – Key Data Releases
--- Written by Michael Boutros, Senior Technical Strategist
Follow Michael on X @MBForex
Latest market news









Web Trader platform
Our sophisticated web-based platform is packed with features.
Open an account today
Experience award-winning platforms with fast and secure execution.
Economic calendar
Related articles

USD/JPY Weekly Outlook: AI earnings could overshadow the Fed and BoJ
AI sentiment has become a major driver of US Treasury yields and USD/JPY. With Microsoft, Alphabet and Amazon reporting this week, central bank decisions may have competition for traders' attention.


Gold and S&P 500 analysis: What now after Warsh’s hawkish speech?
The dollar surged across the board after the Fed Chair Kevin Warsh surprised with a hawkish-leaning speech at the Jackson Hole summit. All the bearish dollar bets that had been accumulated since last Friday on the back of data weakness and bond market troubles had to be squared and that triggered a short squeeze rally for the dollar. Gold and silver dropped, as a result, as too did bitcoin, while US indices were giving back earlier gains.


EUR/USD forecast: All eyes on Warsh at Jackson Hole - Forex Friday
For much of this week, the EUR/USD has been edging lower with the US dollar regaining some ground after last week’s sell-off that was triggered, in part, by the bond market worries. Investors have been unwilling to bet further against the US dollar so far this week ahead of Kevin Warsh’s keynote speech at the Jackson Hole summit, due later today.