


Gold bulls beware if the dollar starts to turn
Gold has surged to fresh multi-month highs, but tentative signs the US dollar may be trying to bottom provide an early warning for bulls.
Written by
David Scutt
Market Analyst
- Gold tracks silver, copper as dollar weakens
- DXY flashes tentative bottoming signals near 98.75
- Gold trend stays bullish, dollar rebound the risk
Gold has been a major beneficiary of the latest dollar-debasement narrative, hitting fresh multi-month highs in Asian trade on Monday. But tentative signs the US dollar may be trying to bottom ahead of an expected fiscal update from Treasury Secretary Scott Bessent provide a warning for bullion bulls that near-term reversal risks may be growing.
Gold trades with silver, copper and crypto
Source: TradingView, FOREX.com
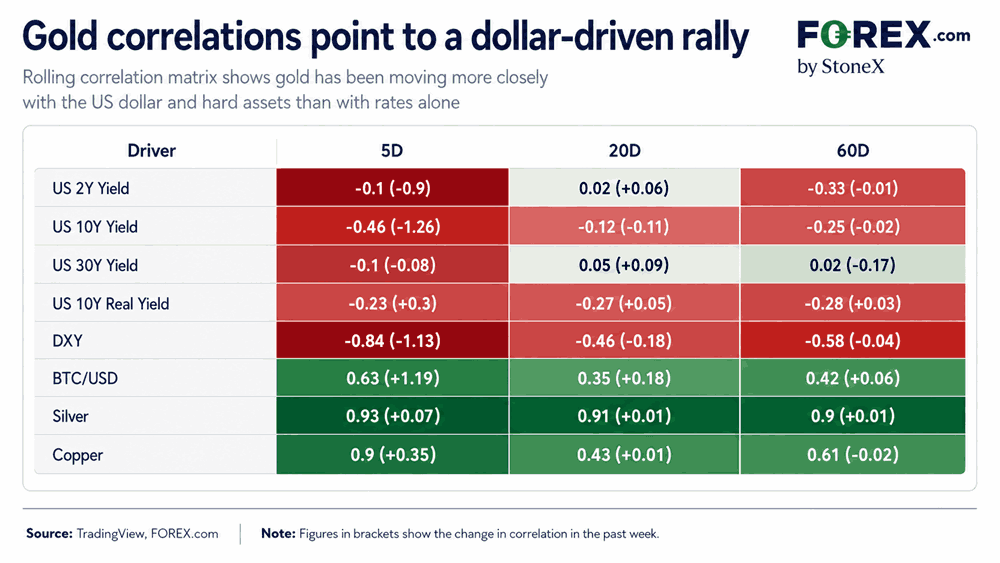
The correlation matrix above reinforces the message. Over the past five days, gold has moved almost in lockstep with silver and copper, with correlations of +0.93 and +0.90 respectively, while its positive relationship with Bitcoin has also strengthened noticeably to +0.63.
At the same time, gold’s inverse correlation with the US dollar index has fallen to -0.84, considerably stronger than its relationship with either nominal or real Treasury yields across the curve. While caution should always be applied given the short time frame, it hints that broad dollar weakness, rather than fluctuations in the curve alone, has been an important driver of gold’s latest leg higher.
This content was created by an affiliate of FOREX.com and represents the views and opinions of the author/speakers, not the views and opinions of FOREX.com, StoneX Group Inc., or its subsidiaries. The content has not been independently reviewed by FOREX.com.
DXY attempting to carve out a bottom?
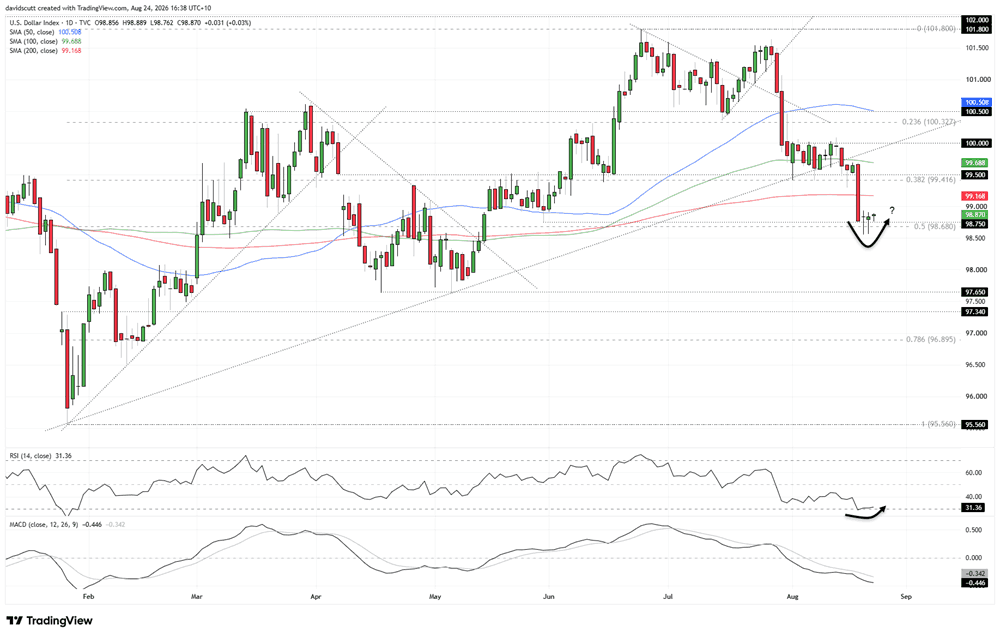
While correlations do not always imply causation and relationships can change abruptly, if the recent inverse relationship between DXY and gold persists, the dollar chart provides some food for thought for gold bulls.
Source: TradingView
DXY looks like it is attempting to bottom, with bids emerging below 98.75 around the 50% retracement of the January to June bull move. A dragonfly doji followed by a hammer after a pronounced bearish move warns of the potential for a squeeze higher ahead of Bessent’s announcement. There are also tentative signs that bearish momentum may have reached its crescendo with RSI (14) crawling back out of oversold territory.
Gold trend remains firmly bullish
Source: TradingView
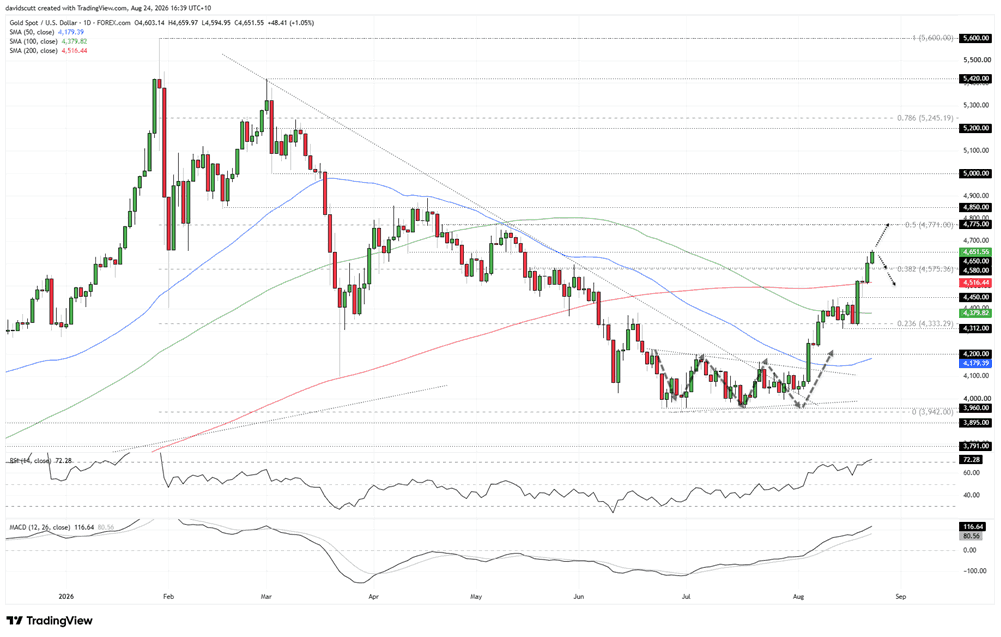
While dollar headwinds may be building, the technical picture for gold remains uniformly bullish. The price broke above its longer-term downtrend in July before staging a dramatic breakout of the wedge structure it had been coiling within for several months. Since then, the price has reclaimed the 50, 100 and 200-day moving averages while continuing to print higher highs and higher lows.
The latest leg higher has taken gold to around $4,650 an ounce, a level that repeatedly acted as both support and resistance earlier this year. That makes it the immediate focal point, particularly given the tentative signs of stabilisation in DXY. Gold has already poked above the level several times during Asian trade without managing to extend the move, making price action into the European session potentially important as volumes pick up.
Above $4,650, the first level to watch is $4,771, the 50% retracement of the January to June bear move. Beyond that sits $4,850, another level that has acted as both support and resistance this year, before the psychologically important $5,000 level comes into view.
On the downside, the first area of interest sits around $4,575-$4,580, where the 38.2% retracement of the January to June bear move converges with former resistance. Below that, the 200-day moving average and $4,450 are the next levels to watch, with the latter marking last week’s breakout zone that was subsequently retested from above.
The oscillators continue to deliver a bullish message. RSI(14) is trending higher and now sits marginally in overbought territory around 72, while MACD has staged a bullish crossover and is now diverging from the signal line in positive territory.
Overall, the setup still favours buying dips. However, the strong inverse relationship with DXY, combined with tentative signs the dollar may be trying to bottom, warns that the risk of a near-term reversal in gold is starting to build.







Web Trader platform
Our sophisticated web-based platform is packed with features.
Open an account today
Experience award-winning platforms with fast and secure execution.
Economic calendar
Related articles

Euro Short-term Outlook: EUR/USD Pullback Nears Pivotal Uptrend Support 8 28 2026
Warsh's comments accelerated the EUR/USD selloff, raising the stakes as buyers look to stabilize the broader recovery.


Gold and S&P 500 analysis: What now after Warsh’s hawkish speech?
The dollar surged across the board after the Fed Chair Kevin Warsh surprised with a hawkish-leaning speech at the Jackson Hole summit. All the bearish dollar bets that had been accumulated since last Friday on the back of data weakness and bond market troubles had to be squared and that triggered a short squeeze rally for the dollar. Gold and silver dropped, as a result, as too did bitcoin, while US indices were giving back earlier gains.


EUR/USD forecast: All eyes on Warsh at Jackson Hole - Forex Friday
For much of this week, the EUR/USD has been edging lower with the US dollar regaining some ground after last week’s sell-off that was triggered, in part, by the bond market worries. Investors have been unwilling to bet further against the US dollar so far this week ahead of Kevin Warsh’s keynote speech at the Jackson Hole summit, due later today.