


Gold forecast: XAU/USD weighed down by reduced haven demand
While the long-term gold forecast remains positive, in the near-term some further weakness should not come as surprise, particularly if stocks continue rising and the metal breaks a key bullish trend line that has consistently provided a floor in 2025.
Written by
Fawad Razaqzada
Market Analyst
The price of gold has fallen over 1.2% so far in today’s session and the metal is down 2.4% on the week. The precious metal is also turning flat on the month after closing unchanged in May, too. The loss of bullish momentum has been triggered by a few factors, including profit-taking, but most importantly it is this: reduced haven demand. While the long-term gold forecast remains positive, in the near-term some further weakness should not come as surprise, particularly if stocks continue rising and the metal breaks a key bullish trend line that has consistently provided a floor in 2025.
Risk assets rally, causing gold to falter
Thanks to the sudden de-escalation in the Israel-Iran conflict, investors have rushed back to the racier tech sector, which has helped to push the Nasdaq 100 to new highs. The loss of haven demand has meant that despite the latest leg down in the dollar, gold has not benefited from this at all. I reckon a bit of a pullback would not be too bad an outcome as that will allow long term technical overbought conditions on higher time frames to work off, allowing the metal to shine again when macro conditions are more favourable once more. The upcoming PCE index should not have too significant of an impact on gold as long as the data doesn't hurt risk appetite. Next week’s key US macro data including the latest nonfarm jobs report should have at least some influence.
Technical gold forecast: XAU/USD testing 2025 trend line
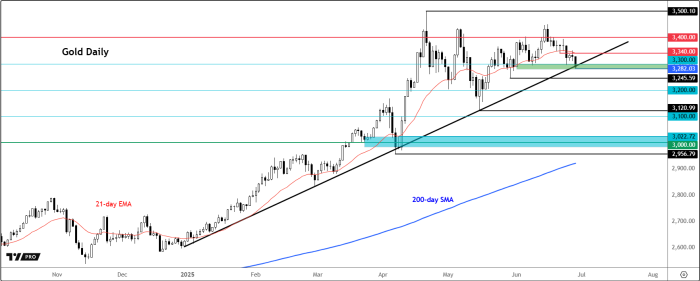
Source: TradingView.com
The price of gold is now testing its 2025 bullish trend line around $3280 area, making this a key level to watch today. A close below it would be a bearish technical development, in which case a deeper correction in early July would be a likely scenario towards some of the levels I have marked on the chart. However, a positive close today, or at least a finish around the $3,300 mark would keep the bulls in charge. The metal would still need to take out $3340 resistance to ignite fresh momentum on the long side, given the current price structure.
All told, consolidation continues to remain the name of the game for now. But the technical gold forecast could turn bearish should we see a close below the bullish trend line.
-- Written by Fawad Razaqzada, Market Analyst
Follow Fawad on Twitter @Trader_F_R
How to trade with City Index
You can trade with City Index by following these four easy steps:
- Open an account, or log in if you’re already a customer
• Open an account in the UK
• Open an account in Australia
• Open an account in Singapore
- Search for the company you want to trade in our award-winning platform
- Choose your position and size, and your stop and limit levels
- Place the trade
Related tags:







Web Trader platform
Our sophisticated web-based platform is packed with features.
Open an account today
Experience award-winning platforms with fast and secure execution.
Economic calendar
Related articles

Euro Short-term Outlook: EUR/USD Pullback Nears Pivotal Uptrend Support 8 28 2026
Warsh's comments accelerated the EUR/USD selloff, raising the stakes as buyers look to stabilize the broader recovery.


Gold and S&P 500 analysis: What now after Warsh’s hawkish speech?
The dollar surged across the board after the Fed Chair Kevin Warsh surprised with a hawkish-leaning speech at the Jackson Hole summit. All the bearish dollar bets that had been accumulated since last Friday on the back of data weakness and bond market troubles had to be squared and that triggered a short squeeze rally for the dollar. Gold and silver dropped, as a result, as too did bitcoin, while US indices were giving back earlier gains.

EUR/USD forecast: All eyes on Warsh at Jackson Hole - Forex Friday
For much of this week, the EUR/USD has been edging lower with the US dollar regaining some ground after last week’s sell-off that was triggered, in part, by the bond market worries. Investors have been unwilling to bet further against the US dollar so far this week ahead of Kevin Warsh’s keynote speech at the Jackson Hole summit, due later today.