


Gold Price Forecast: XAU/USD Record Breakout Sizzles- Exhaustion Risk 10 18 2025
Gold’s record-breaking run stalled on Friday as XAU/USD marks multi-year extremes in range, duration, and momentum. Battle lines drawn on the weekly technical chart.
Written by
Michael Boutros
Sr. Technical Strategist
Gold Technical Forecast: XAU/USD Weekly Trade Levels
- Gold breakout marks ninth-consecutive weekly advance- surges to fresh all-time high
- The move marks the largest single-week range on record, and multi-year extremes in range and momentum.
- Exhaustion risk mounts- US inflation on tap ahead of Fed rate decision (Oct 29)
- Resistance 4084-4113 (key), 4308, 4583– Support 3859, 3782 (key), 3666
Gold prices exploded to fresh record highs this week, with XAU/USD extending the breakout to multi-year extremes in range, duration, and momentum. While the broader outlook remains constructive, the immediate advance may be vulnerable from these levels as the exhaustion signals mount. Traders now turn their focus to key U.S. inflation data due next week, with the September CPI release likely to set the tone ahead of the FOMC rate decision. The battle lines are drawn on the XAU/USD weekly chart, and the stakes couldn’t be higher.
Review my latest Weekly Strategy Webinar for an in-depth breakdown of this gold setup and more. Join live on Monday’s at 8:30am EST.
Gold Price Chart – XAU/USD Weekly
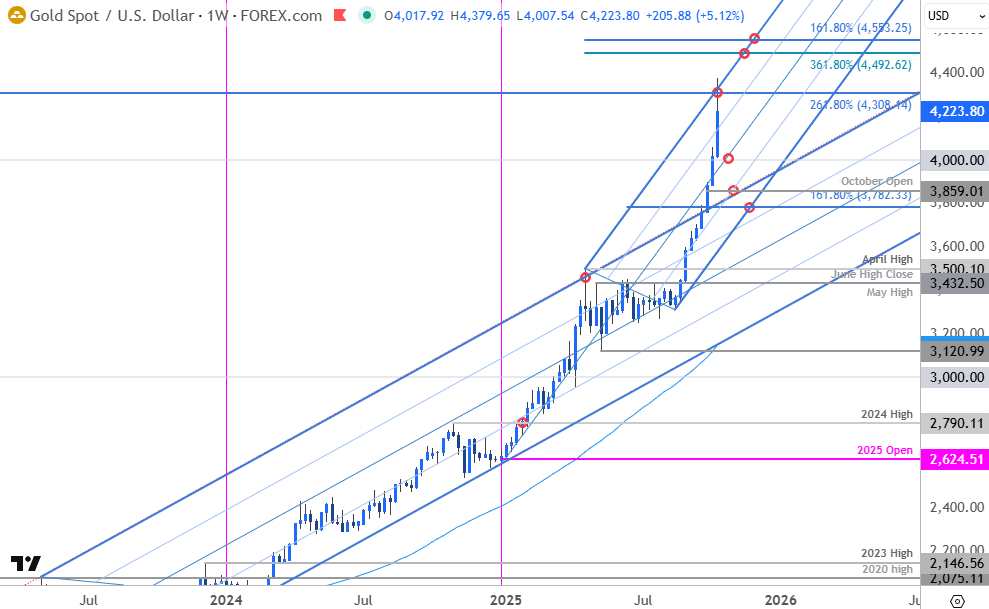
Chart Prepared by Michael Boutros, Sr. Technical Strategist; XAU/USD on TradingView
Technical Outlook: In my last Gold Technical Forecast we noted that the, “bulls are in control with breach of a multi-year uptrend now extended towards initial resistance hurdles. From a trading standpoint, look to reduce portions of long-exposure / raise protective stops on a stretch towards 4100- losses would need to be limited to 3782 IF price is heading higher on this stretch with a close above the 75% parallel needed to fuel the next major leg of the advance.” XAU/USD broke higher this week with the bulls exhausting into confluent uptrend resistance on Friday.
This week’s rally marks the largest single-week range on record and the ninth consecutive weekly advance— the first such streak since August 2020, when the yearly high was registered. Weekly momentum has also surged to its highest level since April 2006, which likewise coincided with that year’s peak in gold. These technical observations suggest that while the broader outlook remains constructive, the immediate advance may be vulnerable at these levels.
Initial weekly support rests along the median-line, currently near the 4000 mark and a break / weekly close below this slope would be needed to suggest a more significant high is in place / a larger correction is underway. Monthly-open support rests at 3859 with broader bullish invalidation now raise to the 61.8% extension of the May advance at 3782.
Weekly resistance is eyed with the upper parallel / 2.618% extension of the 2015 advance at 4308- a topside breach / weekly close above this threshold would threaten another bout of accelerated gains with the next major technical considerations eyed at the 3.618% extension of the April decline at 4492 and the 1.618% extension of yearly advance at 4553.
Bottom line: The gold breakout extended into record highs this week with multi-year extremes registered in momentum, range, and duration- the exhaustion risk is mounting. From a trading standpoint, losses would need to be limited to 4000 IF price is heading higher on this stretch with a weekly close above 4308 needed to fuel the next major leg of the advance.
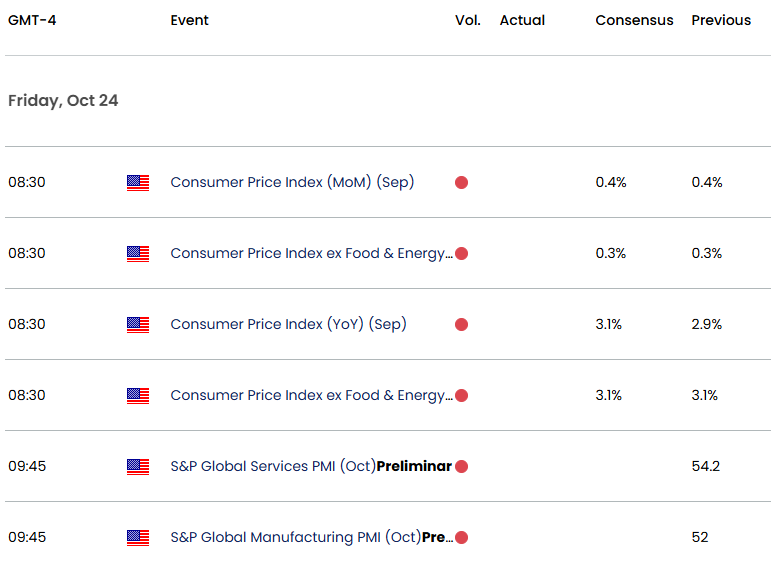
Keep in mind that key U.S. inflation data is due next week, with September CPI figures on tap Friday. The release will be pivotal ahead of the FOMC interest rate decision the following week, and traders will be watching Fed Fund Futures closely for any shift in rate expectations into year-end. In the meantime, traders will be closely monitoring developments regarding the escalating China trade dispute and the ongoing U.S. government shutdown. Headline risk over the next few weeks will be significant- stay nimble and watch the weekly closes for guidance. I’ll publish an updated Gold Short-term Outlook next week for a closer look at the near-term XAU/USD technical trade levels.
Key US Economic Data Releases
Economic Calendar - latest economic developments and upcoming event risk.
Active Weekly Technical Charts
- Swiss Franc (USD/CHF)
- Australian Dollar (AUD/USD)
- British Pound (GBP/USD)
- Japanese Yen (USD/JPY)
- Crude Oil (WTI)
- Bitcoin (BTC/USD) / Ethereum (ETH/USD)
- S&P 500, Nasdaq, Dow
- Canadian Dollar (USD/CAD)
- US Dollar Index (DXY)
- Euro (EUR/USD)
--- Written by Michael Boutros, Sr Technical Strategist
Follow Michael on X @MBForex







Web Trader platform
Our sophisticated web-based platform is packed with features.
Open an account today
Experience award-winning platforms with fast and secure execution.
Economic calendar
Related articles

USD/JPY weekly outlook: Payrolls may challenge the Fed’s hawkish reset
USD/JPY has finally woken from its slumber. Payrolls now loom as the key test of whether the latest hawkish repricing sticks or sinks.

Euro Short-term Outlook: EUR/USD Pullback Nears Pivotal Uptrend Support 8 28 2026
Warsh's comments accelerated the EUR/USD selloff, raising the stakes as buyers look to stabilize the broader recovery.

Gold and S&P 500 analysis: What now after Warsh’s hawkish speech?
The dollar surged across the board after the Fed Chair Kevin Warsh surprised with a hawkish-leaning speech at the Jackson Hole summit. All the bearish dollar bets that had been accumulated since last Friday on the back of data weakness and bond market troubles had to be squared and that triggered a short squeeze rally for the dollar. Gold and silver dropped, as a result, as too did bitcoin, while US indices were giving back earlier gains.
