


Gold Price Short-term Outlook: XAU/USD Bulls Try to Carve Out a Low After 30% Drop 7 7 2026
Gold is trying to stabilize after a nearly 30% drop off the record high, with XAU/USD bulls attempting to build a more durable low. Fed minutes on tap.
Written by
Michael Boutros
Sr. Technical Strategist
Gold Technical Outlook: XAU/USD Short-term Trade Levels
- Gold has fallen nearly 30% from the record high after another sharp decline into the close of June.
- XAU/USD has rebounded from the yearly lows, with momentum divergence suggesting downside pressure may be fading.
- The recovery is now testing whether buyers can defend a key pivot zone and build a more durable low.
- FOMC minutes could provide the next catalyst as traders reassess the Fed outlook after weaker payrolls data.
- Resistance 4214, 4305/19 (key), 4367- Support 4074/98, 4007 (key), 3951
Gold is attempting to stabilize after a nearly 30% decline from the record high, with XAU/USD rebounding from fresh yearly lows on building momentum divergence. The recovery has brought price back above a key pivot zone, but buyers still need to prove they can defend support and extend the rebound into a broader recovery. With FOMC minutes on tap and markets reassessing the Fed outlook after weaker payrolls data, traders are watching to see whether gold can carve out a more durable low or if the broader downtrend reasserts itself. Battle lines drawn on the XAU/USD short-term technical charts.
Review my latest Weekly Strategy Webinar for an in-depth breakdown of this gold technical setup and more. Join live on Monday’s at 8:30am EST.
Gold Price Chart – XAU/USD Daily
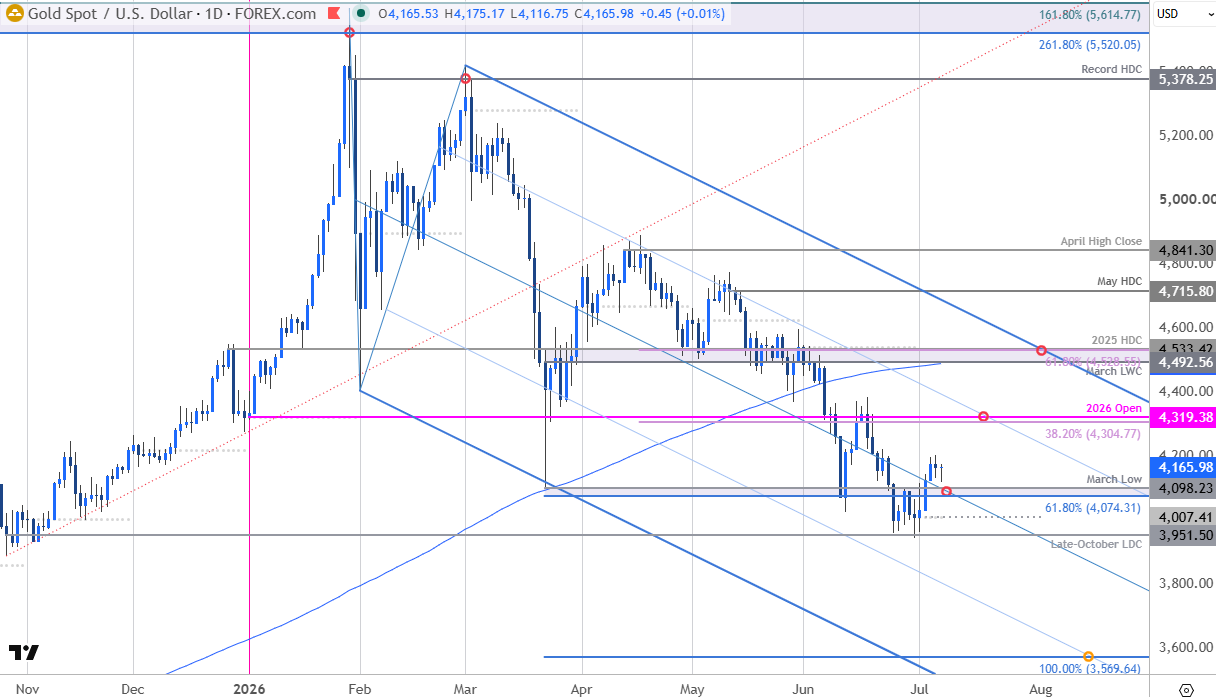
Chart Prepared by Michael Boutros, Sr. Technical Strategist; XAU/USD on TradingView
Technical Outlook: In last month’s Gold Short-term Outlook we noted that XAU/USD had recovered back into the yearly open and that, “From a trading standpoint, losses should be limited to 4212 IF price is heading higher on this stretch with a close above 4540 needed to validate a near-term technical low and fuel the next leg of the advance.” The rally faltered the next day with gold plunging another 10% into the close of June before settling just above the late-October low-day close (LDC) at 3951.
A rebound on strong momentum divergence into the start of the month has extended more than 6.6% off the yearly low with this week’s pullback taking XAU/USD back above a pivotal support zone. The monthly opening range is taking shape here around the March lows and the focus is on a potential breakout in the days ahead for guidance with the broader short-bias vulnerable near-term.
Gold Price Chart – XAU/USD 240min
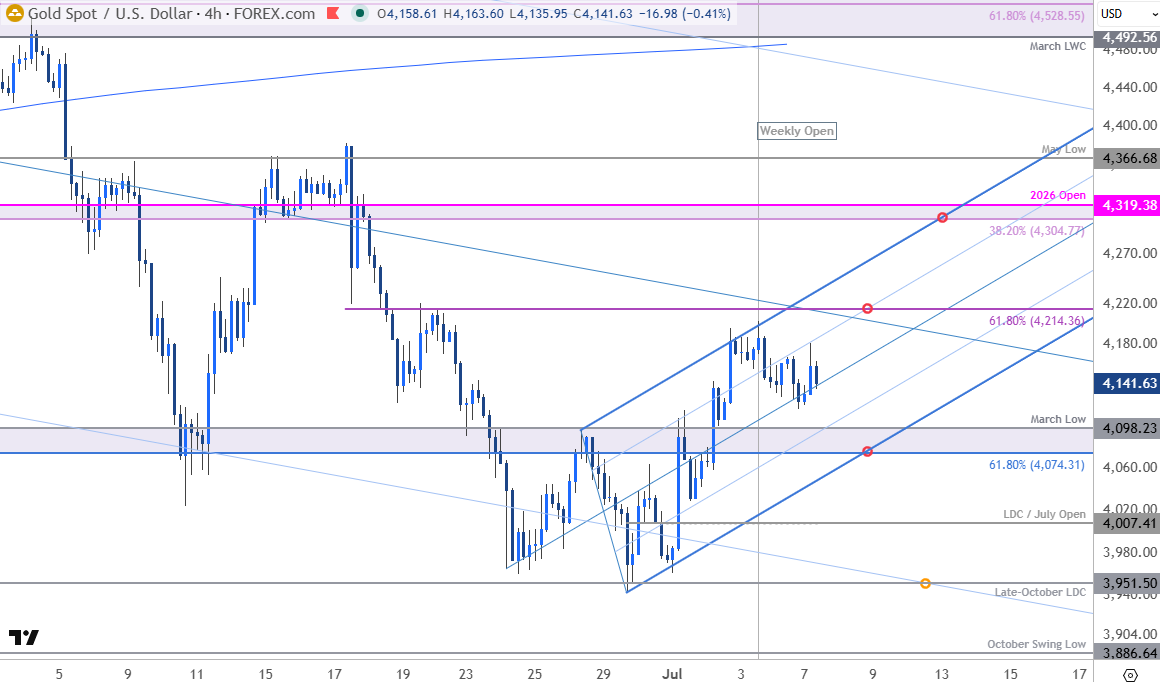
Chart Prepared by Michael Boutros, Sr. Technical Strategist; XAU/USD on TradingView
Notes: A closer look at gold price action shows XAU/USD trading within the confines of a proposed ascending pitchfork extending off the June low. Initial support now rests at 4074/98- a key pivot zone defined by the 61.8% extension of the late-February decline and the March swing low. Note that the lower parallel converges on this zone into the close of the week and losses below this slope would invalidate the near-term uptrend and expose the yearly low-day close / July open at 4007. A break / daily close below this level would mark resumption of the broader downtrend towards the late-October low-day close (LDC) at 3951 and the October swing low at 3887.
Initial resistance is eyed at the 61.8% retracement of the most recent decline at 4214. This level converges on the 75% parallel over the next few days and a breach / close above is needed to fuel the next major leg of the recovery. Key resistance is eyed with the 38.2% retracement of the April decline and the objective yearly open at 4305/19- look for a larger reaction there IF reached. Subsequent resistance is eyed at the May low at 4367 and 4493-4533.
Bottom line: Gold has rebounded back above a key pivot zone with the weekly range taking shape just above. From a trading standpoint, losses would need to be limited to 4074 IF price is heading higher on this stretch with a close above 4214 needed to fuel the next leg of the recovery.
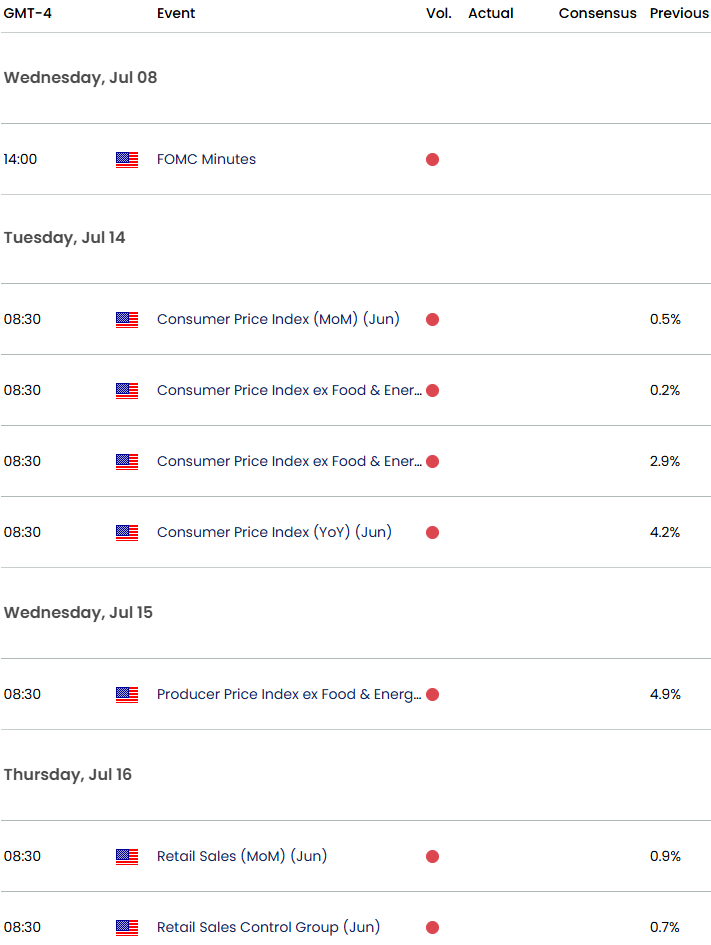
Attention now turns to Wednesday's FOMC minutes, where investors will be looking for greater clarity on policymakers' views regarding inflation, labor market conditions, and the outlook for interest rates. Although Chair Warsh has reiterated the Fed's commitment to restoring price stability, last week's disappointing payrolls report has raised questions about the resilience of the labor market. As a result, markets have modestly pared expectations for further policy tightening, tempering the dollar's recent advance and lending support to gold prices. Fed Fund Futures now imply roughly a 68% probability of a 25-basis-point rate hike in October. Stay nimble into the release and watch the weekly close here for guidance. Review my latest Gold Weekly Technical Forecast for a closer look at the longer-term XAU/USD trade levels.
Key US Economic Data Releases
Economic Calendar - latest economic developments and upcoming event risk.
Active Short-term Technical Charts
- Canadian Dollar Short-term Outlook: USD/CAD Coils Below Resistance—Breakout Looms
- Australian Dollar Outlook: AUD/USD Holds Major Support—Reversal Risk Builds
- Swiss Franc Short-term Outlook: USD/CHF Overbought Rally Tests Major Resistance
- Japanese Yen Short-term Outlook: USD/JPY Breakout Stalls at 2024 High as Intervention Risk Builds
- US Dollar Short-term Outlook: USD Breakout Targets Next Major Resistance
- British Pound Short-term Outlook: GBP/USD Rebound Challenges Bear Trend
- Euro Short-term Outlook: EUR/USD Rebound Faces Fed- Breakout Looms
--- Written by Michael Boutros, Senior Technical Strategist
Follow Michael on X @MBForex







Web Trader platform
Our sophisticated web-based platform is packed with features.
Open an account today
Experience award-winning platforms with fast and secure execution.
Economic calendar
Related articles

Euro Short-term Outlook: EUR/USD Pullback Nears Pivotal Uptrend Support 8 28 2026
Warsh's comments accelerated the EUR/USD selloff, raising the stakes as buyers look to stabilize the broader recovery.

Gold and S&P 500 analysis: What now after Warsh’s hawkish speech?
The dollar surged across the board after the Fed Chair Kevin Warsh surprised with a hawkish-leaning speech at the Jackson Hole summit. All the bearish dollar bets that had been accumulated since last Friday on the back of data weakness and bond market troubles had to be squared and that triggered a short squeeze rally for the dollar. Gold and silver dropped, as a result, as too did bitcoin, while US indices were giving back earlier gains.


AUD/CAD breakout puts the Bradman barrier in sight
A bullish breakout has pushed AUD/CAD to its highest level since early 2021. Whether it can clear 0.9994 may determine if the move extends well above parity.
