


Gold, Silver Price Forecast: Fed Decision, Long-Term & Short-Term Outlook
Gold, Silver Price Forecast: Gold and silver remain above major long-term support ahead of the Fed decision. Explore key technical levels, the DXY outlook, and bullish and bearish scenarios.
Written by
Razan Hilal
Market Analyst
Gold and silver continue to consolidate above major historical support zones as markets await the Federal Reserve's policy decision. While gold is holding above a decade-long trendline dating back to 2016, silver is facing a multi-decade support zone originating from the 1980 highs.
These rare long-term technical setups raise an important question for investors: Is this a buying opportunity, or is it better to wait for greater clarity before re-entering the market?
Fed Expectations Take Center Stage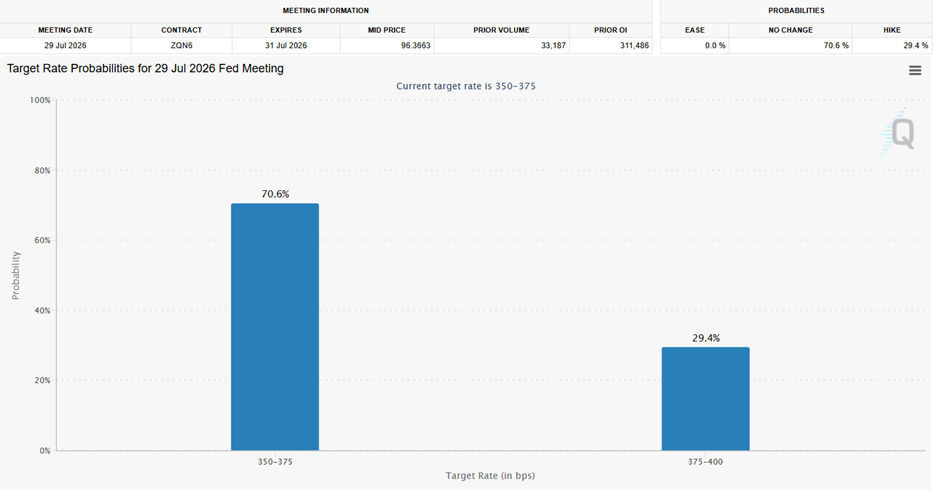
Source: CME
That question becomes even more relevant as markets prepare for today's Federal Reserve decision.
Current market expectations imply:
- Around a 70% probability that the Fed leaves interest rates unchanged.
- Nearly a 30% probability of a 25-basis-point rate hike.
- Expectations that policymakers will maintain a hawkish tone, supported by persistent Middle East tensions and renewed inflation risks.
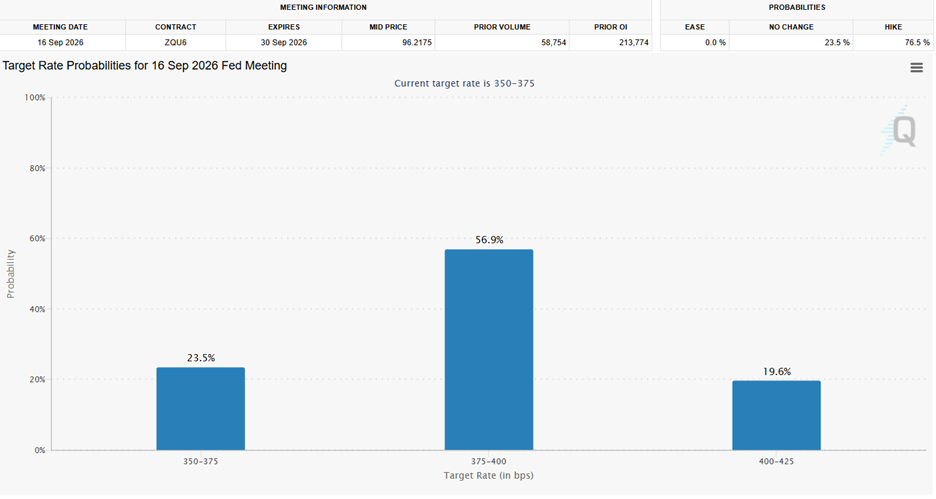
September Expectations Turn More Hawkish
Source: CME
Looking ahead to September, expectations become considerably more hawkish:
- More than a 56% probability of a 25-basis-point rate hike.
- Around a 19% probability of a 50-basis-point hike.
- Around a 23% probability of rates remaining unchanged.
These expectations continue to support the US Dollar Index above the 101 level, strengthening the US dollar while weighing on major currency pairs, including USD/JPY, which continues to trade near levels last seen in the 1980s.
At the same time, gold and silver remain trapped near critical technical confluence zones as investors assess whether Treasury yields will continue rising or whether the Federal Reserve could deliver a less hawkish message.
Regardless of whether the next catalyst comes from geopolitical developments, a stronger US dollar, or a shift in Fed guidance, the key technical levels outlined below provide a framework for assessing both the short-term and long-term outlook.
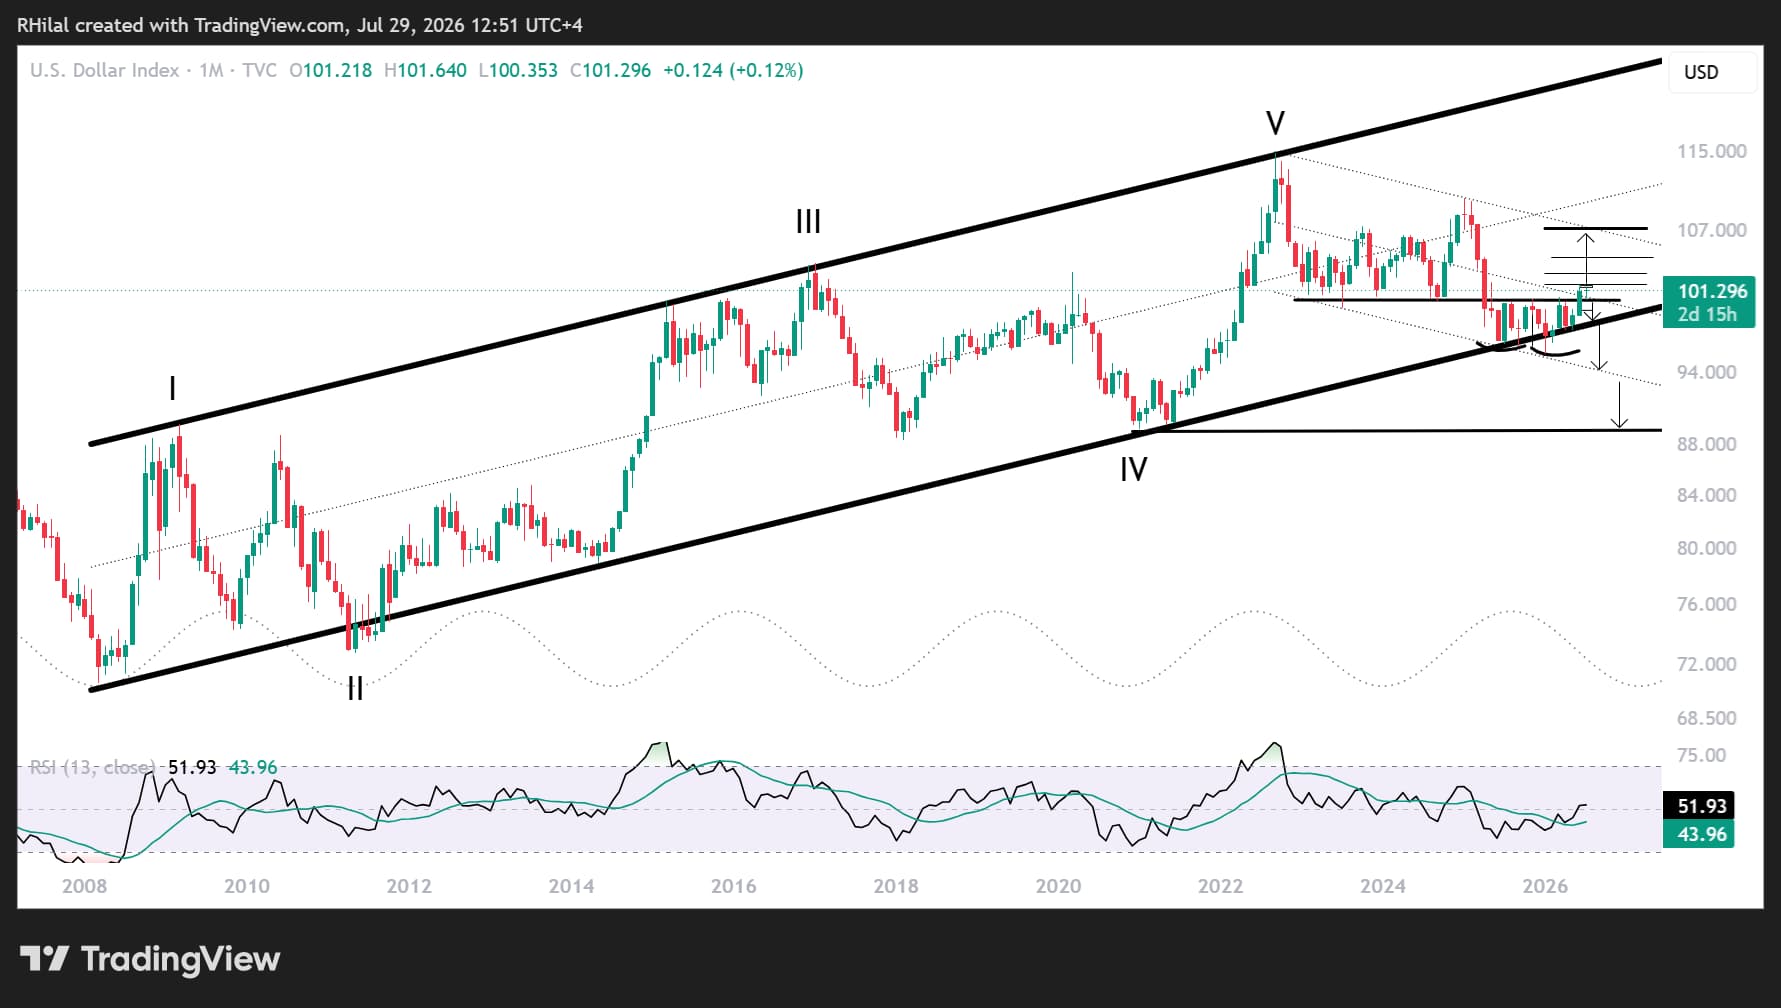
DXY Price Outlook: Monthly Time Frame – Log Scale
Source: Trading view
The monthly chart highlights that the US Dollar Index continues to hold within a major bullish confluence zone, supported by:
- The neckline of a potential double-bottom pattern.
- The midpoint of a descending parallel channel extending from 2022.
- A multi-year support and resistance zone that has repeatedly defined price action since 2023.
- Monthly RSI holding comfortably above the neutral 50 level
A monthly close above 102.00 would strengthen the bullish outlook, exposing resistance at 102.80, 104.50, and ultimately 107.00, which coincides with the upper boundary of the descending channel in place since 2022.
Such a move would likely coincide with renewed geopolitical tensions, stronger inflation pressures, or a more hawkish Federal Reserve. It would also increase downside pressure across major currencies and precious metals, potentially pushing both toward fresh 2026 lows before a longer-term recovery develops.
On the downside, a break below the uptrend support zone between 100.30 and 99.30 would weaken the year’s bullish structure, improving the outlook for currencies and precious metals.
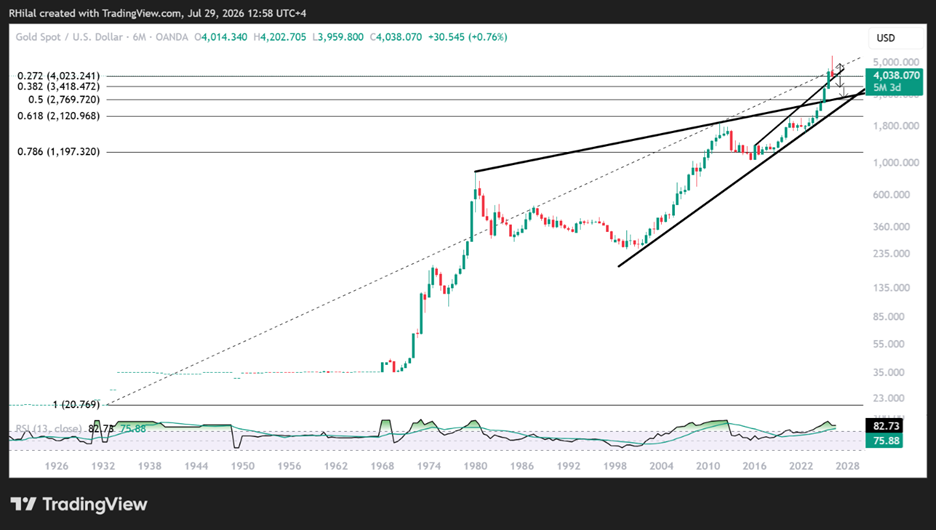
Gold Price Outlook: 6 -Month Time Frame – Log Scale
Source: Trading view
From a six-month perspective, gold is testing one of the most significant technical confluence zones in decades.
- Price continues to hold near the 27.2% Fibonacci retracement of the secular advance from 1920 to 2026. A sustained break below 3,930 would expose the 38.2% retracement between 3,500 and 3,460, an area that acted as major resistance throughout much of 2025.
- Gold is also holding above the long-term trendline connecting the major highs recorded between 2016 and 2025. What previously acted as resistance has now become one of the market's most important long-term support levels.
Whether gold rebounds from this area or extends its correction will largely depend on:
- Crude oil price direction
- Developments surrounding the US-Iran conflict and the Strait of Hormuz
- The Federal Reserve's policy outlook
Gold Price Outlook: Daily Time Frame – Log Scale
Source: Trading view
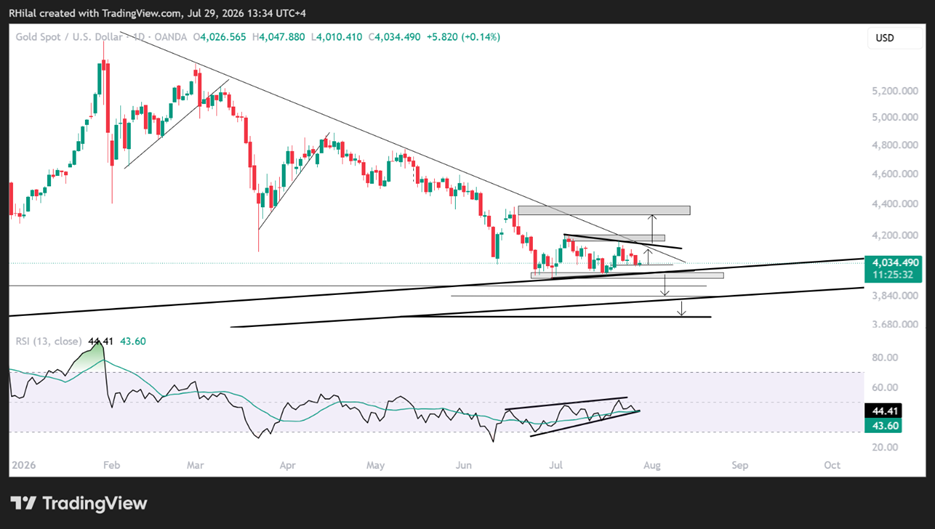
Despite the strength of this higher-time-frame support zone, gold remains trapped inside a contracting consolidation between 3,930 and 4,200.
The broader short-term outlook therefore remains neutral, with key levels inside the consolidation at:
- 4,140 on the upside.
- 3,960–3,930 on the downside.
Meanwhile, the daily RSI continues to form a bullish divergence, suggesting downside momentum is gradually fading. However, confirmation requires a breakout above both the descending trendline connecting the lower highs since March 2026 and resistance between 4,140 and 4,200.
Gold Bullish Scenario
A sustained recovery above 4,140 and 4,200 would shift the short-term outlook back in favor of buyers. That would expose the next resistance levels at: 4,340 - 4,400
- A breakout above 4,400 would strengthen the case for a broader recovery across precious metals while increasing confidence that the longer-term uptrend has resumed.
Gold Bearish Scenario
On the downside, a break below the 3,960–3,930 support zone would reactivate the bearish scenario.
The next downside objectives are:
- 3,880–3,840, corresponding to the October 2025 lows.
- 3,700
- 3,500 - 3,460, respected 5 month resistance zone in 2025
These longer-term support zones could provide another significant reversal opportunity.
As long as the US Dollar Index and crude oil remain firm, downside risks across currencies and precious metals are likely to remain elevated.
Silver Price Outlook: 3-Month Time Frame – Log Scale
Source: Trading view
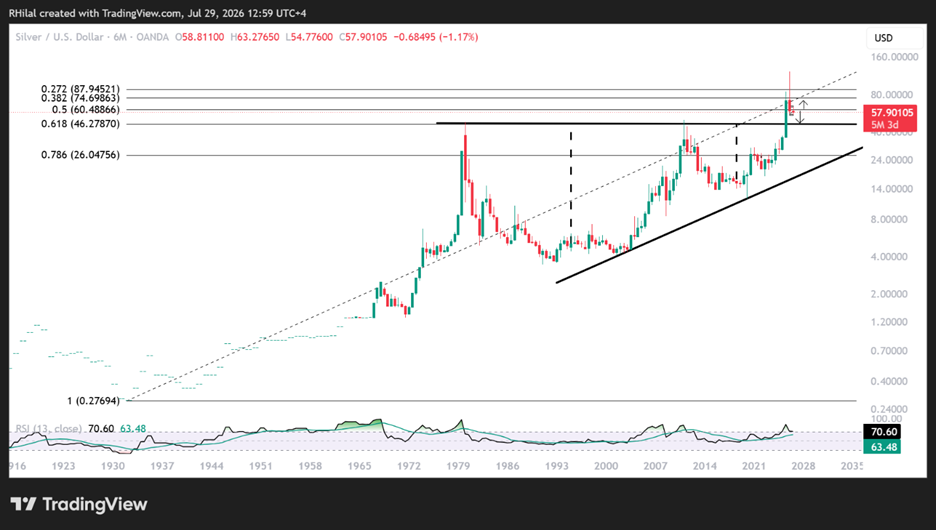
The six-month chart highlights several important long-term technical developments.
- A shooting star reversal candle.
- A breakdown below the 50% Fibonacci retracement of the secular advance from 1930 to 2026.
- Price approaching the multi-decade trendline connecting the highs recorded between 1980 and 2024, which may now transition from long-term resistance into major support.
This area also aligns with the 61.8% Fibonacci retracement of the entire advance between $46 and $50.
The shorter-term outlook is further clarified on the daily chart below.
Silver Price Outlook: Daily Time Frame – Log Scale
Source: Trading view
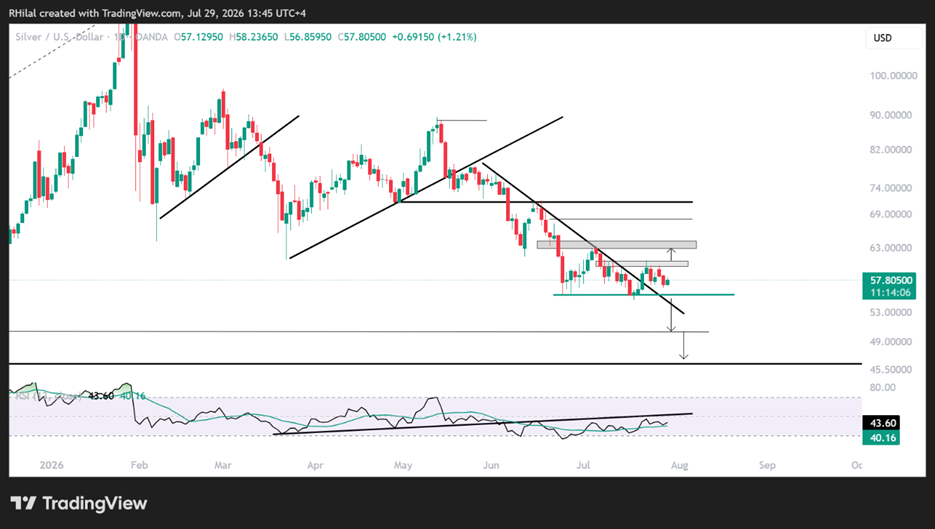
From a daily perspective, silver is attempting to stabilize above the descending trendline connecting the lower highs formed since May 2026.
At the same time, momentum indicators remain below the neckline of the previous head-and-shoulders pattern, keeping the short-term bearish bias intact despite bullish divergence.
- A break below $55.50 would expose the longer-term support zone between $50 and $46.
- Conversely, a breakout above $61 exposes $63.80 - $68 - $72.
Long term outlook: a confirmed breakout above 72 would significantly strengthen confidence that a broader bullish reversal is underway, reopening the path toward triple-digit silver prices over the longer term.
Key Takeaway
The US Dollar Index (DXY) will remain one of the primary benchmarks for both the foreign exchange and precious metals markets as geopolitical risks and Federal Reserve expectations continue to evolve.
- The 101.80–102.00 resistance zone remains the key to watch for upside risks
- The 100.30 - 99.30 support zone remains key to watch for downside risks
Written by Razan Hilal, CMT
Follow on X: @Rh_waves







Web Trader platform
Our sophisticated web-based platform is packed with features.
Open an account today
Experience award-winning platforms with fast and secure execution.
Economic calendar
Related articles

Canadian Dollar Forecast: USD/CAD Weekly Reversal Puts Yearly Uptrend Back in Focus 8 29 2026
USD/CAD has staged its strongest weekly advance since June, shifting the focus to whether a more durable low is finally taking shape.


USD/JPY weekly outlook: Payrolls may challenge the Fed’s hawkish reset
USD/JPY has finally woken from its slumber. Payrolls now loom as the key test of whether the latest hawkish repricing sticks or sinks.


Euro Short-term Outlook: EUR/USD Pullback Nears Pivotal Uptrend Support 8 28 2026
Warsh's comments accelerated the EUR/USD selloff, raising the stakes as buyers look to stabilize the broader recovery.