

Gold, Silver Stall as Dollar Refuses to Buckle
Precious metals are rangebound, the dollar is hanging tough and traditional macro signals have turned messy. The FOMC minutes may help determine which side breaks first.
Written by
David Scutt
Market Analyst
- Gold and silver consolidate after strong breakouts
- Historic drivers are sending conflicting signals
- DXY keeps holds firm despite stiffening macro headwinds
- FOMC minutes could spark range breakout
The bullish breakouts in gold and silver seen earlier this month have given way to a period of consolidation, suggesting traders are now waiting for the next catalyst to see whether the move extends or reverses.
With historic drivers nowhere to be seen right now, you can’t help but think the release of the minutes from the July FOMC meeting later Wednesday may provide the catalyst to spark the market out of its temporary funk.
Macro Signals Turn Muddled
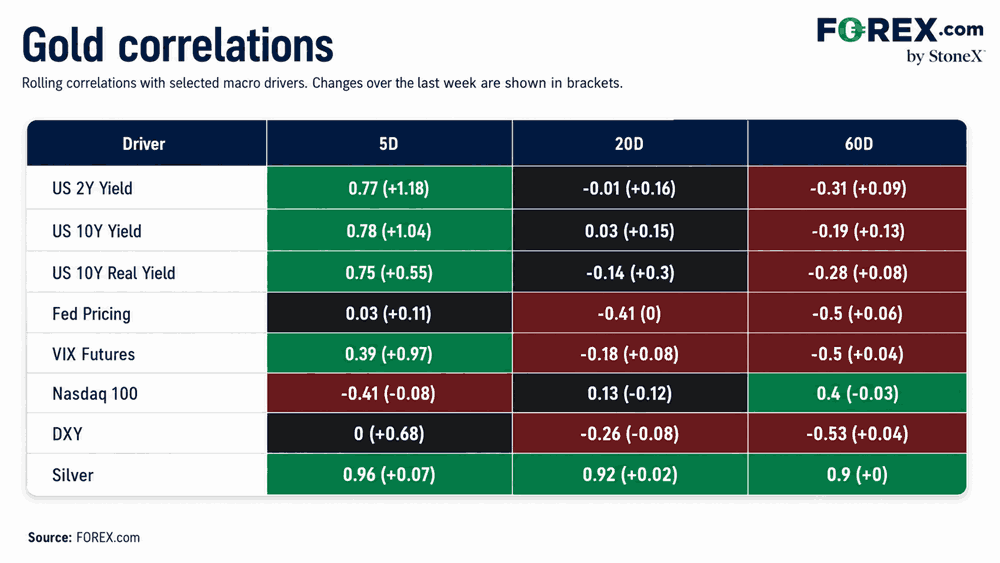
The recent consolidation in precious metals may be explained in part by the breakdown in their usual relationships with historic macro drivers.
Source: TradingView, FOREX.com
While a strong positive relationship between gold and silver remains firmly intact, with five-day correlations sitting at 0.96 respectively, beyond that, the message is one of total confusion.
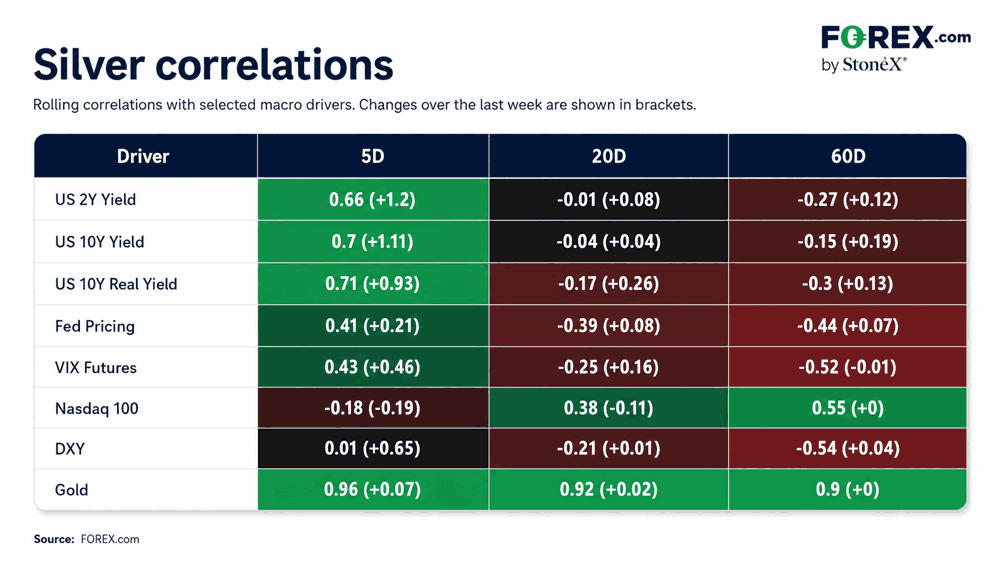
Over the past five days, gold has shown correlations of 0.77 with US two-year yields, 0.78 with 10-year yields and 0.75 with 10-year real yields. Silver tells much the same story at 0.66, 0.70 and 0.71 respectively. That is the exact opposite of what would normally be expected fundamentally.
Source: TradingView, FOREX.com
At the same time, there has been virtually no relationship with the US dollar, with five-day correlations sitting at 0.00 for gold and 0.01 for silver. Fed pricing has also offered little direction, while relationships with the Nasdaq 100 and VIX futures have been weak and contradictory.
Outside the tight relationship between gold and silver, the usual macro signals offer very little guidance on where precious metals want to go next.
Dollar Refuses to Buckle
Source: TradingView
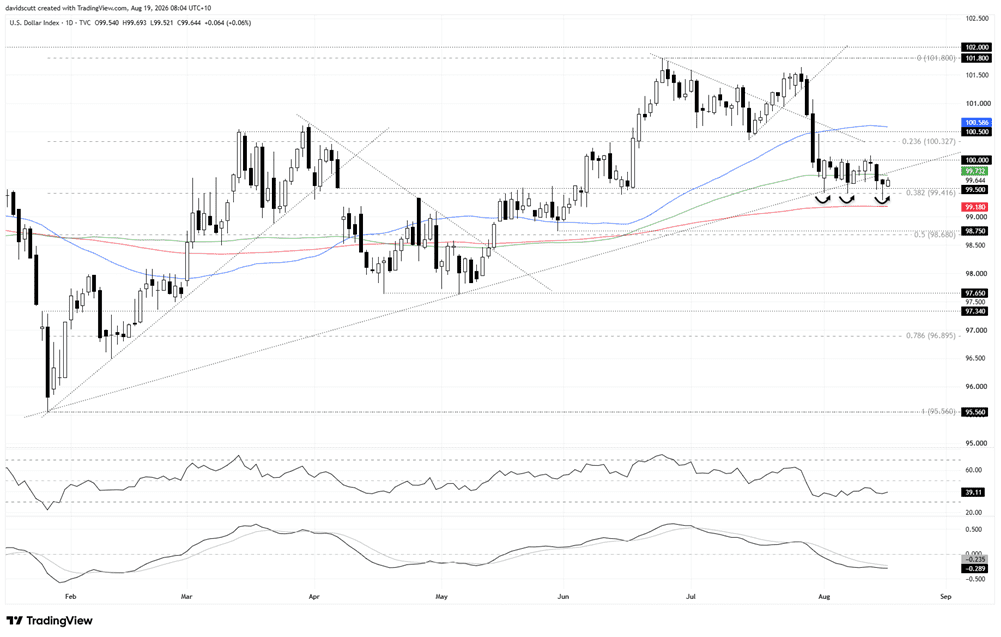
The lack of a relationship with the US dollar makes sense when looking at the DXY chart.
Despite being buffeted by negative headwinds this month, the dollar has continued to hang tough. While DXY has broken the uptrend in place from the January lows, it has been rangy over the past few weeks, attracting bids below 99.50 down to the 38.2% Fibonacci retracement of the January to June bull move, while offers have capped gains above 100.
That is notable given the role the dollar played in the precious-metals breakout earlier this month. As I discussed in the video below, the decline in DXY was an important contributor to the move in gold and silver, even if it could not fully explain its magnitude.
With the 50, 100 and 200-day moving averages flattening out, the dollar’s rangy price action may have stalled what was otherwise looking like a very promising breakout in precious metals.
This content was created by an affiliate of FOREX.com and represents the views and opinions of the author/speakers, not the views and opinions of FOREX.com, StoneX Group Inc., or its subsidiaries. The content has not been independently reviewed by FOREX.com.
Gold Breakout Gives Way to Consolidation
Source: TradingView
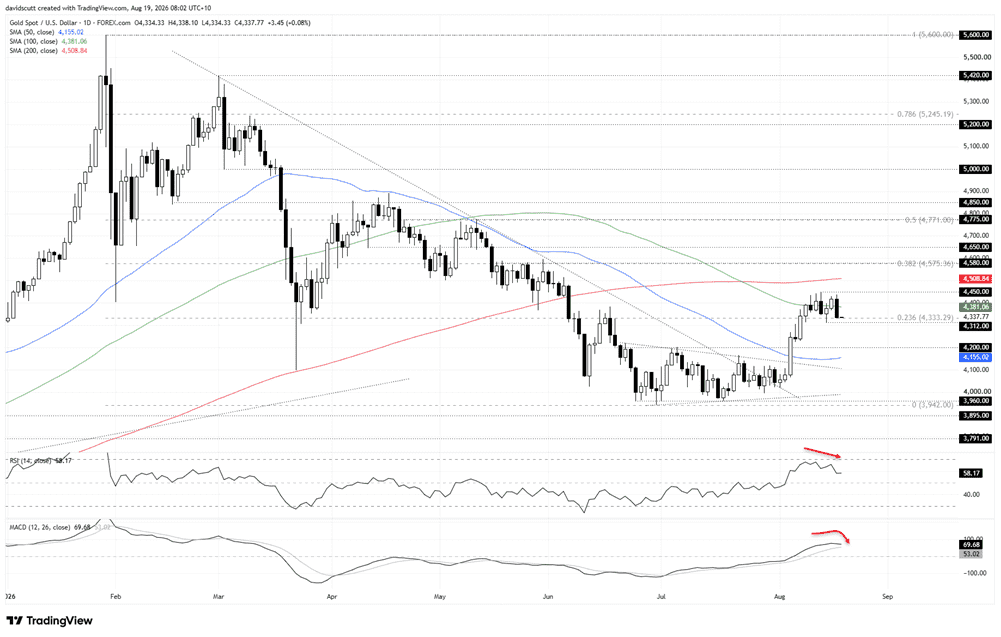
Having surged to as high as $4,450 an ounce following the breakout of the bearish trend from the January highs and wedge structure it had been coiling in since early June, gold has since consolidated .
The price has attracted bids from beneath the 23.6% Fibonacci retracement of the January to June bear move at $4,333, with this week’s low set at $4,312. With gains capped towards $4,450 overhead, that is the range traders should be focusing on right now.
On the topside, the 200-day moving average looms large for bulls. If broken cleanly, the 38.2% Fibonacci retracement of the January to June bear move lines up neatly with $4,580, a level that has also acted as both support and resistance this year. Those two levels screen as particularly important when it comes to gold’s longer-term trajectory.
Underneath, a break below $4,312 may open the door for a run back towards $4,200, the top of the breakout zone from earlier this month, with the 50-day moving average located just underneath.
The message from the oscillators is one of diminishing upside strength. RSI (14) is setting lower highs and lower lows and is now moving back towards the neutral 50 level. MACD, while holding in positive territory, is converging on the signal line.
The overall message is therefore a more cautious one for bulls rather than a green light for bears. While I like gold’s medium and longer-term prospects, nearer term I’m not beholden to one particular bias, putting greater emphasis on price action to drive my decision-making.
Silver Tests the Lower End of Range
Source: TradingView
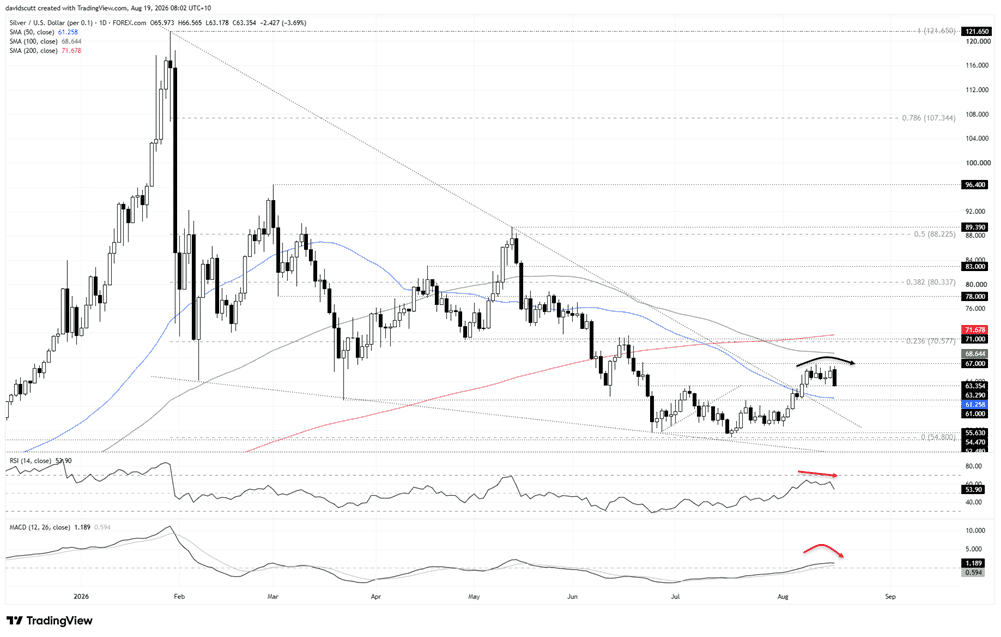
Like gold, the technical picture for silver is almost identical following the breakout of the bearish trend from the record high set in January this year.
Since then, we’ve seen a period of consolidation, with the price capped beneath resistance at $67 on the topside and support at $63.29 on the downside. However, Tuesday’s price action was a little more definitive than for gold, with a bearish engulfing candle printing, taking it back towards the lower end of the current range.
With RSI (14) setting lower highs and almost back at the neutral 50 level, and MACD rolling over and converging on the signal line while remaining in positive territory, silver feels heavy. That view is backed up by the string of noticeable upside wicks on the daily candles going back more than a week. As such, while the message from the oscillators is more neutral than bearish, in the near term playing silver from the short side comes across as more palatable.
That puts immediate emphasis on the 50-day simple moving average and $61, which now form the key support zone beneath the current range. A clean break beneath that zone would bring a potential retest of support between $55.63 and the mid-July low of $54.80 into focus.
Should support at $63.29 hold, the focus overhead would be $67, with the 100-day simple moving average and the resistance zone comprising the 23.6% Fibonacci retracement of the January to July bear move and 200-day moving average forming a far more important barrier overhead for bulls.
A break above the latter would point to a resumption of the prior breakout and put $78 resistance in focus.
Latest market news










Web Trader platform
Our sophisticated web-based platform is packed with features.
Open an account today
Experience award-winning platforms with fast and secure execution.
Economic calendar
Related articles

Gold and S&P 500 analysis: What now after Warsh’s hawkish speech?
The dollar surged across the board after the Fed Chair Kevin Warsh surprised with a hawkish-leaning speech at the Jackson Hole summit. All the bearish dollar bets that had been accumulated since last Friday on the back of data weakness and bond market troubles had to be squared and that triggered a short squeeze rally for the dollar. Gold and silver dropped, as a result, as too did bitcoin, while US indices were giving back earlier gains.


Bitcoin Forecast: BTC/USD Back to $80K Ahead of Warsh’s Jackson Hole Speech
After surging over $15,000 in the past 10 days alone, there is risk of a near-term pullback if Warsh says anything remotely hawkish at Jackson Hole - what are the levels to watch from here?


Gold Falters at Resistance, Grappling With PCE, Month-End Flows and Jackson Hole
Gold has pulled back from resistance after sticky PCE data, with month-end flows and Jackson Hole now shaping the near-term outlook.
