


Gold Slips as Crude Oil Surges on Middle East Tensions
Gold weakens despite geopolitical risks as crude oil volatility surges on Middle East tensions. Traders watch $5,000 support on gold and $100 for Brent.
Written by
Matt Simpson
Market Analyst
Gold’s safe-haven appeal faltered on Thursday as the precious metal slipped alongside equities, even as geopolitical risks in the Middle East intensified. Meanwhile, crude oil volatility surged, with Brent and WTI jumping sharply on fears that the conflict could disrupt global energy supply routes.
View related analysis:
Gold Weakens While Crude Oil Surges on Middle East Escalation
Middle East tensions remained elevated on Thursday as Israel expanded strikes into Lebanon while Hezbollah and Iran-backed forces continued launching rockets and drones toward Israel. The escalation kept traders focused on the risk of broader regional disruption, particularly to energy supply routes through the Strait of Hormuz.

Middle East Conflict Escalates as Israel Expands Lebanon Strikes
- Israel expanded strikes into Lebanon, including areas around Beirut, after Hezbollah launched a wave of rockets and drones toward Israel.
- Iran’s new Supreme Leader, Mojtaba Khamenei, signalled the country would continue its response and warned of potential disruption to the Strait of Hormuz, a critical global oil shipping route.
- Energy infrastructure near Oman’s Salalah port was reportedly targeted by drone strikes, raising concerns about shipping and logistics in the region.
- Russia called for the US and Israel to halt military operations and pursue negotiations, citing rising humanitarian risks.
- Regional travel disruption continued, with flight cancellations and diversions reported across parts of the Gulf as the conflict widens.
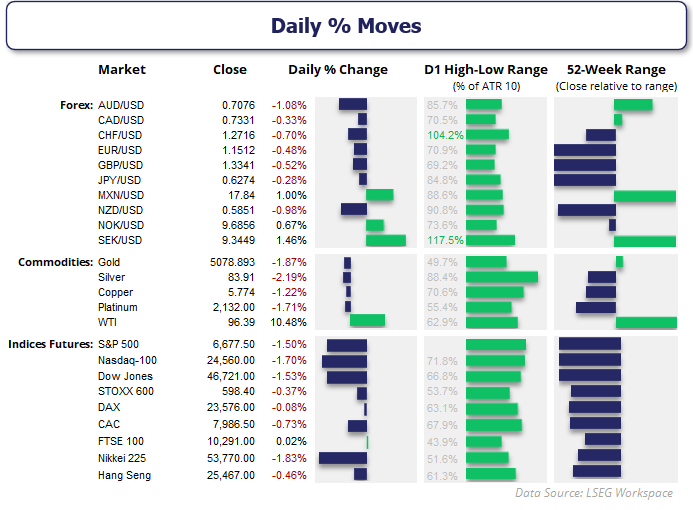
Risk-Off Flows Lift US Dollar as Equities Slide
- Wall Street indices closed lower for a third day, with bearish momentum accelerating and technology stocks leading the decline
- Nasdaq 100 futures are currently down -1.7%, erasing most of Monday’s gains. Dow Jones Industrial futures are down -1.5% and on track for a third consecutive weekly loss, while the S&P 500 is flat for the week and trading just above 6700
- The volatility index (VIX) is up 3 points to 12.6
- All 11 ASX 200 sectors were in the red on Thursday, led by technology (XIJ), real estate (XRE) and materials (XMJ), sending the ASX index lower in line with Tuesday’s bearish bias
- The US dollar retained its crown as the currency of choice for safe-haven flows, rising against all major FX peers while AUD/USD and NZD/USD were the weakest during the risk-off session
- USD/JPY is on the cusp of a breakout above the January high, which could bring 160 into focus for bulls if cleared
- While the Japanese yen weakened against the US dollar, its safe-haven status kicked in against other currencies, rising against all other FX majors
- AUD/JPY snapped a 4-day winning streak and erased most of Wednesday’s gains after bulls met resistance at 114
- Crude oil was the obvious beneficiary of Middle East headlines, with WTI up 10.3% and Brent up 9.2%
- Precious metals were lower, with gold, silver and copper falling in tandem

Brent Crude Oil Futures Technical Analysis
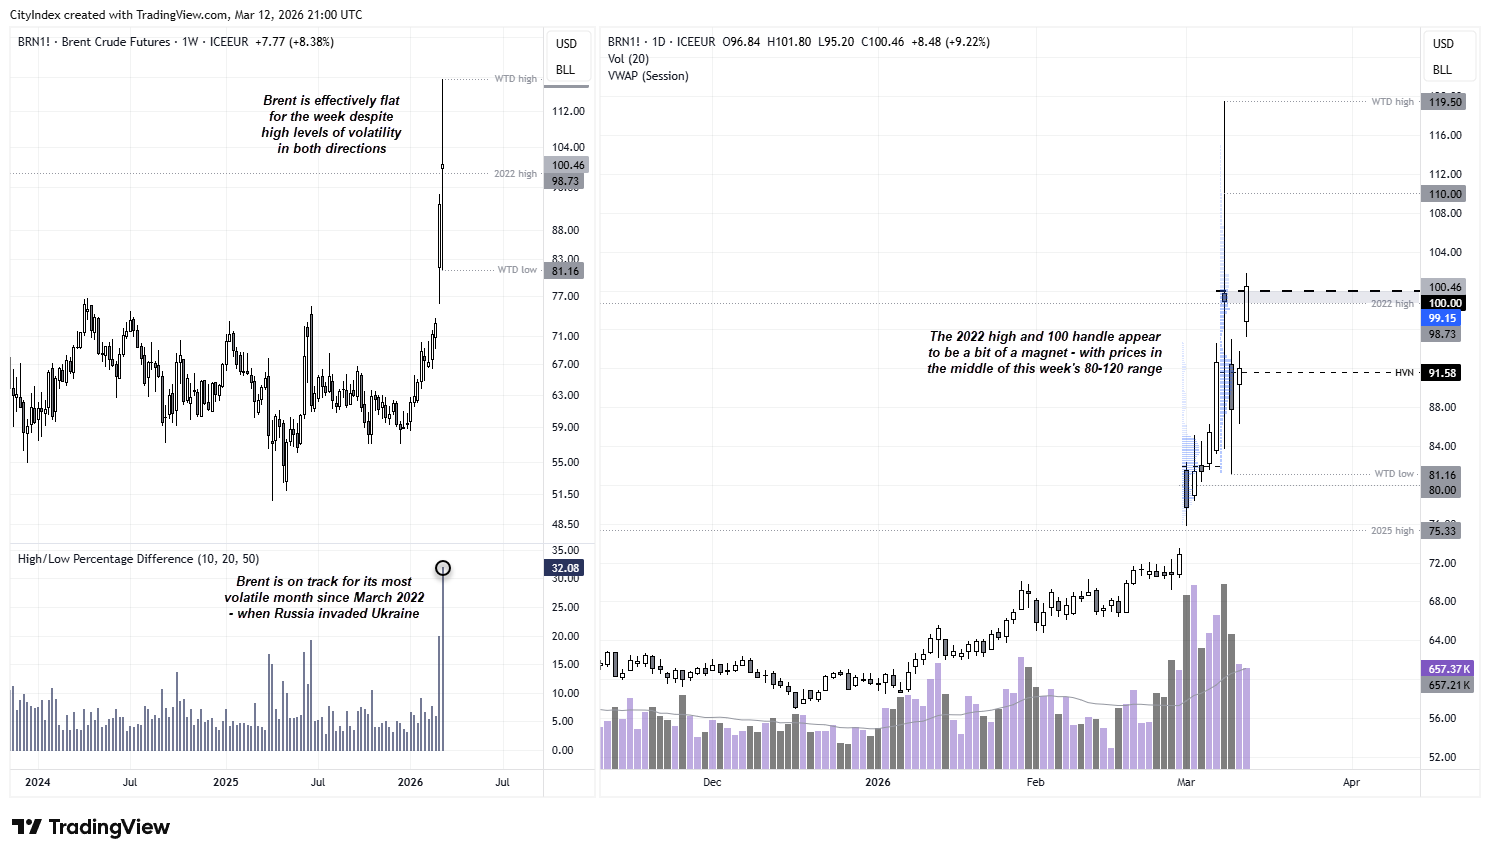
With a high-to-low range of 32%, this is currently the most volatile month for crude oil since March 2022, when Russia invaded Ukraine. Moscow also expected a quick resolution to that conflict, yet four years later it continues.
Brent is also flat for the month despite the extreme two-way volatility. Prices are sitting near the midpoint of the $80–$120 range, with the market repeatedly gravitating toward the $100 level. While there is no obvious technical setup on this chart, it remains a useful gauge of broader market sentiment around Middle East headlines.
Oil prices tend to fall on relatively good geopolitical news and surge when tensions escalate. The faster crude rises, the stronger the risk-off signal tends to be, often prompting traders to rotate into cash and occasionally even weigh on gold.
Source: ICE, TradingView
Gold Futures (GC) Technical Analysis
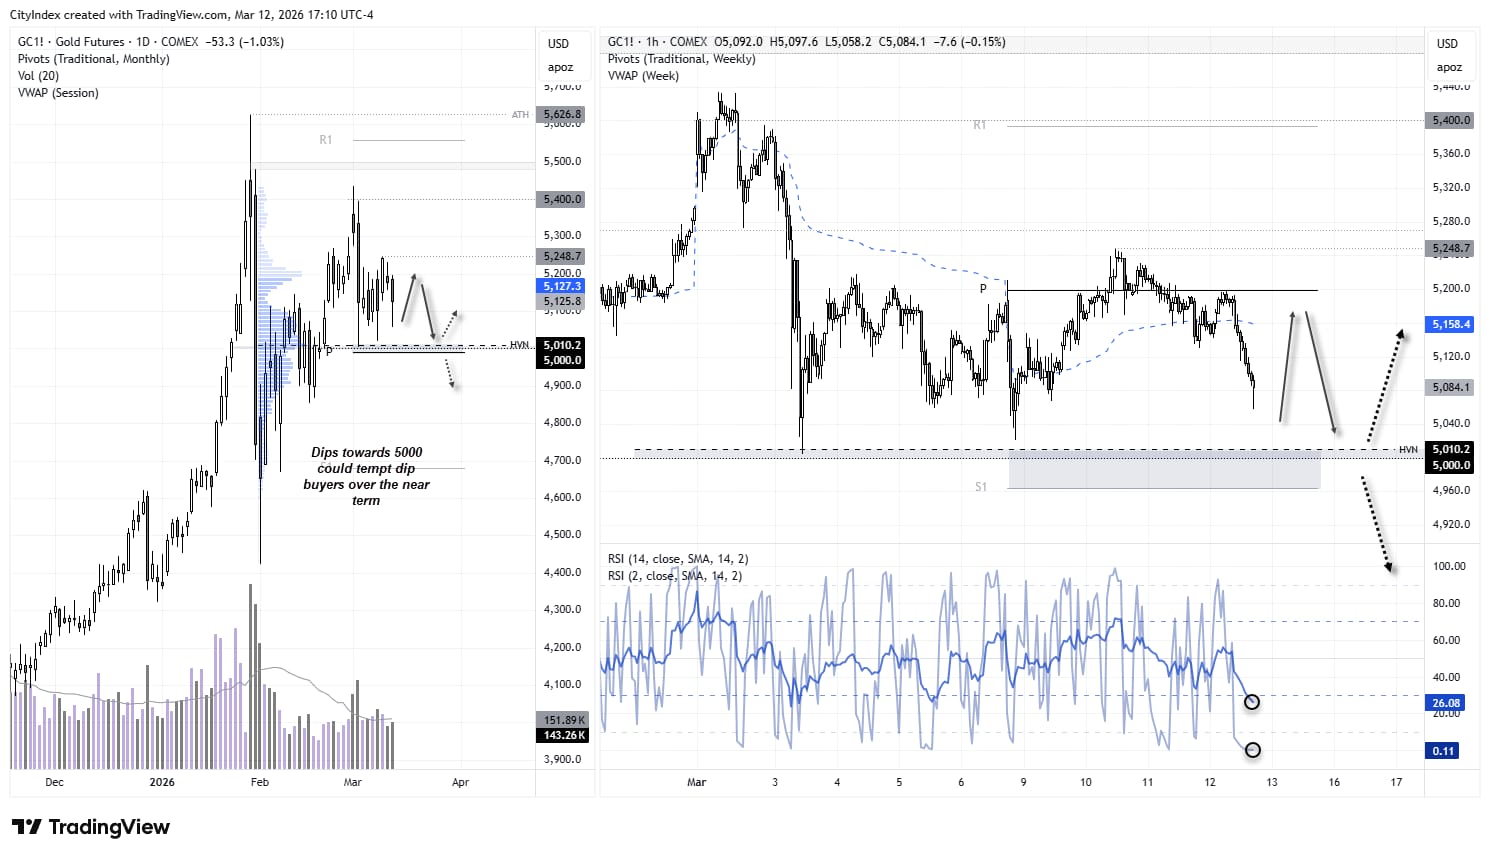
You know things are bad when gold loses its safe-haven appeal, which happened again on Thursday with the precious metal falling in tandem with Wall Street. Tuesday’s high marked a lower high relative to the previous Monday, when markets first began pricing in risks from the Middle East. Note that daily trading volume on Thursday was also higher, suggesting bearish initiation.
The question now is whether things are bad enough to warrant a break of 5,000. I suspect it will hold as support, at least initially.
The 1-hour chart shows a strong sell-off from the weekly pivot point and a retest of 5200 on Thursday. While there is no immediate threat of a fresh low, a lower wick formed on the final hour of trade as part of a shooting star candle. With both RSIs oversold and 5,000 support sitting near a high-volume node (HVN), dip buyers might be tempted to take a punt if prices move closer to this big round number.
I’m not calling for a strong rally, but gold bulls may attempt another push toward 5200.
However, with 5,000 acting as a clear line in the sand for bulls, a break beneath it could unleash a much deeper pullback.
Source: COMEX, TradingView
Related tags:







Web Trader platform
Our sophisticated web-based platform is packed with features.
Open an account today
Experience award-winning platforms with fast and secure execution.
Economic calendar
Related articles

Gold and S&P 500 analysis: What now after Warsh’s hawkish speech?
The dollar surged across the board after the Fed Chair Kevin Warsh surprised with a hawkish-leaning speech at the Jackson Hole summit. All the bearish dollar bets that had been accumulated since last Friday on the back of data weakness and bond market troubles had to be squared and that triggered a short squeeze rally for the dollar. Gold and silver dropped, as a result, as too did bitcoin, while US indices were giving back earlier gains.


Nasdaq 100 Forecast: NDX slips ahead of Fed Chair Warsh’s speech
U.S. stocks are edging lower on Friday, giving back some of yesterday's gains after Nvidia's strong outlook revived the tech trade. The focus has now shifted firmly to Fed Chair Kevin Warsh's Jackson Hole speech, with investors looking for more clarity on the outlook for interest rates.


AUD/CAD breakout puts the Bradman barrier in sight
A bullish breakout has pushed AUD/CAD to its highest level since early 2021. Whether it can clear 0.9994 may determine if the move extends well above parity.