


Gold Update XAUUSD struggles for direction near 4k
Although gold has gained close to 1.5% over the last 2 trading sessions, this move does not yet appear to confirm a dominant buying bias. For now, the metal continues to show a more neutral behavior, with demand strength still failing to recover fully after the release of PPI inflation data in the United States.
Written by
Julian Pineda
Market Analyst
Although gold has gained close to 1.5% over the last 2 trading sessions, this move does not yet appear to confirm a dominant buying bias. For now, the metal continues to show a more neutral behavior, with demand strength still failing to recover fully after the release of PPI inflation data in the United States.
This is partly because, although inflation pressures have started to show signs of moderation, the bond market continues to show strength and remains a relevant substitute market for gold. This dynamic could keep a phase of indecision important in short-term XAU/USD movements.

PPI data is released
During the session, Core PPI data in the United States was released. This corresponds to the producer price index and works as an additional metric to measure potential inflation pressures.
The data came in below expectations, with a reading of 0.2% versus an expected monthly figure of 0.3%. For now, the dynamic shows that producer prices have continued to register low readings since May, moving away from the elevated levels seen in April, when the figure reached 0.7%.
Together with the CPI data released in the previous session, this figure shows that inflation pressures in the United States have started to ease to some extent.
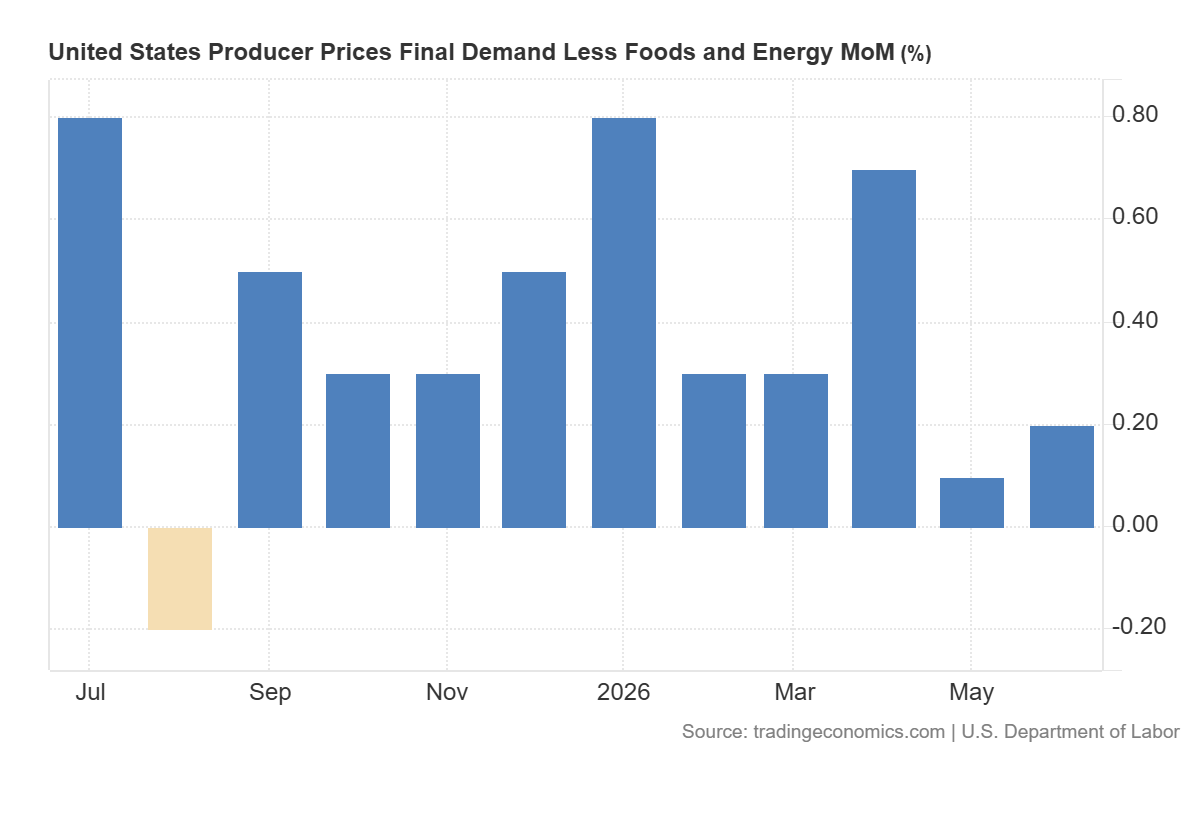
Source: TradingEconomics
After the impact of the inflation data released over the last 2 sessions, an interesting shift has started to appear in expectations around a potentially more aggressive Federal Reserve.
Now, the probability table shows a 49.1% chance that interest rates will remain unchanged at the September 16 decision. At the same time, there is a lower probability, at 45.5%, of a 0.25% increase in U.S. interest rates, which would take them to a new reference area of 4.00%.
This suggests that expectations of a more aggressive stance from the central bank may not materialize as soon as previously expected, partly due to the recently released inflation data.
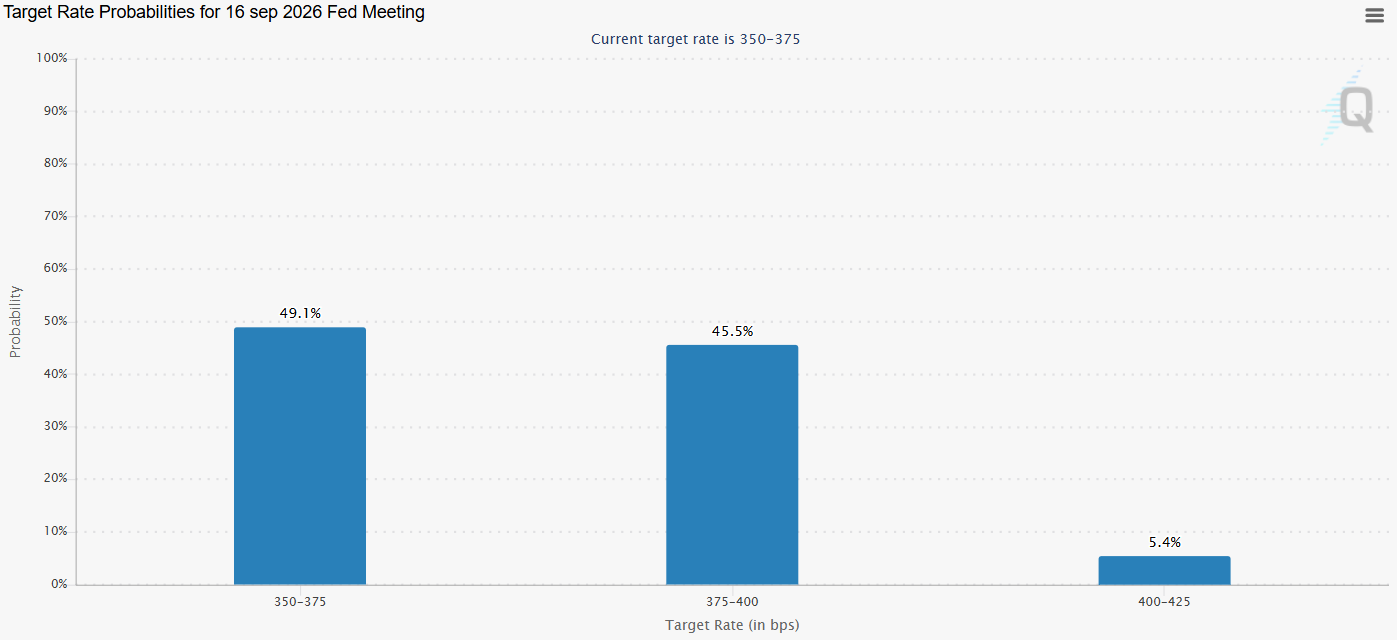
Source: CMEGROUP
However, the most relevant factor for gold movements remains the dynamic of the 10-year U.S. bond market, considered one of the metal’s most important substitute markets.
Although a less aggressive central bank is now expected compared to what was projected weeks ago, bond yields have not shown major changes after the inflation data. While a recent decline has been observed, it has been small compared to the growth seen in previous weeks and yields still remain above the 4.5% area.
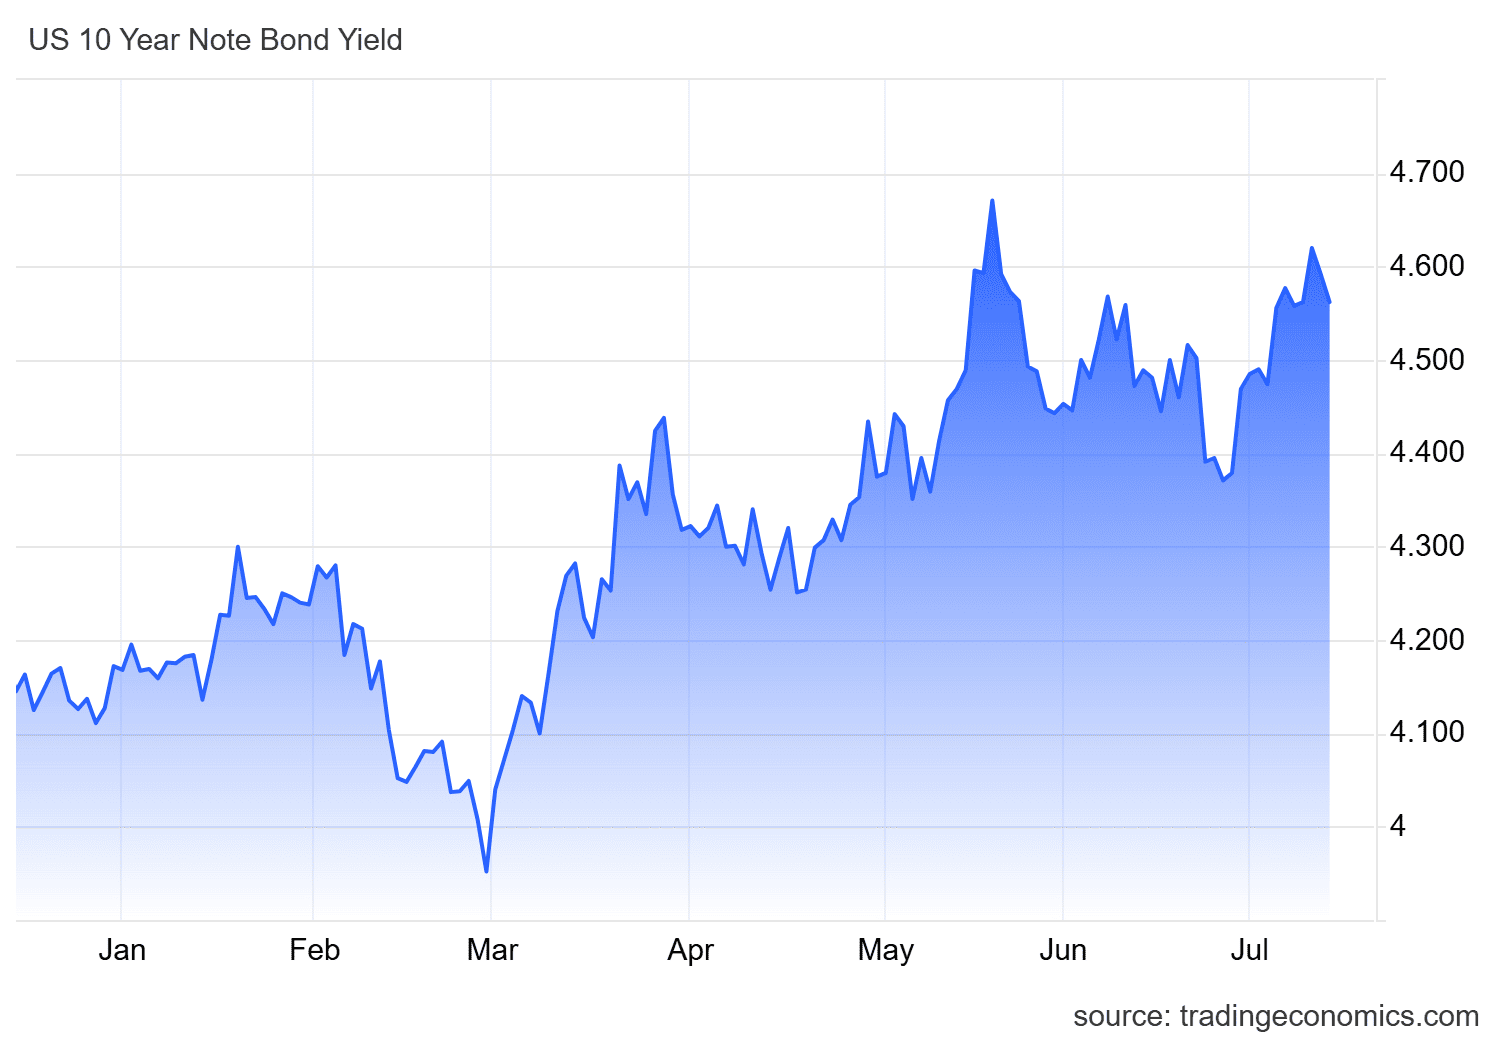
Source: TradingEconomics
This dynamic is not entirely favorable for gold because, unlike bonds, the metal does not pay interest. For this reason, it may be perceived as a less attractive market while bond yields remain stable and elevated in the short term.
In this context, strong yields could be reducing gold’s appeal and favoring a shift of capital flows toward substitute markets such as bonds.
In fact, demand dynamics in the most relevant gold ETF, SPDR Gold Shares, show a lack of positive net flows over the last month of trading. For the most recent date, July 10, capital outflows of more than 350 million dollars were recorded.
This shows that capital outflows have reflected weaker appetite for gold, while the bond market has shown an important increase in yields over the last month. Overall, this dynamic highlights gold’s loss of appeal compared to substitute markets.
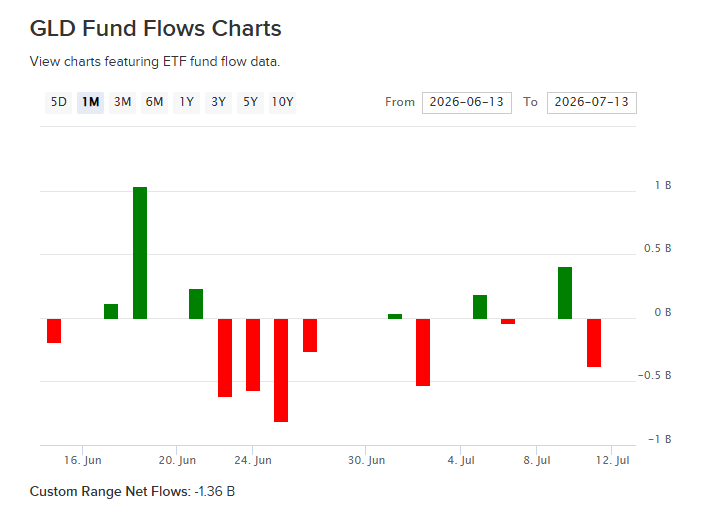
Source: ETFDB
With all the above in mind, one of the factors limiting a stronger recovery in gold demand may be the strength of its substitute markets. If this effect continues, it could keep preventing more consistent buying pressure from reaching the metal.
For this reason, a relevant phase of indecision could remain part of gold’s movements over the next few trading sessions.
Technical outlook for gold
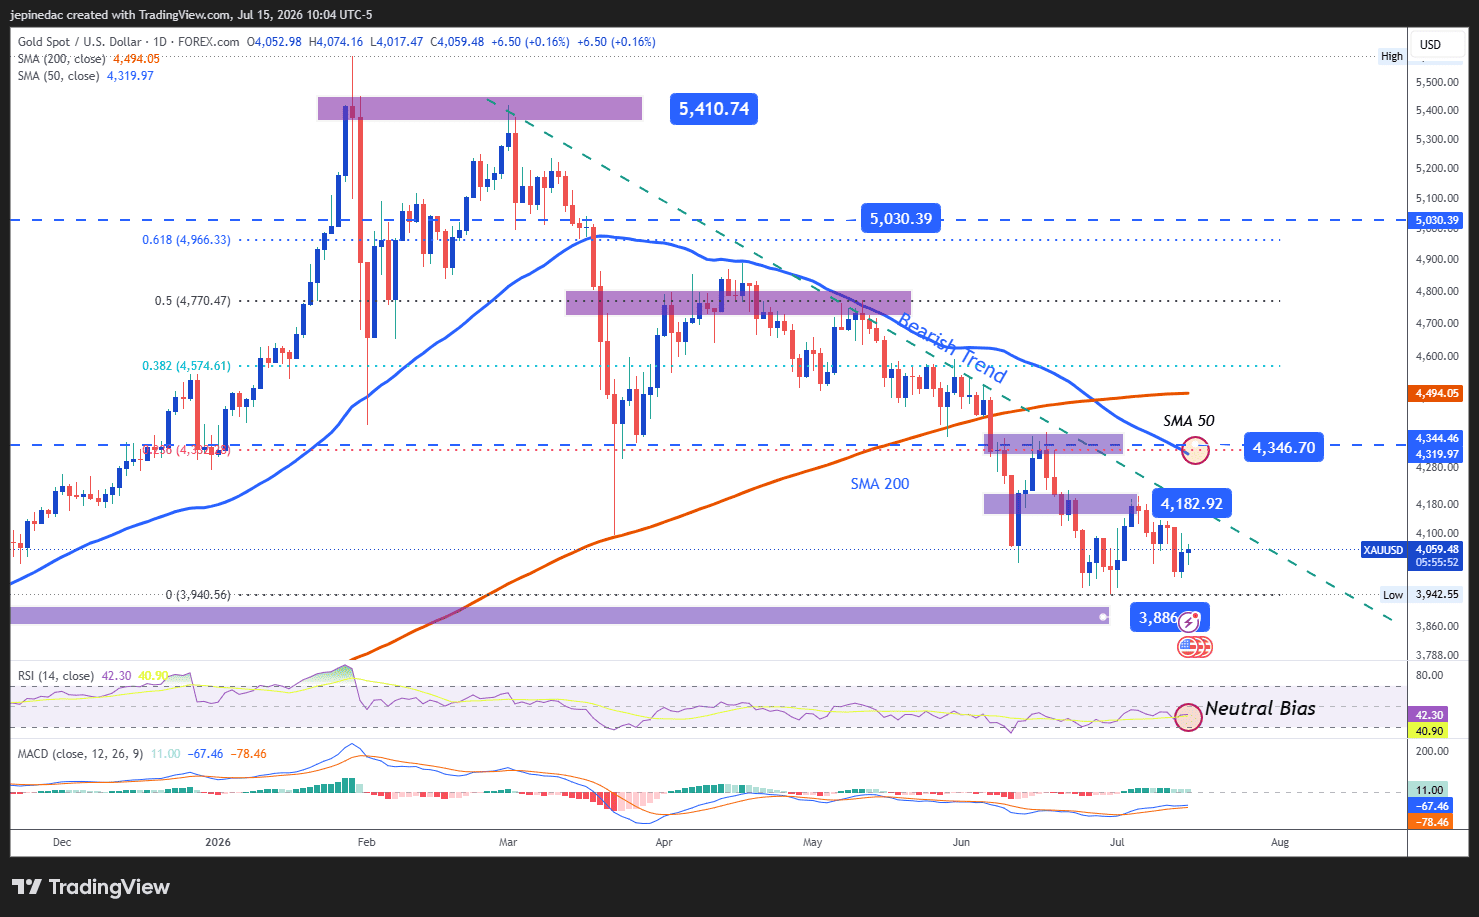
Source: StoneX, Tradingview
- The bearish trend line remains relevant: Despite gold’s recovery attempts in previous sessions, bullish movements still appear insufficient compared to the selling structure that has dominated the daily chart since the first days of March 2026. So far, this trend line remains the most important technical structure to watch. However, if price stops forming new relevant lows, a phase of neutrality could start to put the bearish formation at risk and open room for a possible sideways range over the next few sessions.
- RSI: Now, the RSI line has started to move near the neutral 50 level. This suggests a balance in the average of bullish and bearish impulses over the last 14 sessions. This dynamic reflects a possible indecision bias that has started to become relevant in the chart’s movements and could continue if the indicator maintains this behavior.
- MACD: A similar reading can be seen in the MACD, as the histogram remains near the neutral 0 area. This suggests that the average strength of short-term moving averages is in neutral territory, reinforcing the possibility of a phase of indecision in gold.
Key levels to watch:
- 4,345 USD – Crucial resistance: This level corresponds to relevant highs from recent weeks and aligns with the barrier marked by the 50-period simple moving average and the 23.6% Fibonacci retracement of the most relevant move on the chart. Price movements toward this level could put the large bearish trend line formation at risk and open room for a more dominant buying bias over the coming weeks.
- 4,182 USD – Near-term barrier: This recent neutral zone coincides with important retracements from recent weeks. If price remains too close to this level, a phase of indecision could be reinforced and even open room for a short-term sideways range.
- 3,886 USD – Critical support: This level is associated with relevant lows from October 2025 and is considered the next most important bearish barrier. Moves toward this area could once again highlight a clearer selling bias and extend the bearish trend line as the dominant technical structure over the coming weeks.
Written by Julian Pineda, CFA, CMT – Market Analyst
Follow him on: @julianpineda25
Related tags:







Web Trader platform
Our sophisticated web-based platform is packed with features.
Open an account today
Experience award-winning platforms with fast and secure execution.
Economic calendar
Related articles

Gold and S&P 500 analysis: What now after Warsh’s hawkish speech?
The dollar surged across the board after the Fed Chair Kevin Warsh surprised with a hawkish-leaning speech at the Jackson Hole summit. All the bearish dollar bets that had been accumulated since last Friday on the back of data weakness and bond market troubles had to be squared and that triggered a short squeeze rally for the dollar. Gold and silver dropped, as a result, as too did bitcoin, while US indices were giving back earlier gains.


Gold Pullback Risk Builds as AUD/USD and USD/CAD Set Up
Gold has stalled near major resistance after a powerful rally, while AUD/USD looks stretched and USD/CAD attempts to extend its rebound.


Gold Falters at Resistance, Grappling With PCE, Month-End Flows and Jackson Hole
Gold has pulled back from resistance after sticky PCE data, with month-end flows and Jackson Hole now shaping the near-term outlook.