


Japanese Yen Short-term Outlook: USD/JPY Breakout Hits 10-Week Highs—160 in Focus
USD/JPY bulls need a decisive close above trend resistance to sustain the advance, with hotter U.S. inflation adding urgency to the test.
Written by
Michael Boutros
Sr. Technical Strategist
Japanese Yen Technical Forecast: USD/JPY Short-term Trade Levels
- USD/JPY has rallied nearly 2.5% from the October low after finding support at the 2026 yearly open.
- The break above the November opening range and 200-day moving average has strengthened the near-term bullish outlook.
- The advance is testing confluent resistance, with a decisive daily close above this threshold needed to fuel the next leg higher.
- Former range resistance now defines initial support, with a break below the October uptrend needed to threaten a deeper reversal.
- Stronger-than-expected U.S. CPI has reinforced Fed tightening expectations, with Friday's PPI and Fed commentary keeping event risk elevated into the weekly close.
- Resistance 159.75/87, 160.37, 160.74 (key) - Support 158.70/95 (key), 157.70/90, 156.67/68
The Japanese Yen has come under renewed pressure as USD/JPY builds on last month's recovery from critical technical support. The latest advance has marked a meaningful improvement in the near-term structure, with buyers reclaiming several important technical thresholds after weeks of consolidation. The broader bullish outlook now hinges on the ability to overcome a major resistance confluence, where the next reaction could determine whether the recovery develops into a more sustained advance. With the immediate uptrend intact, the focus remains on whether buyers can maintain control above former resistance and extend the rally toward the next major upside objectives. Battle lines drawn on the USD/JPY short-term technical charts.
Japanese Yen Price Chart – USD/JPY Daily
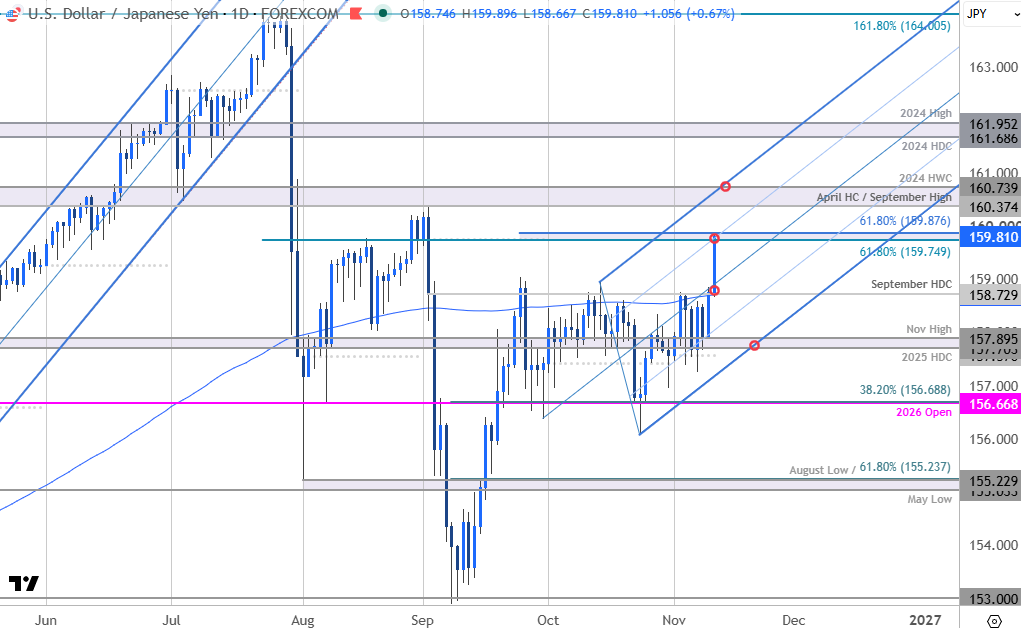
Chart Prepared by Michael Boutros, Sr. Technical Strategist; USD/JPY on TradingView
Technical Outlook: In last month’s Japanese Yen Short-term Technical Outlook we noted that USD/JPY was rangebound just below resistance and that, “From a trading standpoint, the immediate focus is on a breakout of the 157.70-158.73 range for guidance with the bulls vulnerable while below the 200-day moving average.” The range broke lower the following week, fueling a decline of more than 1.8% off the October high before exhausting into key support at the objective yearly open and the 38.2% retracement of the September rally at 156.67/68. The bears were unable to secure a daily close below this threshold with the subsequent rally extending nearly 2.5% off the October low.
Price is trading within the confines of a proposed ascending pitchfork formation with a breach above the median line extending into confluent resistance today at the 61.8% retracement of the July decline and the 61.8% extension of the September rally at 159.75/88. Note that the 75% parallel converges on this threshold over the next few days and the immediate focus is on a reaction off this key pivot zone.
Japanese Yen Price Chart – USD/JPY 240min
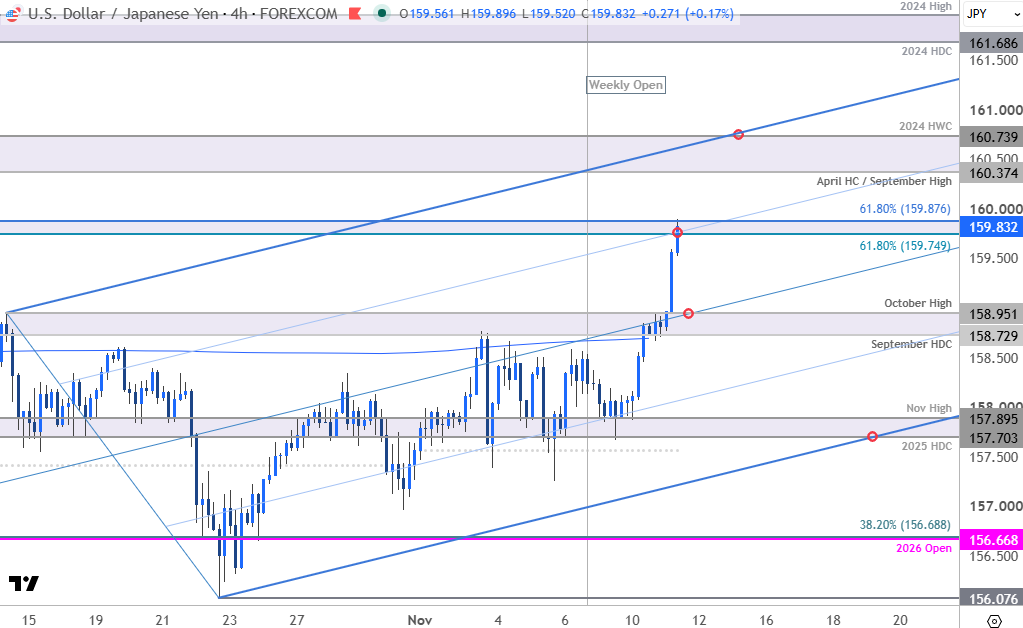
Chart Prepared by Michael Boutros, Sr. Technical Strategist; USD/JPY on TradingView
Notes: A closer look at Japanese Yen price action shows today’s breakout extending into resistance at a fresh 10-week high. Initial support now rests at 158.70/95- a region defined by the 200-day moving average, the September high-day close (HDC), and the October swing high. A break / daily close below this threshold would be needed to nullify today’s breakout with near-term bullish invalidation now raised to the 2025 HDC / November high at 157.70/90. The lower parallel converges on this zone next week land losses surpassing this slope would threaten another test of the yearly open at 156.67.
A topside breach / daily close above this key pivot zone exposes subsequent resistance objectives at the April high close and the September high at 160.37/39 and the 2024 high-week close (HWC) at 160.74. Both levels represent areas of interest for possible topside exhaustion / price inflection- look for larger reactions there IF reached.
Bottom line: USD/JPY has broken out of the November opening range with the rally now extending into confluent Fibonacci resistance. From a trading standpoint, losses would need to be limited to 158.70 IF price is heading higher on this stretch with a close above 159.88 needed to fuel the next leg of the advance.
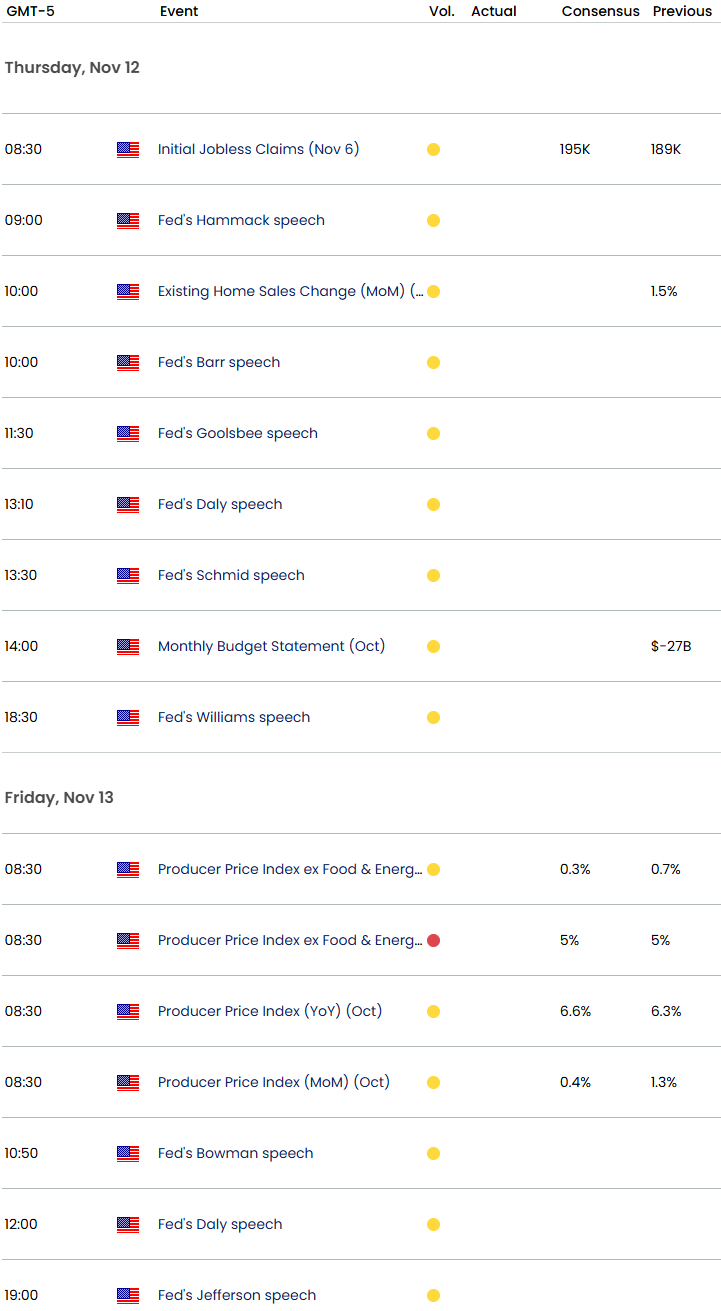
USD/JPY event risk into the close of the week remains concentrated on the U.S. side after stronger-than-expected CPI reinforced expectations for a December Fed hike. Rate expectations have also moved higher into 2027, with markets now pricing roughly a 90% probability of a second hike by March, keeping the dollar supported against the yen. Thursday’s jobless claims and a busy slate of Fed speakers will shape the outlook for further tightening, followed by Friday’s PPI report and additional Fed commentary. Any hawkish shift from the BoJ or renewed official concern over yen weakness could nevertheless temper the upside in USD/JPY. Stay nimble into the releases and watch the weekly close for guidance. Review my latest Japanese Yen Weekly Forecast for a closer look at the longer-term USD/JPY technical trade levels.
Key Economic Data Releases
--- Written by Michael Boutros, Senior Technical Strategist
Follow Michael on X @MBForex
Latest market news









Web Trader platform
Our sophisticated web-based platform is packed with features.
Open an account today
Experience award-winning platforms with fast and secure execution.
Economic calendar
Related articles

USD/JPY Weekly Outlook: AI earnings could overshadow the Fed and BoJ
AI sentiment has become a major driver of US Treasury yields and USD/JPY. With Microsoft, Alphabet and Amazon reporting this week, central bank decisions may have competition for traders' attention.


Gold and S&P 500 analysis: What now after Warsh’s hawkish speech?
The dollar surged across the board after the Fed Chair Kevin Warsh surprised with a hawkish-leaning speech at the Jackson Hole summit. All the bearish dollar bets that had been accumulated since last Friday on the back of data weakness and bond market troubles had to be squared and that triggered a short squeeze rally for the dollar. Gold and silver dropped, as a result, as too did bitcoin, while US indices were giving back earlier gains.


EUR/USD forecast: All eyes on Warsh at Jackson Hole - Forex Friday
For much of this week, the EUR/USD has been edging lower with the US dollar regaining some ground after last week’s sell-off that was triggered, in part, by the bond market worries. Investors have been unwilling to bet further against the US dollar so far this week ahead of Kevin Warsh’s keynote speech at the Jackson Hole summit, due later today.