


Nasdaq 100 Outlook: Tech Bulls Rattled as Wall Street Selloff Deepens
The Nasdaq 100 is on track for its worst week since March, with RSI divergence and gap closures hinting that a long-overdue correction may be underway.
Written by
Matt Simpson
Market Analyst
Wall Street futures continued lower during Wednesday’s Asian session, with the Nasdaq once again leading the way. Nasdaq futures had already fallen close to -1% by lunchtime — more than an average day’s range during the US session.
This triggered a second wave of selling across Asian equity markets, with the Nikkei 225 leading the losses, down 2.6%. The Hang Seng was off just under 1%. Commodity currencies also came under pressure during the risk-off session, with NZD/USD down 1.1% and AUD/USD 0.7%.

Chart prepared by Matt Simpson: Data Source - LSEG
View related analysis:
As always, people want answers as to why. The main culprits appear to be the Goldman Sachs and Morgan Stanley CEOs, who essentially suggested that a pullback is needed, and growing concerns that the AI bubble may be popping. But when you consider the Nasdaq rallied for seven consecutive months and gained over 50% from its April low, the current sell-off is a mere nudge in the grand scheme of things — and one that’s long overdue.
At some point, profits need to be booked, especially after repeated runs to record highs. But when momentum turns like it has across global markets, stops get triggered and force traders to liquidate positions in other markets to nurse losses — in turn prompting fresh bearish activity. Those with money on the line aren’t seeking answers right now — they’re simply copying each other like kids in an exam. And the answer is to run.

Nasdaq 100 Extends Decline as Tech Sector Selloff Deepens
The monthly chart shows that October marked the Nasdaq’s seventh consecutive bullish month — its longest such sequence since May 2017. It has also surged 56% from its April low, which makes the current sell-off relatively tame in comparison.
Still, at current levels the Nasdaq is on track for its worst week since last March, down 2.6%. Its high-to-low range of 3.9% is the most volatile in four weeks — which, incidentally, marked a swing low.
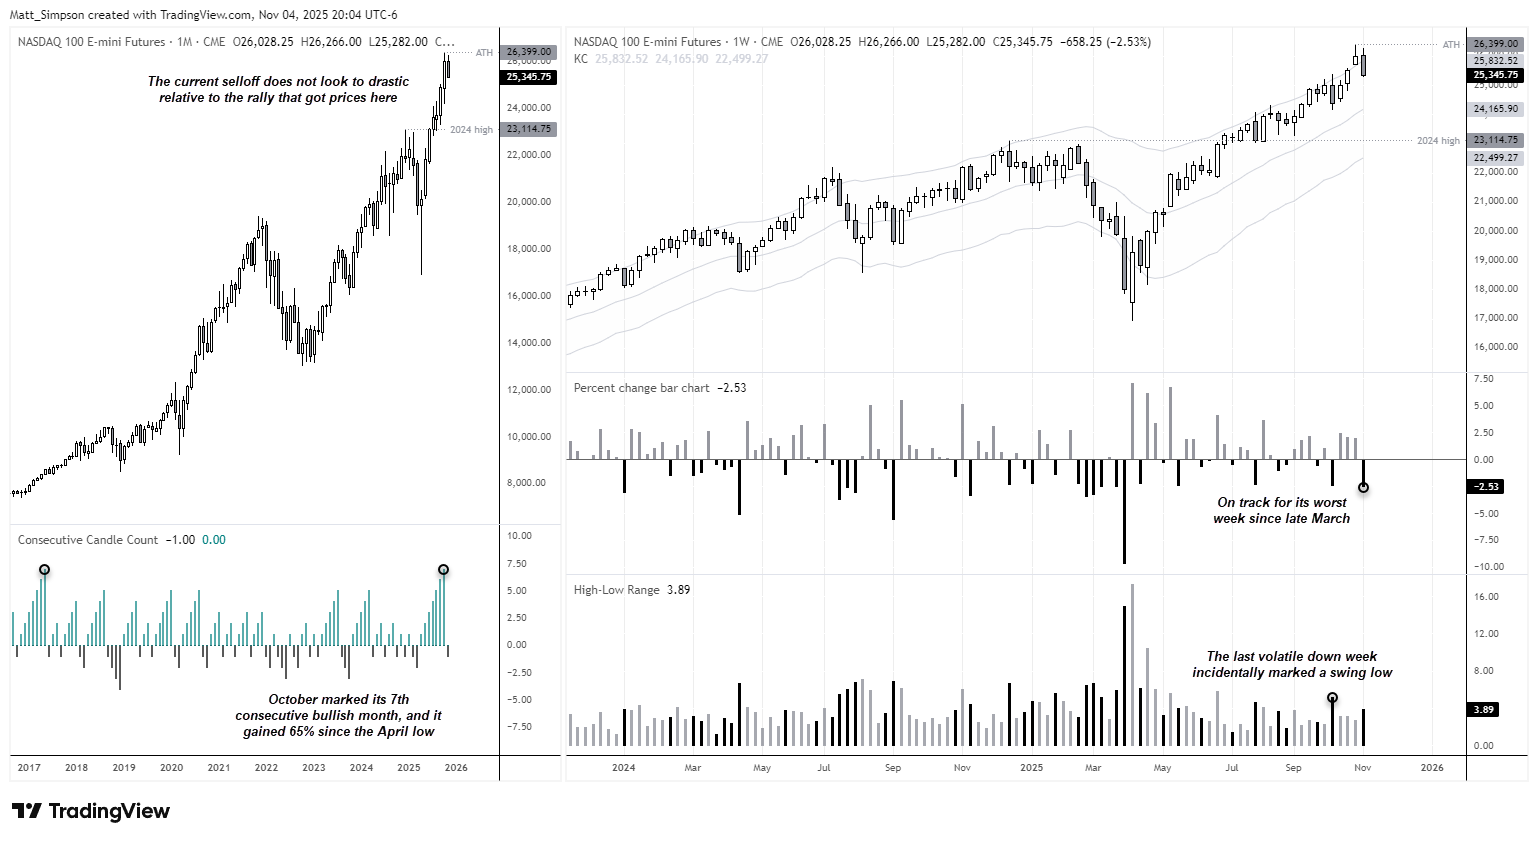 Chart analysis by Matt Simpson, Source: TradingView, CME Futures, NASDAQ 100 E-mini Futures

Nasdaq 100 Futures (NQ): Daily Chart
The daily chart shows a bearish divergence on the RSI (14), and the recent top was accompanied by a bearish outside day. Tuesday’s candle formed a bearish-opening Marubozu — an elongated bearish engulfing candle that sold off immediately from the open.
Prices have since moved lower to close the first gap of this trend. That’s an important development, as the prior two gaps (breakaway and runaway) are typically associated with breakouts from significant lows and mid-trend bullish acceleration. With the first gap now closed, could this signal a major top? Time will tell, but the characteristics of the trend have clearly shifted.
25,000 remains the next major level to be tested, though this rally has repeatedly reversed higher after one or two heavy selling days. If Nasdaq futures break Trump’s latest tariff low (24,158), that would confirm a regime change. Until then, dip buyers are likely waiting for the right opportunity to re-enter — though it seems unlikely the Nasdaq will surge to fresh highs anytime soon.
I expect volatility to cut both ways, and traders may wish to stay nimble, adapt quickly, or step aside altogether.

Chart analysis by Matt Simpson, Source: TradingView, CME Futures, NASDAQ 100 E-mini Futures
View the full economic calendar
-- Written by Matt Simpson
Follow Matt on Twitter @cLeverEdge
How to trade with City Index
You can trade with City Index by following these four easy steps:
- Open an account, or log in if you’re already a customer
• Open an account in the UK
• Open an account in Australia
• Open an account in Singapore
- Search for the market you want to trade in our award-winning platform
- Choose your position and size, and your stop and limit levels
- Place the trade
Related tags:







Web Trader platform
Our sophisticated web-based platform is packed with features.
Open an account today
Experience award-winning platforms with fast and secure execution.
Economic calendar
Related articles

Gold and S&P 500 analysis: What now after Warsh’s hawkish speech?
The dollar surged across the board after the Fed Chair Kevin Warsh surprised with a hawkish-leaning speech at the Jackson Hole summit. All the bearish dollar bets that had been accumulated since last Friday on the back of data weakness and bond market troubles had to be squared and that triggered a short squeeze rally for the dollar. Gold and silver dropped, as a result, as too did bitcoin, while US indices were giving back earlier gains.


Nasdaq 100 Forecast: NDX slips ahead of Fed Chair Warsh’s speech
U.S. stocks are edging lower on Friday, giving back some of yesterday's gains after Nvidia's strong outlook revived the tech trade. The focus has now shifted firmly to Fed Chair Kevin Warsh's Jackson Hole speech, with investors looking for more clarity on the outlook for interest rates.

Jackson Hole Returns: Nikkei 225 and Nasdaq 100 Volatility in Focus
Historical Jackson Hole returns point to elevated Nikkei 225 volatility around Fed speech day, with Nasdaq 100 direction hinging on Kevin Warsh.