


Nasdaq 100, S&P 500, Dow Jones Outlook: Has The Dead Cat Bounced?
Wall Street’s record highs quickly reversed as Trump’s revived trade war triggered the worst sell-off in six months — are we seeing a dead cat bounce?
Written by
Matt Simpson
Market Analyst
The revival of Trump’s trade war shook sentiment on Friday, resulting in the worst day for Wall Street indices in six months. The S&P 500, Nasdaq 100, and Dow Jones all fell sharply just a day after reaching fresh record highs.
In typical shell-shocked fashion, Wall Street indices have since entered choppy trading conditions within the lower half of Friday’s sell-off, though prices have been drifting higher in a corrective manner. Specifically, markets appear to be in the midst of a dead cat bounce, and with momentum turning lower once more, I’m now on guard for another leg down.
View related analysis:
Wall Street Indices: Are Rebounds Just Dead Cats Bouncing?
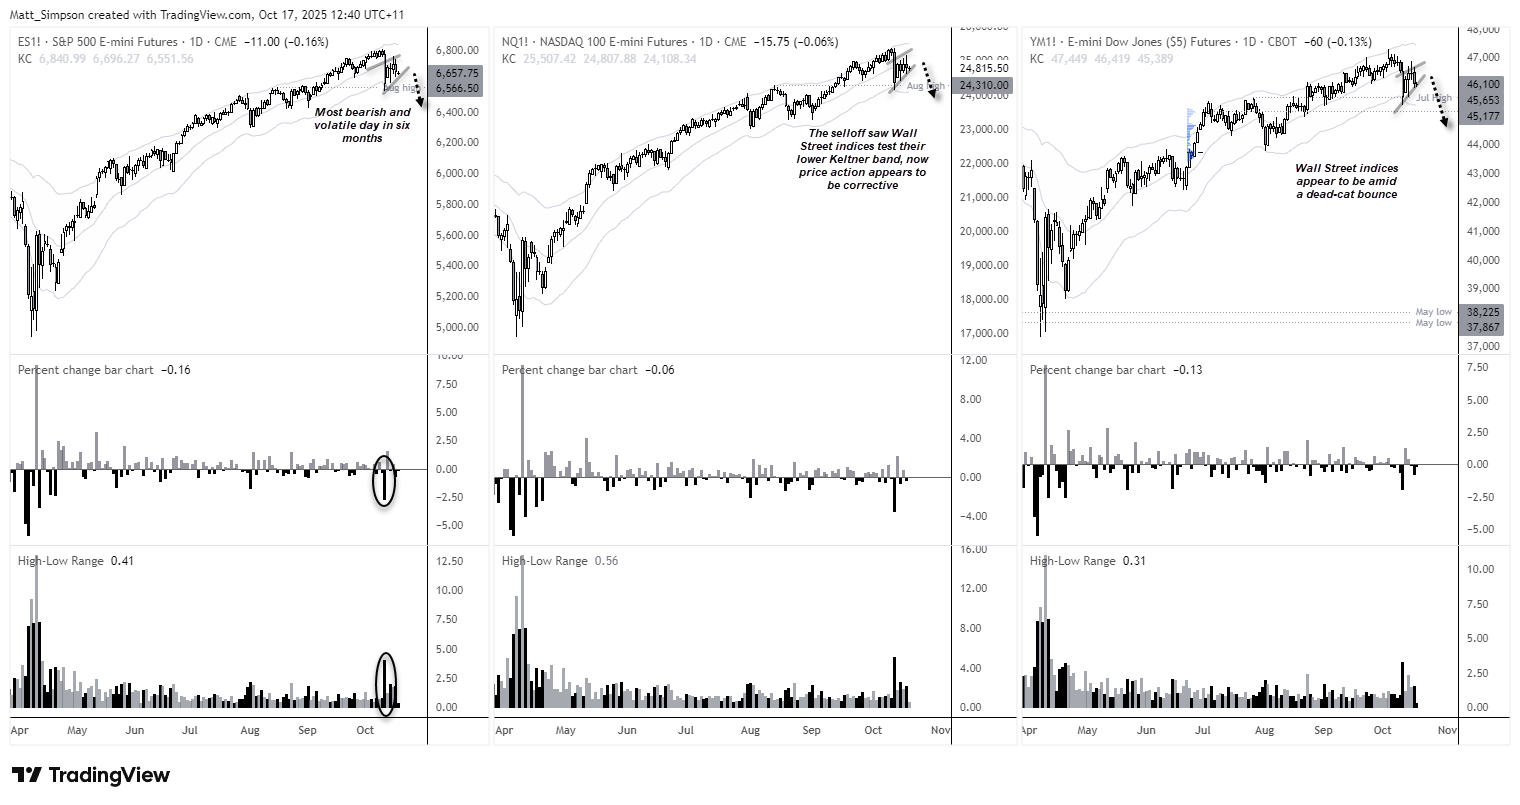
Chart analysis by Matt Simpson, Source: TradingView, CME, CBOT
A dead cat bounce is a short-lived rebound in prices during a broader downtrend. It occurs when a heavily sold market — such as a stock index, currency, or commodity — briefly rallies before resuming its decline. The move is typically driven by short covering, bargain hunting, or temporary optimism rather than a genuine shift in fundamentals or sentiment.

Nasdaq 100 Futures (NQ1!) Technical Analysis
The daily chart shows the Nasdaq correction has entered its fourth day, with prices gapping lower beneath the 20-day EMA. A bearish doji formed on Thursday, signalling waning bullish momentum, while a bearish RSI(14) divergence appeared ahead of last Friday’s sell-off.
The 1-hour chart shows a swing high beneath a weekly VPOC (25,218), with prices now trading below the 200-bar EMA and high-volume node (HVN) of the four-day correction. Bears could look to fade into moves within Thursday’s range, initially targeting the monthly pivot point at 24,400. A break beneath this level brings the 24,000 handle into focus, near the 100% projection level.

Chart analysis by Matt Simpson, Source: TradingView, CME Futures, NASDAQ 100 E-mini Futures
S&P 500 Futures (ES) Technical Analysis
The S&P 500’s daily price action mirrors that of the Nasdaq 100 and Dow Jones, with the 1-hour chart showing a lower high ahead of a break below the 200-bar EMA. Prices are now testing the monthly pivot point, suggesting sellers remain in control.
Bears could look to fade rallies within Thursday’s range, anticipating a sustained break beneath the pivot. Momentum currently shows little appetite for a recovery bounce, reinforcing the downside bias.
The monthly S1 support sits near the 6,540 low, offering a logical initial target for S&P 500 bears.

Chart analysis by Matt Simpson, Source: TradingView, CME Futures, S&P 500 E-mini Futures

Dow Jones Futures (YM) Technical Analysis
The daily chart shows the Dow Jones forming a doji near the 2024 high before momentum turned lower. Thursday’s bearish engulfing candle completed an evening star reversal pattern, signalling fading bullish strength. While prices are still holding above the 50-day EMA, the bias favours a break beneath it in the coming sessions.
The 1-hour chart reveals a head-and-shoulders top preceding the recent sell-off, with prices now trading below the monthly pivot point. Bears may look to fade rallies towards the pivot, targeting the monthly S1 at 45,670 and the 45,387 low, with a break below that exposing the 44,983 support area.
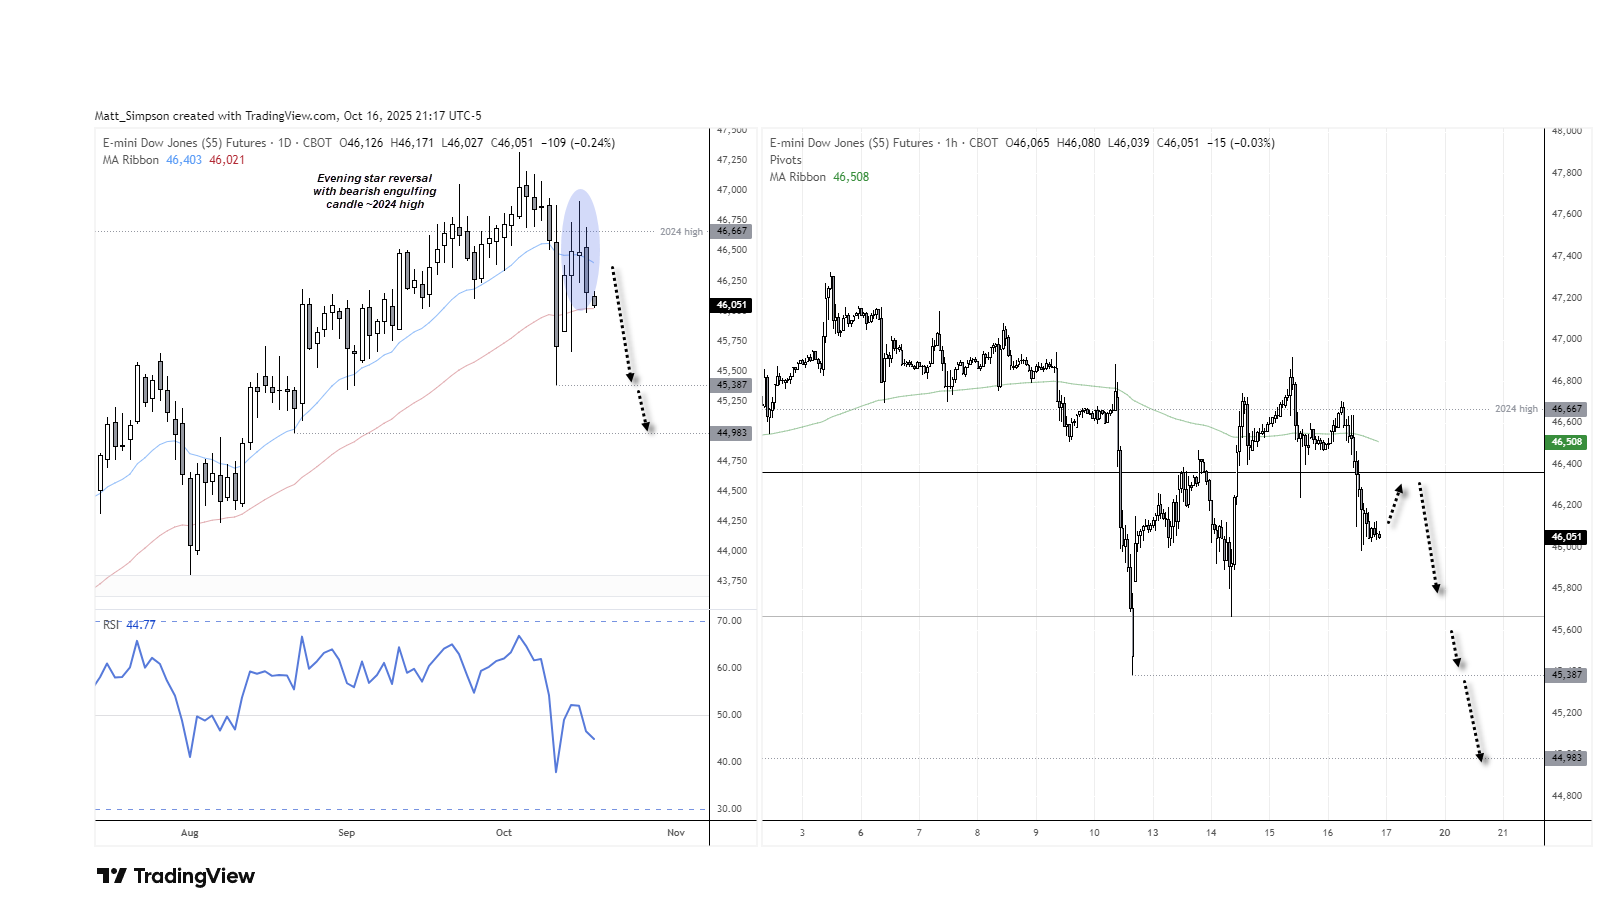
Chart analysis by Matt Simpson, Source: TradingView, CBOT Futures, Dow Jones E-mini Futures
View the full economic calendar
-- Written by Matt Simpson
Follow Matt on Twitter @cLeverEdge
How to trade with City Index
You can trade with City Index by following these four easy steps:
- Open an account, or log in if you’re already a customer
• Open an account in the UK
• Open an account in Australia
• Open an account in Singapore
- Search for the market you want to trade in our award-winning platform
- Choose your position and size, and your stop and limit levels
- Place the trade
Related tags:







Web Trader platform
Our sophisticated web-based platform is packed with features.
Open an account today
Experience award-winning platforms with fast and secure execution.
Economic calendar
Related articles

Euro Short-term Outlook: EUR/USD Pullback Nears Pivotal Uptrend Support 8 28 2026
Warsh's comments accelerated the EUR/USD selloff, raising the stakes as buyers look to stabilize the broader recovery.


Gold and S&P 500 analysis: What now after Warsh’s hawkish speech?
The dollar surged across the board after the Fed Chair Kevin Warsh surprised with a hawkish-leaning speech at the Jackson Hole summit. All the bearish dollar bets that had been accumulated since last Friday on the back of data weakness and bond market troubles had to be squared and that triggered a short squeeze rally for the dollar. Gold and silver dropped, as a result, as too did bitcoin, while US indices were giving back earlier gains.


Nasdaq 100 Forecast: NDX slips ahead of Fed Chair Warsh’s speech
U.S. stocks are edging lower on Friday, giving back some of yesterday's gains after Nvidia's strong outlook revived the tech trade. The focus has now shifted firmly to Fed Chair Kevin Warsh's Jackson Hole speech, with investors looking for more clarity on the outlook for interest rates.
