


Nasdaq 100 Update NDX attempts to reach 30k again
The trading week is coming to an end, and the Nasdaq 100 has shown important recovery attempts in the short term. Over the last 2 sessions, the index has posted a gain of just over 2.6%, trying to maintain some confidence in its recent movements.
Written by
Julian Pineda
Market Analyst
The trading week is coming to an end, and the Nasdaq 100 has shown important recovery attempts in the short term. Over the last 2 sessions, the index has posted a gain of just over 2.6%, trying to maintain some confidence in its recent movements.
This recovery has taken place amid greater calm around the geopolitical conflict in the Middle East, which has allowed confidence to normalize somewhat. However, buying strength still does not appear strong enough to confirm a dominant bullish bias.
In addition, CPI inflation data in the United States will be released next week, an event that could generate a more consistent phase of indecision over the next few trading sessions.

Can confidence remain stable?
The trading week brought some complications for market risk sentiment. Around the middle of the week, a new wave of attacks in the Middle East was reported, initially raising concerns over a possible escalation of the conflict in the short term.
However, toward the end of the week, escalation risks have moderated. Comments from the United States suggest that there have been no new rounds of attacks and that talks with Iran are continuing without interruption for now.
For now, the market appears to have interpreted this with some optimism. The event has not been alarming enough to generate a major shift in short-term confidence, something reflected in the recent behavior of the Fear and Greed Index. The indicator shows a sustained move near the 50-point area, leaving behind the “fear” zone seen in previous weeks and moving closer to the middle of “neutral” territory.
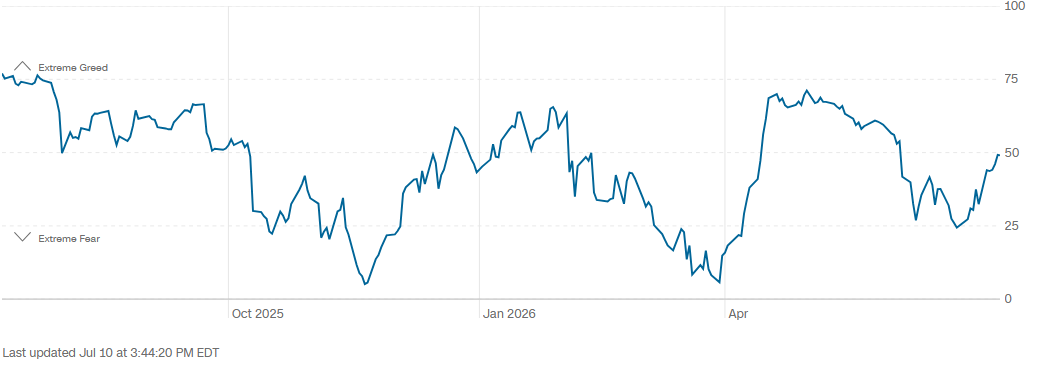
Source: CNN
Demand behavior also shows that, although strength has declined, it has not yet moved into risk territory for the index. This can be seen in the dynamics of the Invesco Nasdaq 100 ETF, which was still recording some capital inflows in recent sessions, although only slightly.
On July 8, the ETF showed an inflow peak near 300 million dollars, reflecting that capital activity is trying to hold up in the index despite the week’s geopolitical complications. Overall, demand remains active, although with limited strength in the short term.
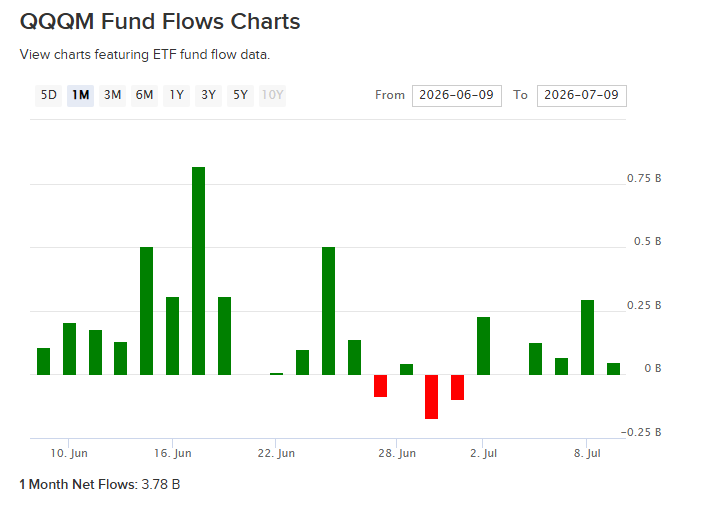
Source: ETFDB
For now, the attempted escalation of the conflict in the Middle East has not been enough to generate a relevant loss of confidence toward risk assets. Although it has created caution around demand for indices such as the Nasdaq 100, it has not triggered a significant capital outflow.
However, demand strength looks quite limited compared to previous weeks. This indicates that the Nasdaq 100 remains sensitive to this type of geopolitical event in the short term. Any relevant reactivation of the conflict could quickly bring uncertainty back to markets and highlight possible selling pressure on the index over the next few sessions.
What to expect from U.S. CPI?
Next Tuesday, CPI inflation data in the United States is expected to be released. For now, the market expects a 3.8% reading for June, compared to the previous 4.2% figure in May. The key point will be the impact this data could have on Federal Reserve monetary policy expectations.
For now, inflation remains far from the 2.00% target set by the U.S. central bank. If the data does not show a meaningful slowdown, the scenario of higher interest rates in the U.S. economy could remain in place.
At the moment, the probability table continues to show that, for the September 16 decision, there is a probability of just over 51% of a possible interest rate increase, with the current reference rate standing at 3.75%.
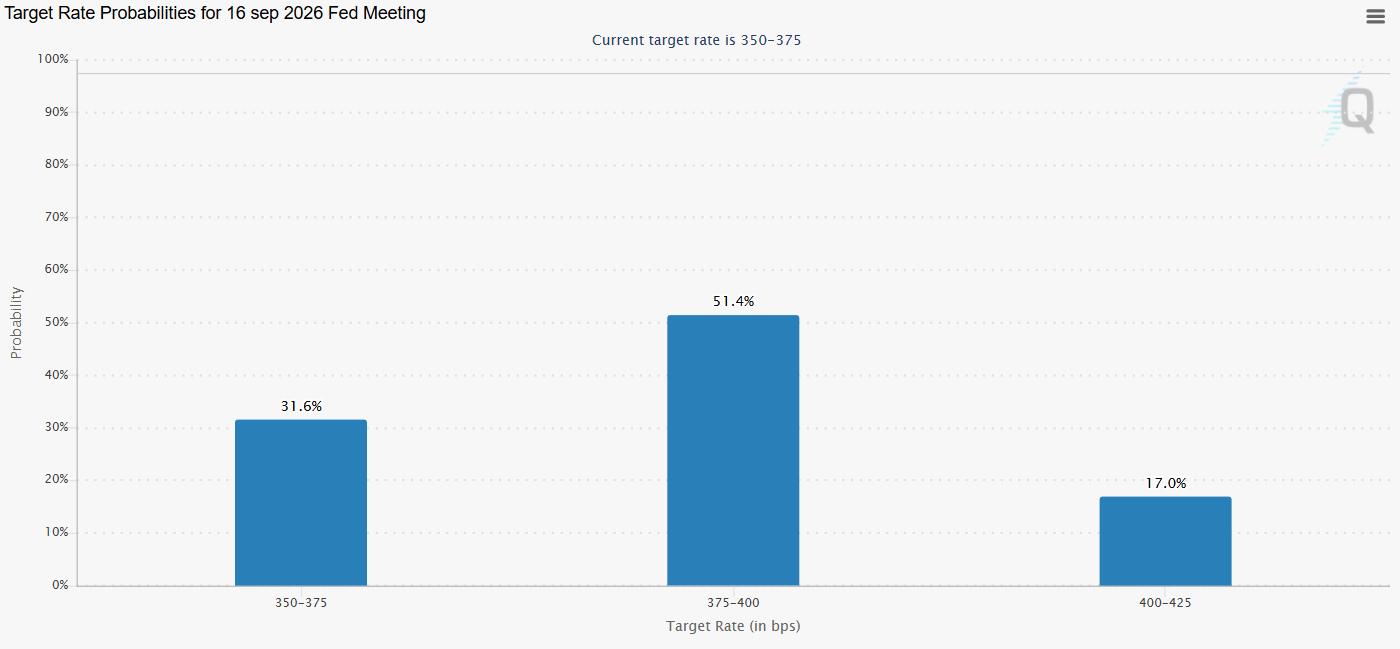
Source: CMEGROUP
This relationship is relevant because stronger-than-expected inflation data could reinforce the idea of a more aggressive Federal Reserve over the coming months. Potential interest rate hikes could increase debt costs, reduce available liquidity for consumption, and limit companies’ sales and earnings margins.
This scenario could create a difficult environment for confidence around equity indices such as the Nasdaq 100 to remain consistent. For this reason, higher-than-expected inflation and a more aggressive central bank could highlight possible weakness in the index over the coming weeks.
Technical outlook for the Nasdaq 100
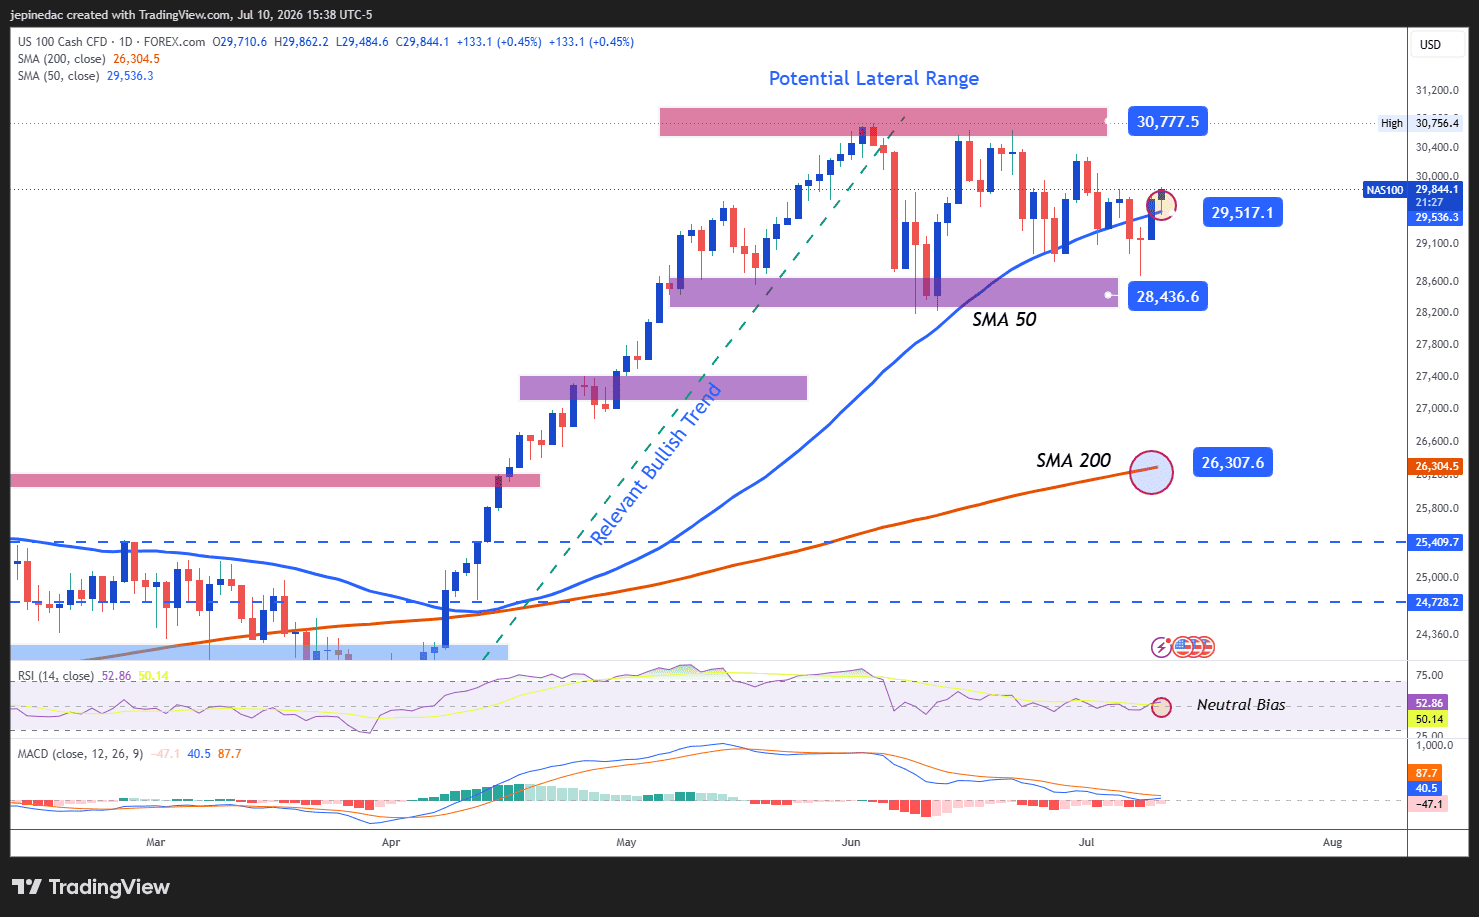
Source: StoneX, Tradingview
- Sideways range remains relevant: Despite the Nasdaq 100’s recovery attempt over the last 2 sessions, the bullish moves have not been enough to eliminate the sideways range that has dominated the chart for several weeks. As long as price fails to break out of the barriers marked by this range, the phase of indecision could remain relevant and make it harder for clearer directional moves to form in the short term.
- RSI: The RSI indicator line continues to move around the 50 level. This suggests a balance between buying and selling impulses in the short term. This reading indicates that neutrality remains relevant in the chart’s movements and could continue to be important over the next few sessions.
- MACD: A similar scenario can be seen in the MACD indicator, whose histogram remains very close to the neutral 0 line. This suggests balance in the strength of short-term moving averages. This reading also highlights possible indecision that still remains part of the chart’s movements.
Key levels:
- 30,770 points – Relevant resistance: This area corresponds to the index’s all-time highs and remains the main bullish reference. A move toward this level could strengthen the buying bias and reactivate the bullish trend seen in previous weeks.
- 29,500 points – Near-term barrier: This level works as an important neutral zone, as it coincides with recent retracements and the 50-period simple moving average. If price continues to move close to this reference, the phase of indecision could extend and keep the sideways range in place over the next few sessions.
- 28,420 points – Key support: This area coincides with relevant lows from recent weeks and remains the main bearish barrier. Sustained moves below this level could reinforce the selling bias and open room for more consistent downside pressure over the coming weeks.
Written by Julian Pineda, CFA, CMT – Market Analyst
Follow him on: @julianpineda25







Web Trader platform
Our sophisticated web-based platform is packed with features.
Open an account today
Experience award-winning platforms with fast and secure execution.
Economic calendar
Related articles

Gold and S&P 500 analysis: What now after Warsh’s hawkish speech?
The dollar surged across the board after the Fed Chair Kevin Warsh surprised with a hawkish-leaning speech at the Jackson Hole summit. All the bearish dollar bets that had been accumulated since last Friday on the back of data weakness and bond market troubles had to be squared and that triggered a short squeeze rally for the dollar. Gold and silver dropped, as a result, as too did bitcoin, while US indices were giving back earlier gains.


Nasdaq 100 Forecast: NDX slips ahead of Fed Chair Warsh’s speech
U.S. stocks are edging lower on Friday, giving back some of yesterday's gains after Nvidia's strong outlook revived the tech trade. The focus has now shifted firmly to Fed Chair Kevin Warsh's Jackson Hole speech, with investors looking for more clarity on the outlook for interest rates.


Jackson Hole Returns: Nikkei 225 and Nasdaq 100 Volatility in Focus
Historical Jackson Hole returns point to elevated Nikkei 225 volatility around Fed speech day, with Nasdaq 100 direction hinging on Kevin Warsh.
