


Nasdaq, Bitcoin Forecast: Crude Oil Surge Toward $90 Threatens Market Recovery?
US-Iran tensions and crude oil's rally toward $90 are weighing on Nasdaq and Bitcoin, reinforcing inflation concerns, higher Treasury yields, and key technical resistance levels.
Written by
Razan Hilal
Market Analyst
US equity markets enter the second half of 2026 facing a growing contradiction. On the surface, the macro backdrop appears supportive for risk assets. US inflation has cooled from 4.2% to 3.5%, while earnings from major US banks and AI-related chipmaker ASML have largely exceeded expectations, reinforcing the narrative of economic resilience.
However, US indices remain capped within multi-month consolidation ranges below record highs as geopolitical risk premiums return, lifting crude oil prices more than 30% back toward the $90 mark following a near 40% correction from yearly highs during the temporary US-Iran ceasefire framework.
- SPX500 extends its consolidation below 7,500
- Nasdaq remains below its multi-month consolidation resistance at 29,200
- Russell 2000 holds gains near 290, with monthly momentum reaching overbought conditions last seen in 2021
Rising Treasury Yields Add Pressure to Growth Stocks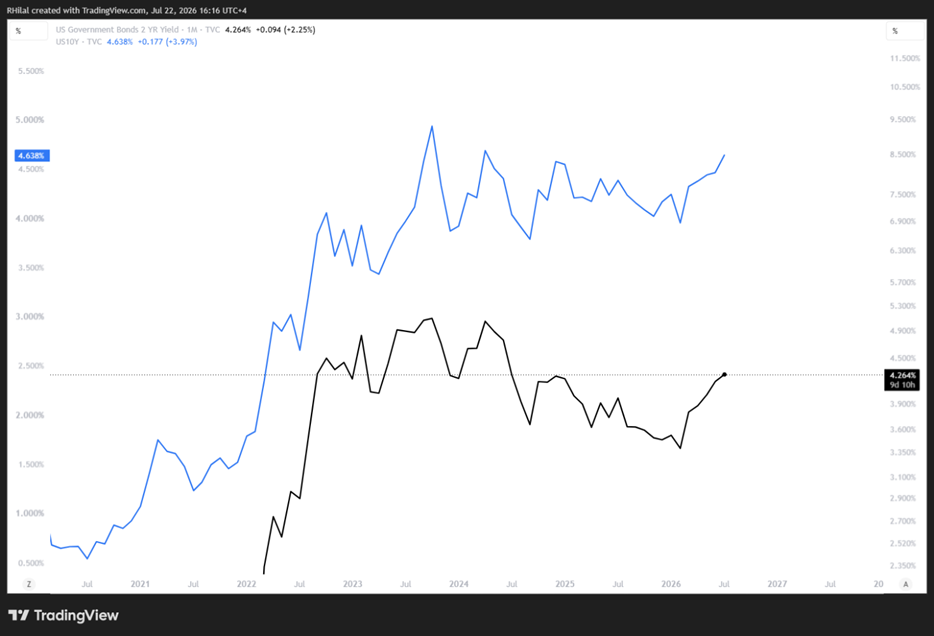
Source: Trading view
Meanwhile, Treasury yields have climbed back toward yearly highs, with the US 2-year yield above 4.2% and the 10-year yield above 4.6%, increasing valuation pressure on growth-oriented sectors that rely heavily on future earnings expectations, particularly artificial intelligence.
Oil is therefore becoming far more than a commodity story—it is increasingly becoming a valuation story for global equities as the US-Iran conflict persists.
These risks point to the possibility of another market drawdown should a durable agreement between the United States and Iran regarding the governance and security of the Strait of Hormuz fail to materialize, particularly as risks continue to build across Red Sea shipping routes.
The first half of 2026 benefited from several buffers that helped cushion the economic impact of regional disruptions. Strategic reserves, accumulated inventories, alternative shipping routes, and previously stored energy supplies softened the initial shock.
The second half of the year may prove more challenging as markets increasingly shift their focus from oil availability toward oil transportation.
The comparison with the 1970s oil embargo provides valuable historical patterns that may help investors filter through the current market noise, as discussed in my latest crude oil outlook: Crude Oil Outlook: What the 1973 Oil Embargo Tells Us About the 2026 Hormuz Crisis
Bitcoin Price Outlook: Daily Time Frame – Log Scale
Source: Trading view
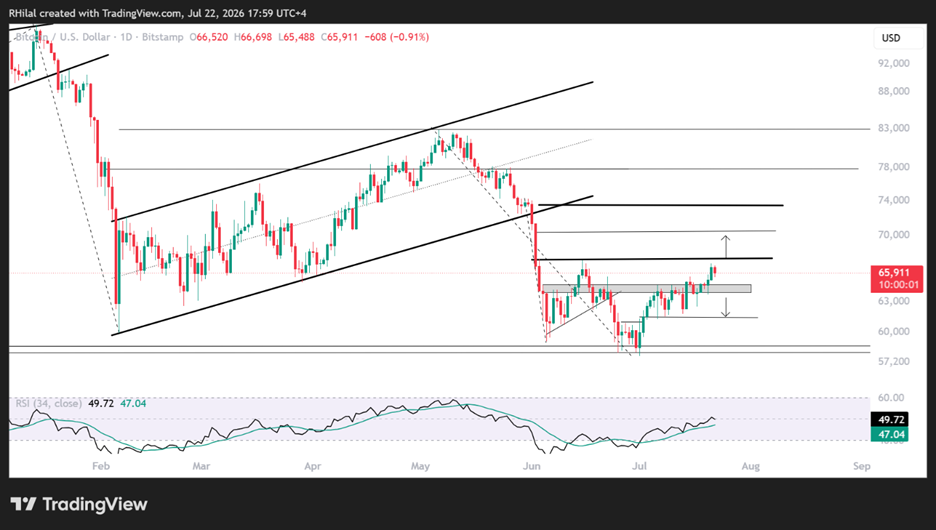
From a daily perspective, Bitcoin's 15%+ rebound from yearly lows is retesting the 67,000 resistance, which aligns with the 38.2% Fibonacci retracement of the May-July decline.
Daily RSI is also testing its resistance near the neutral 50 level from below, while the 4-hour RSI is approaching overbought territory, suggesting the rebound may face short-term exhaustion.
Bearish Scenario
A decline back below the 63,000 zone would expose the yearly lows once again, with the 60,000 and 58,000 levels becoming the next key support areas.
These levels could either trigger another rebound or open the door for a deeper correction toward the August 2025 lows near 50,000, presenting another potential long-term dip-buying opportunity.
Bullish Scenario
A confirmed breakout above 67,000 is needed to reinforce the sustainability of the current recovery.
If achieved, the next upside targets stand at 70,000 followed by 74,000.
Nasdaq Price Outlook: Daily Time Frame – Log Scale
Source: Trading view
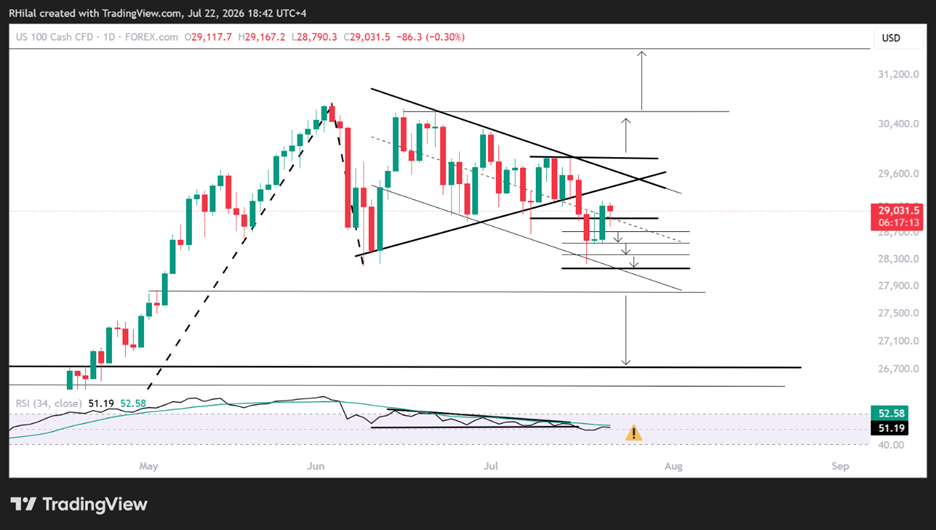
Nasdaq's technical outlook remains tilted toward a bearish bias, with both price action and momentum continuing to trade below the boundaries of the contracting consolidation that developed between June and July 2026.
Bullish Scenario
To regain upside momentum, Nasdaq must first reclaim the lower boundary of the consolidation above 29,400.
This would place the 29,800 resistance back into focus, where price could either experience another pullback or confirm a breakout toward the record highs near 30,400 and 30,600.
A sustained breakout above those levels would reinforce the broader uptrend, opening the way toward 31,600 and eventually 32,600.
Bearish Scenario
A break below 28,600 followed by 28,300 would expose the important 28,000 support area.
Failure to hold above this zone could extend the correction toward 27,700 and 26,700, aligning with Fibonacci retracement levels of the March-June advance.
Those levels may offer fresh dip-buying opportunities, particularly if geopolitical tensions ease, crude oil prices stabilize, and inflation and growth expectations improve following progress in the US-Iran conflict.
Written by Razan Hilal, CMT
Follow on X: @Rh_waves







Web Trader platform
Our sophisticated web-based platform is packed with features.
Open an account today
Experience award-winning platforms with fast and secure execution.
Economic calendar
Related articles

Canadian Dollar Forecast: USD/CAD Weekly Reversal Puts Yearly Uptrend Back in Focus 8 29 2026
USD/CAD has staged its strongest weekly advance since June, shifting the focus to whether a more durable low is finally taking shape.


USD/JPY weekly outlook: Payrolls may challenge the Fed’s hawkish reset
USD/JPY has finally woken from its slumber. Payrolls now loom as the key test of whether the latest hawkish repricing sticks or sinks.


Euro Short-term Outlook: EUR/USD Pullback Nears Pivotal Uptrend Support 8 28 2026
Warsh's comments accelerated the EUR/USD selloff, raising the stakes as buyers look to stabilize the broader recovery.