

NZD/USD Forecast: Kiwi faces historic breakdown as RBNZ survey looms
NZD/USD is teetering above support that held through the pandemic and Liberation Day turmoil. With RBNZ hawks repeatedly disappointed, today's inflation expectations survey could open the door to a slide towards the GFC lows.
Written by
David Scutt
Market Analyst
- RBNZ inflation survey due 3pm Wellington time
- Dollar strength, relative rates hammering NZD/USD
- Markets price 89% probability of December hike
- Historic support break risks deeper Kiwi collapse
The New Zealand dollar is under the pump as the US dollar surges on the back of a dramatic hawkish repricing of the Federal Reserve's interest rate outlook. With broader risk appetite also deteriorating, the Kiwi is facing mounting pressure from external forces, with NZD/USD now teetering above historically important support levels.
But the pressure on the flightless bird isn't just coming from offshore. It's also domestically driven. Since the RBNZ's last Survey of Expectations three months ago, the bank has consistently delivered dovish surprises relative to hawkish market pricing, adding to the Kiwi's woes. That makes today's updated survey a significant risk event for the New Zealand dollar, with a weak reading potentially providing the catalyst for NZD/USD to break beneath a key support zone that has held during some of the most turbulent market periods in recent history.
External forces hammer NZD/USD
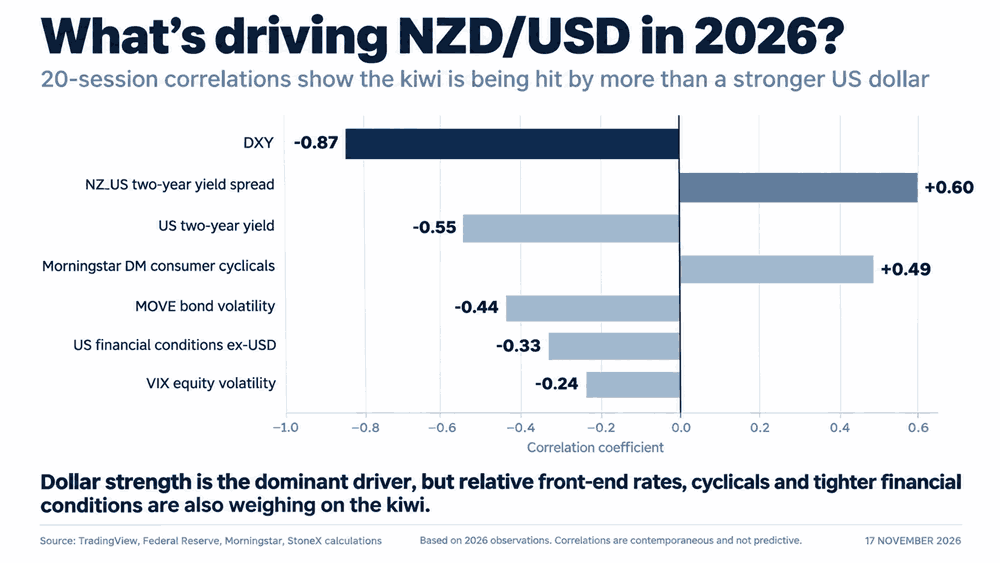
The Kiwi has been especially sensitive to movements in the US dollar this year. As seen in the graphic below, the correlation between 20-session NZD/USD returns and changes in DXY stands at an exceptionally strong −0.87. Given the recent aggressive repricing of the Fed interest rate outlook, especially relative to earlier this year, the surge in the greenback to its highest levels since Liberation Day has hammered the Kiwi.
Source: TradingView
But it's not just a dollar story. Our research also reveals meaningful relationships with two-year interest rate differentials between the two nations, developed-market consumer cyclical stocks and US bond market volatility, as measured by the MOVE index. Tighter US financial conditions, even after stripping out the dollar effect, have also coincided with Kiwi weakness, likely through the risk appetite channel. While there's no single driver, what's clear is that these factors are currently working together to push NZD/USD lower.
RBNZ hawks are gluttons for punishment
Since the last Survey of Expectations was released in August, the RBNZ has consistently delivered dovish surprises relative to hawkish market pricing, repeatedly frustrating traders' ambitions for a more aggressive tightening cycle.
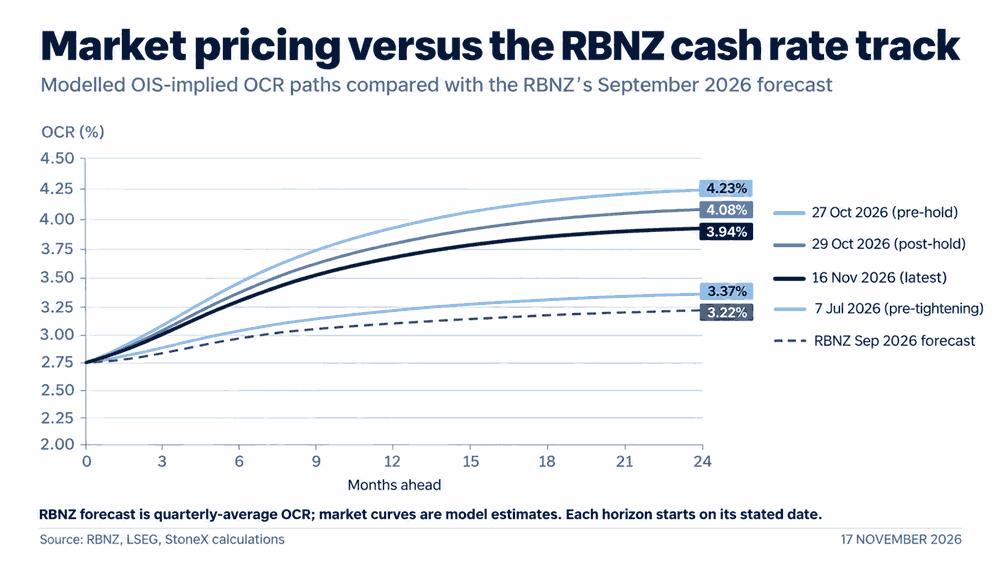
In September, the RBNZ raised interest rates but accompanied the decision with a much shallower and more elongated cash rate track than markets had anticipated. It followed that up in October by unexpectedly leaving rates unchanged in a 4–3 split decision, despite markets pricing around a 90% probability of another hike. Yet, as the graphic below shows, markets continue to price a considerably more aggressive tightening cycle than the RBNZ projected in September.
Source: LSEG
That makes today's updated survey especially important. With the RBNZ having repeatedly disappointed the hawks, the latest two-year reading, which the Bank tends to place particular emphasis on, could either provide fresh ammunition for those expecting it to have to hawk up or reinforce its recently expressed reluctance to move as quickly as markets anticipate.
RBNZ inflation expectations survey takes centre stage
For those outside New Zealand, a quarterly survey of economists, professional forecasters and business leaders may not sound like a particularly important market event. But the RBNZ's Survey of Expectations is anything but, especially given the central bank's recent policy surprises.
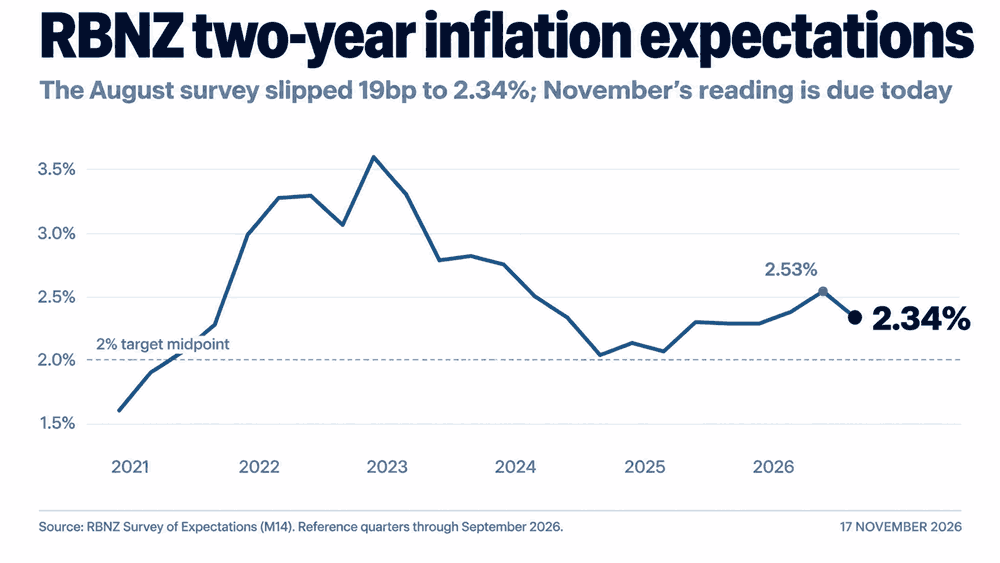
As the graphic below shows, two-year inflation expectations fell 19 basis points to 2.34% in August, moving closer to the RBNZ's 2% target midpoint.
Source: RBNZ
And we know the RBNZ is watching closely. Chief economist Paul Conway, who was one of three policymakers to vote for a hike in October, expressed concern last week that longer-term inflation expectations remain above the Bank's 2% target midpoint, adding to the emphasis on today's outcome.
History suggests a high bar for RBNZ hawks
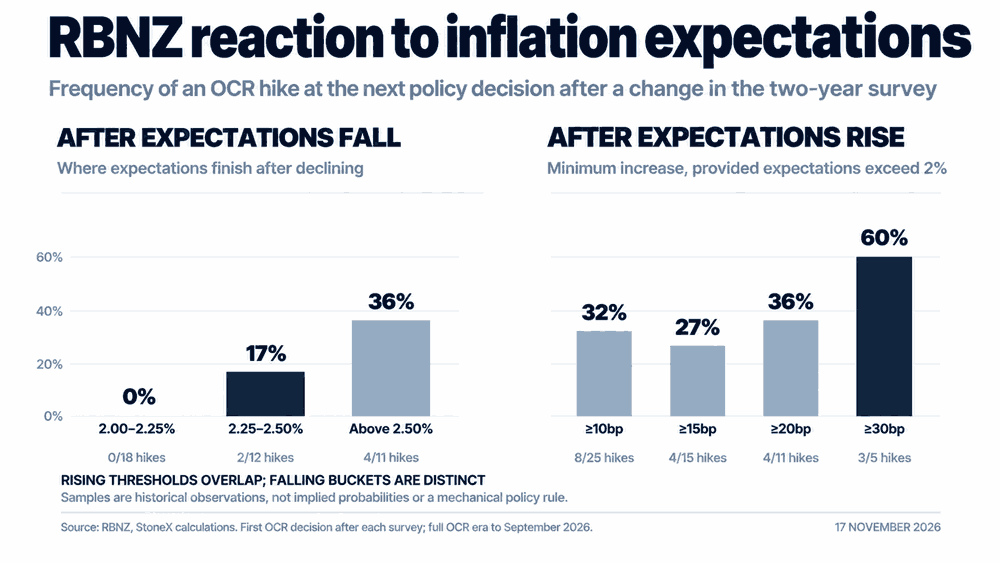
Our analysis of historical RBNZ policy decisions suggests changes in two-year inflation expectations have influenced subsequent interest rate decisions. When expectations have declined into the 2.25–2.50% range, the Bank has raised rates at its next meeting on only two of 12 occasions, including September's decision. In contrast, increases of at least 30 basis points when expectations are already above 2% have been followed by hikes 60% of the time, although that's based on a relatively small sample of just five historical observations.
Source: RBNZ
What we do know is that markets are still pricing a far more aggressive tightening cycle than the RBNZ's September cash rate track, suggesting it may take a substantial upside shift in today's two-year measure to see the Bank get anywhere near those expectations. And if we were to see another decline, it could raise serious doubts about just how far the Bank will ultimately take policy settings into restrictive territory, including whether it will hike again in December, a move markets currently assign an estimated 89% probability.
Historic support under the pump
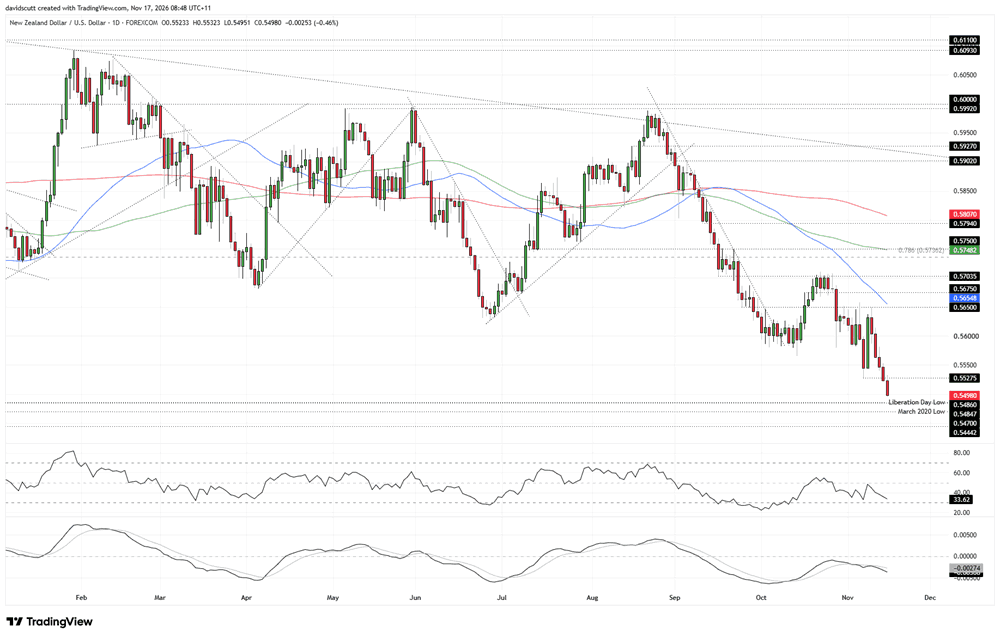
The NZD/USD daily chart just looks bearish, with the price trading beneath its medium and long-term moving averages while consistently setting lower highs. It's now approaching a historically important support zone comprising the Liberation Day low at 0.5486 and the March 2020 pandemic low at 0.5485. These are levels that have held during some of the most turbulent periods in financial markets over the past six years.
Source: TradingView
Momentum continues to favour the bears. While RSI (14) is yet to register a fresh lower low, it remains in the low 30s, while MACD has staged a bearish crossover in negative territory and continues to diverge from its signal line.
With NZD/USD sitting just above this critical support zone heading into today's RBNZ survey, a weaker inflation expectations reading could provide the domestic catalyst for a breakdown, adding to the pressure already coming from offshore.
On the topside, 0.55275, the November 6 low, is the first minor level to watch, followed by the confluence of the 50-day moving average and horizontal resistance around 0.5650. But the monthly chart provides a bigger warning about what could potentially happen if this historic support zone gives way.
Monthly chart warns of far deeper sell-off
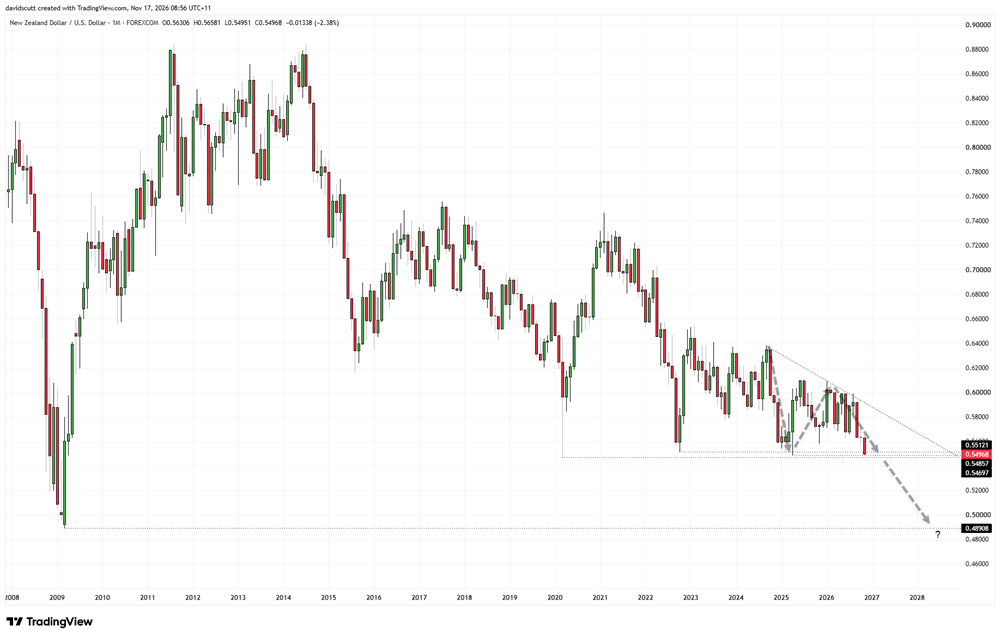
Zooming out, NZD/USD has been coiling within a large descending triangle structure, with the trading range continuing to constrict as the price approaches horizontal support. Even using a conservative starting point for the pattern in 2024, as I have, the sheer size of the structure suggests a sustained breakdown could eventually see the Kiwi revisit the low set during the worst of the GFC in 2009, beneath 49 US cents.
Source: TradingView
There are minor levels in between at 0.5444 and 0.5165 that may attract bids along the way, but neither comes close to matching the historical significance of the support zone currently being tested. If that gives way, the prospect of the Kiwi proving it really can't fly becomes a genuine longer-term technical risk.
Latest market news











Web Trader platform
Our sophisticated web-based platform is packed with features.
Open an account today
Experience award-winning platforms with fast and secure execution.
Economic calendar
Related articles

USD/JPY Weekly Outlook: AI earnings could overshadow the Fed and BoJ
AI sentiment has become a major driver of US Treasury yields and USD/JPY. With Microsoft, Alphabet and Amazon reporting this week, central bank decisions may have competition for traders' attention.

EUR/USD forecast: All eyes on Warsh at Jackson Hole - Forex Friday
For much of this week, the EUR/USD has been edging lower with the US dollar regaining some ground after last week’s sell-off that was triggered, in part, by the bond market worries. Investors have been unwilling to bet further against the US dollar so far this week ahead of Kevin Warsh’s keynote speech at the Jackson Hole summit, due later today.


Bitcoin Forecast: BTC/USD Back to $80K Ahead of Warsh’s Jackson Hole Speech
After surging over $15,000 in the past 10 days alone, there is risk of a near-term pullback if Warsh says anything remotely hawkish at Jackson Hole - what are the levels to watch from here?
