

S&P 500, Nasdaq, Dow Forecast: Rising Yields Test Rally Ahead of Nvidia, Fed 8 22 2026
S&P 500, Nasdaq and Dow test key technical levels as momentum fades, raising the risk of a deeper correction heading into a pivotal week.
Written by
Michael Boutros
Sr. Technical Strategist
Equity Indices Technical Forecast: Weekly Trade Levels
- U.S. equities closed broadly lower this week, with the Nasdaq falling 2.8%, the S&P 500 down 1.4%, and the Dow slipping 0.38%.
- The S&P 500 is approaching technical support after turning from multi-year uptrend resistance.
- Nasdaq deteriorating momentum leaves the technology index vulnerable to a deeper correction – support in view.
- Dow marks a second consecutive weekly decline with the index now testing initial support after rejecting major uptrend resistance.
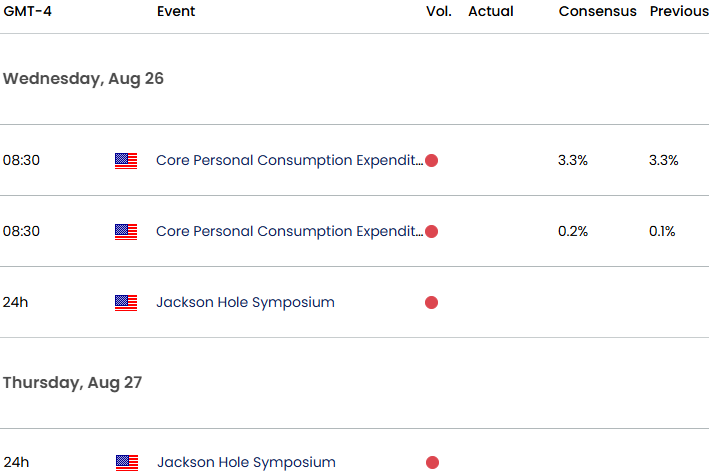
- Major event risk next week with Nvidia earnings, key inflation data (core PCE) and Jackson Hole on tap
U.S. equities are heading into a pivotal week with the major indices pulling back from record highs as rising Treasury yields begin to pressure the broader advance. Nvidia earnings and the Jackson Hole Economic Symposium headline the docket, with both events carrying the potential to drive a larger market repricing. With higher energy prices keeping inflation concerns elevated, the focus remains on whether this decline develops into a deeper correction or simply marks a pullback within the broader uptrend.
S&P 500 Price Chart – SPX500 Weekly
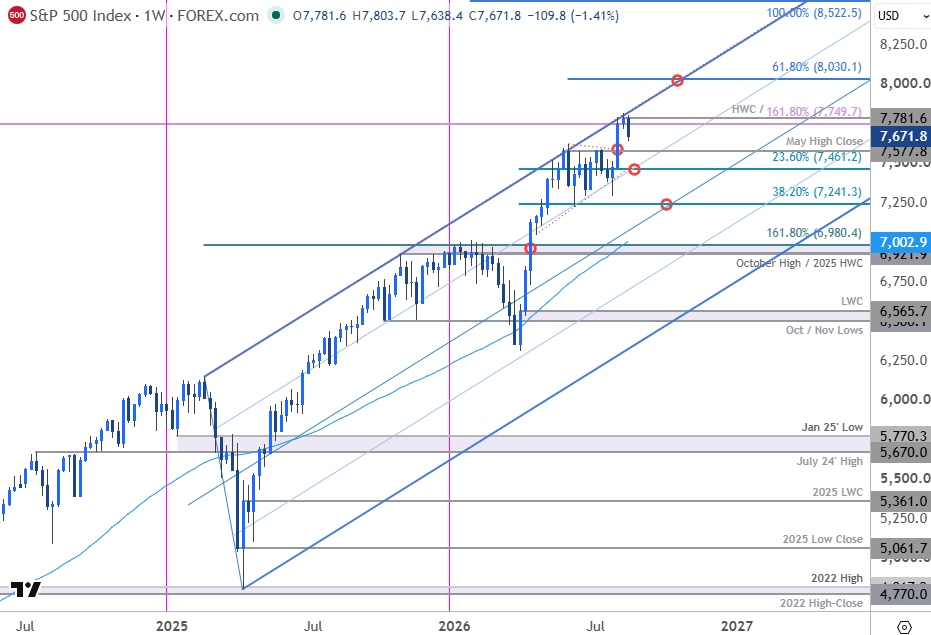
Chart Prepared by Michael Boutros, Sr. Technical Strategist; S&P 500 on TradingView
Technical Outlook: The SPX500 has been trading within the confines of an ascending pitchfork extending off the 2025 low. The index exhausted into the upper parallel last week with the pullback extending nearly 2.3% off the record highs. Initial support rests at the May high close at 7578, backed closely by the 23.6% retracement of the yearly range at 7461. Note that this level converges on the 75% parallel losses below this slope would suggest a more significant near-term high is in place and a larger correction is underway. Subsequent support rests with the 38.2% retracement and the June low at 7224/41.
Weekly resistance is eyed at the 1.618% extension of the broader 2020 advance and the record high-week close (HWC) at 7750/82. A topside breach / weekly close above this level is needed to mark uptrend resumption towards the upper parallel (currently near ~7850s) and the 61.8% extension of the March rally at 8030- look for a larger reaction there IF reached.
Bottom line: The S&P 500 has turned from uptrend resistance, and the focus heading into next week is on whether the bulls back stabilize this recent pullback. From a trading standpoint, losses would need to be limited to 7464 IF the index is heading higher on this stretch with a close above 7781 needed to fuel the next leg of the advance.
Nasdaq Price Chart – NDX Weekly
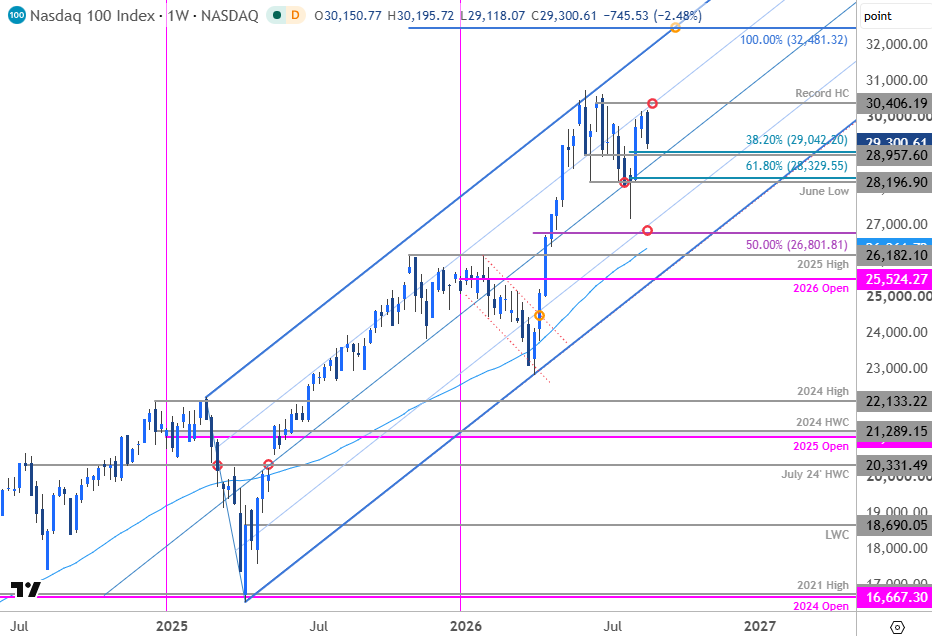
Chart Prepared by Michael Boutros, Sr. Technical Strategist; NDX on TradingView
Technical Outlook: Nasdaq was the worst performer last week with the index marking an outside-week reversal to mark a decline of more than 2.4%. The tech-heavy Nasdaq may be the most interesting index next week as traders face a host of market catalysts. Elevated Treasury yields, Nvidia earnings, and the Jackson Hold World Economic Symposium represent major risks for the bulls into the close of the month. The Nasdaq's sensitivity to long-duration yields make it particularly vulnerable if a more restrictive Fed policy outlook reinforces a higher-for-longer rate environment. Conversely, strong Nvidia guidance combined with stabilizing yields could quickly reignite demand for technology.
NDX has been trading within the confines of an ascending pitchfork extending off the 2025 low with the rally turning just ahead of the record high close this week near the 75% parallel at 30,406. Initial support rests with the record high-week close / 38.2% retracement of the July rally at 28,958-29,042 backed by the June low / 61.8% retracement at 28,197/330. Both levels represent areas of interest for possible exhaustion / price inflection IF reached. Losses below the June low would suggest a more significant correction is underway back towards 27,000.
A topside breach / weekly close above 30,406 would mark resumption of the broader uptrend with subsequent resistance objectives eyed at the 100% extension of the 2025 advance at 32,481.
Bottom line: Nasdaq marked an outside-weekly reversal off uptrend resistance this week and the focus is on whether the bulls can stabilize the pullback above the median line. From a trading standpoint, losses would need to be limited to 28,197 for the late-July rally to remain viable with a close above 30,406 needed to fuel the next major leg of the advance.
Dow Jones Price Chart – DJI Weekly
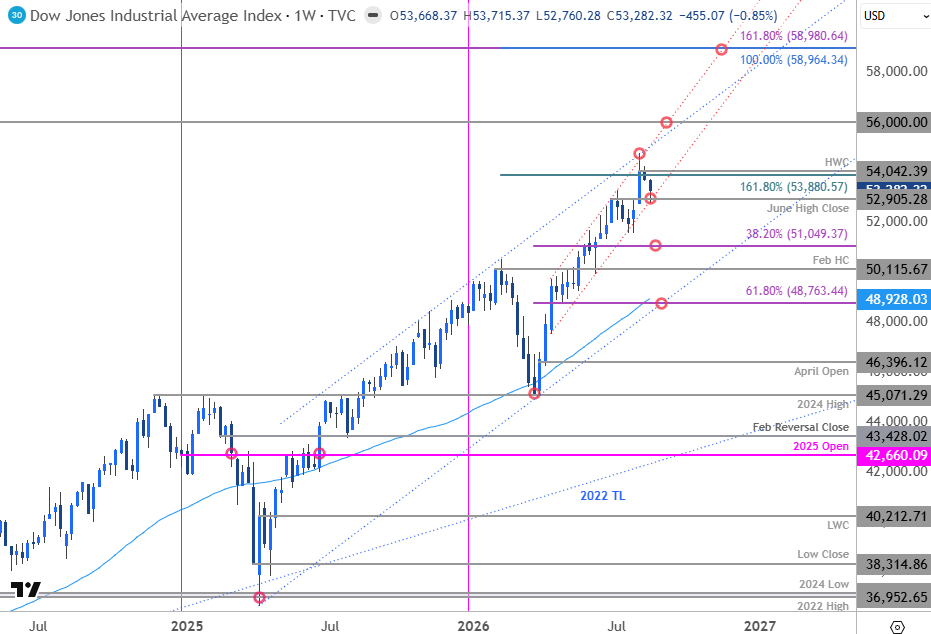
Chart Prepared by Michael Boutros, Sr. Technical Strategist; DJI on TradingView
Technical Outlook: The Dow was the best performer this week with a loss of just 0.78%. The index has been trading within the 2025 channel with the rally exhausting into the upper parallel early in the month. The pullback is now testing support at the lower bounds of an embedded April channel and the June high close at 52,905. Look for a reaction here next week with a break / close below needed to suggest a more significant near-term high is in place, and a larger correction is underway.
Subsequent support rests with the 38.2% retracement of the yearly range at 51,049 and is backed by the February high-close at 50,116. Key support / broader bullish invalidation is now raised to the 61.8% retracement and the 52-week moving average near ~48,763/929. Note that the 2025 trendline converges on this level over the next few weeks and losses below this slope would suggest a larger trend reversal is underway.
Initial resistance is eyed at the 1.618% extension of the yearly range breakout and the record high-week close (HWC) at 53,880-54,042. A topside breach / weekly close above this level is needed to fuel the next major leg of the advance towards the yearly high (54,749) and the upper parallels, currently near ~56K.
Bottom line: The Dow turned from confluent resistance into the start of the month with the subsequent reversal now testing multi-month uptrend support. From a trading standpoint, the focus is on a breakout of the 52,905-54,042 range for guidance here with the long-bias vulnerable while 54K.
Review my latest Weekly Strategy Webinar for an in-depth breakdown of these equity indices and more. Join the session or stream live on YouTube on Monday’s at 8:30am EST.
Key US Economic Data Releases
Economic Calendar - latest economic developments and upcoming event risk.
Active Weekly Technical Charts
- Bitcoin (BTC/USD)
- British Pound (GBP/USD)
- Gold (XAU/USD)
- Euro (EUR/USD)
- Swiss Franc (USD/CHF)
- US Dollar Index (DXY)
- Australian Dollar (AUD/USD)
- Canadian Dollar (USD/CAD)
- Japanese Yen (USD/JPY)
--- Written by Michael Boutros, Senior Technical Strategist
Follow Michael on X @MBForex






Web Trader platform
Our sophisticated web-based platform is packed with features.
Open an account today
Experience award-winning platforms with fast and secure execution.
Economic calendar
Related articles

Canadian Dollar Forecast: USD/CAD Weekly Reversal Puts Yearly Uptrend Back in Focus 8 29 2026
USD/CAD has staged its strongest weekly advance since June, shifting the focus to whether a more durable low is finally taking shape.

USD/JPY weekly outlook: Payrolls may challenge the Fed’s hawkish reset
USD/JPY has finally woken from its slumber. Payrolls now loom as the key test of whether the latest hawkish repricing sticks or sinks.


Euro Short-term Outlook: EUR/USD Pullback Nears Pivotal Uptrend Support 8 28 2026
Warsh's comments accelerated the EUR/USD selloff, raising the stakes as buyers look to stabilize the broader recovery.